Auto sales have been one of the strong parts of the economic recovery in the past couple of years, as shown in the graph below.
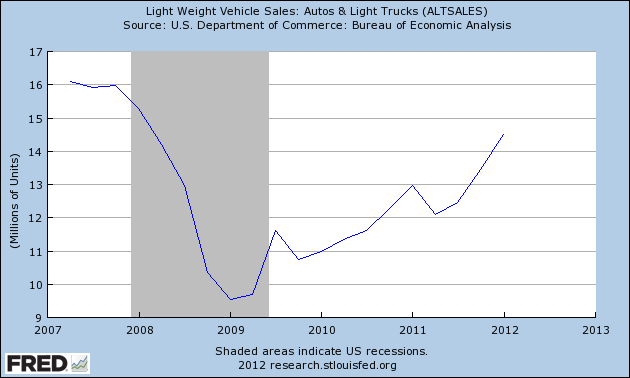
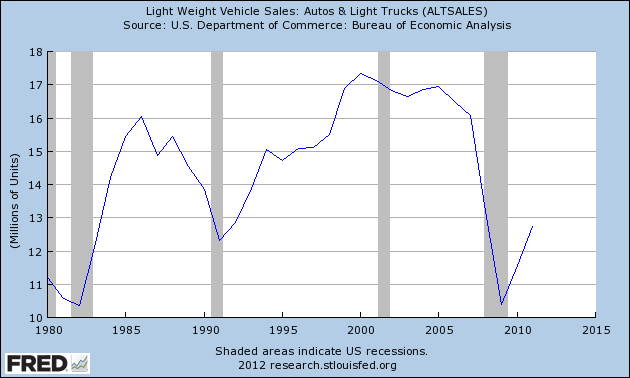
The industry had been beaten down during the recession as consumers got by with whatever they were driving. Looking back over the last thirty years, we can see that we are still below a healthier annual average of about 14 million cars and trucks sold, and far from the peak levels of 17 million.
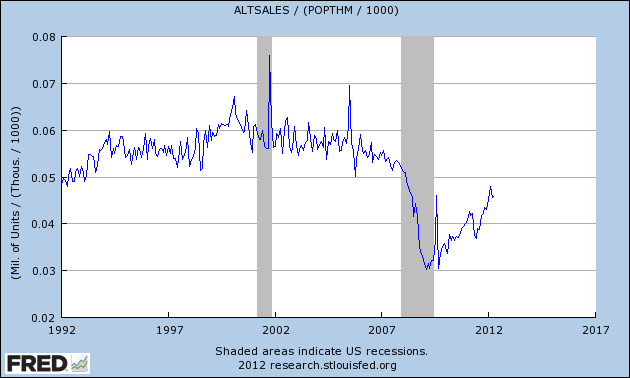
But something more fundamental has changed. We are simply buying fewer new cars per capita. Below is a graph of the number of new cars sold divided by the population.
We are making our cars last longer. The quality and safety of cars has certainly improved but we are simply spending less money per capita on automotive transport. Below is a graph of per capita spending on new autos and auto parts. In 2012, we are spending about the same amount of money as in 1998, despite 14 years of inflation. In real inflation adjusted dollars, we are spending a little less than what we did in 1992.

What these figures do not include is a comparison of the cost of repairs, car insurance and, chief of all, the cost of gas to feed our four wheeled beasts of burden.
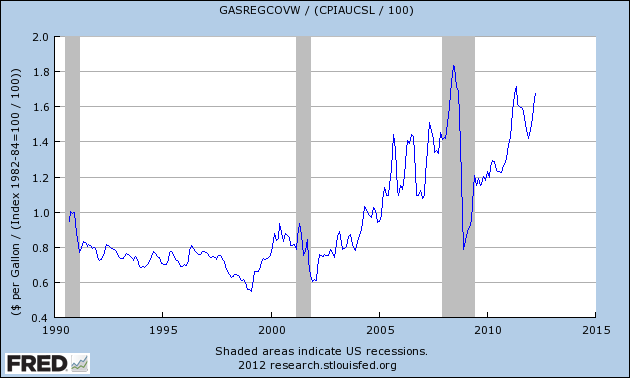
Below is a chart of the weekly average price of gasoline in the U.S. since 1990.

If a gallon of gas cost $1 in the early nineties and the price of gas went up with the rate of inflation, we would expect to pay about $2.30 today. Instead we are paying closer to $4 a gallon. Indexed to inflation, the cost of gas reached its peak under the Bush administration but gas prices are approaching that 2008 peak.
I have already heard several political ads saying that when Obama came into office, gas was $2.50 a gallon and now the price of gas if $4.00 a gallon. Sure, gas was $2.50 a gallon when Bush left office. Oil prices had plummeted in reaction to the global financial crisis. Political ads trust that our memories are short and that we have forgotten just how high gasoline prices had climbed during the Bush administration. Since the average of gasoline prices are relatively lower during the Obama administration than the 2nd Bush term, should we then conclude that Bush’s energy policies were bad and Obama’s are good? The fact is that presidential policies have a teeny tiny effect on the price of gasoline. Political ads and the money machines behind them are like the shell game operators on Times Square in New York City. They hope we are gullible enough to believe their illusions.
