So you’re sitting at a picnic table in the park, having a barbecue with friends and family and one of your kids starts complaining about how life is so unfair because of something or other and you find your mind drifting off to the state of the economy. You feel like telling your kid that, as they grow older, they are going to find that life is full of unfair and to just get over it. But you don’t tell your kid that because they are not strong enough for it yet, which reminds you of Jack Nicholson’s line in the movie A Few Good Men: “You can’t handle the truth!” But you don’t tell that to your kid because it would scare them so you act sympathetic and give your kid a little hug and pretty soon everything is OK again except that about eight feet away from the table Uncle Bob is having an argument with your friend about the money the government is spending.
Uncle Bob is saying that Obama and the Democrats are bringing down this country and your friend counters that it is Obama who trying to resurrect the country after Bush’s eight years as President. You begin to turn your shoulders to them as though to insert yourself into the debate but notice that your wife is looking at you kinda funny from across the picnic table and, while you are not that good at mind reading, there is something in her look that raises a flag of caution in your mind. Your father in law is busy at the barbecue and calls out that the burgers will be ready in five minutes – which gives you just enough time to whip out your iPad and check the Federal Reserve data site to answer a nagging question: what is GDP per person in this country?
Gross Domestic Product accounts for most of the private and government economic activity in a country. GDP doesn’t take into account the money that a government borrows to fund its spending; GDP only includes the spending. GDP doesn’t care what the money was spent for, whether it was to build a bridge in Iowa or destroy a bridge in Afghanistan. Regardless of these and other faults, GDP serves as a report card on a country’s economy.
Real GDP is an inflation adjusted GDP, a way of comparing apples to apples over the years. Real GDP per capita is the inflation adjusted economic output per person.
You type in “Real GDP” into the search box and the Federal Reserve database, or FRED to its many users, obliges you with a list of GDP reports and you select the first one. The full graph comes up showing the years 1947 to 2012. You touch the Edit Graph button, then change the beginning date to 1960.

Both Uncle Bob and your buddy have had a few beers, a beverage which adds certainty to a man’s opinion. You wonder how many of these political-economic debates have occurred this week at the dinner table, at the office, while taking a break on a construction site.
Your iPad screen shows the rise in real GDP with the “hook” starting in late 2007. It is that hook that has got a lot of people arguing. Its the hook that has pulled home values down and given a hard yank on the retirement dreams of many people. That hook tugged away the after school program your kid was in as the school district tightened its belt. That hook took your wife’s job away; it almost took yours.
Now your buddy is talking loudly and pointedly about higher education cuts, but is barely able to finish his sentence as Uncle Bob interrupts him with the tale of the state university vice-president who is getting $300K a year in pension benefits. Bob is sick of paying higher taxes for the fat cat retirements of the elite government employees.
Although the Bureau of Economic Analysis called an end to the recession in June of 2009, every adult with half a brain knows that the recesson didn’t end then. The billionaire investor Warren Buffett uses a rule of thumb that a recession ends when real GDP gets above the high point before the recession began. You touch the “5 year” range button on the screen and see that real GDP has in fact surpassed that high point in 2007 so Buffett probably called and end to the recession in the fall of 2011.

FRED conveniently colors in the recessions, highlighting the periods in gray, but they are the “official” periods of recession, when GDP rises or falls for two consecutive quarters. GDP could fall from $100, for example, to $60, signalling a recession, then increase to $65 over six months and the BEA would say it was the end of the recession, even though any sane person would say “Hey, we’re still down a third from the $100 high point.”
Has the GDP per person surpassed its 2007 high? Your mother-in-law leans over and asks whether you want lettuce and tomato, glances down at the iPad screen with just a hint of disapproval in the set of her mouth and tells you that everyone will be eating soon. OK, just a minute, you tell her.
Touching the screen, you click the “Add Data Series”, then touch line 1. In the box you type “POPTHM”, the population census figures. The other night, you couldn’t remember Bruce Willis’ name from the Die Hard movies but you can remember the label for the population series. You’re not old yet but this is probably what happens to old people’s brains. To get the GDP, which is in billions, per capita, which is in thousands, you need to multiply the GDP dollars by a million before dividing so you type into the formula box: “a * 1000000 / b” and touch the “Redraw Graph” button below it.
FRED redraws the graph, showing that the per capita GDP has still not risen above the 2007 high point.
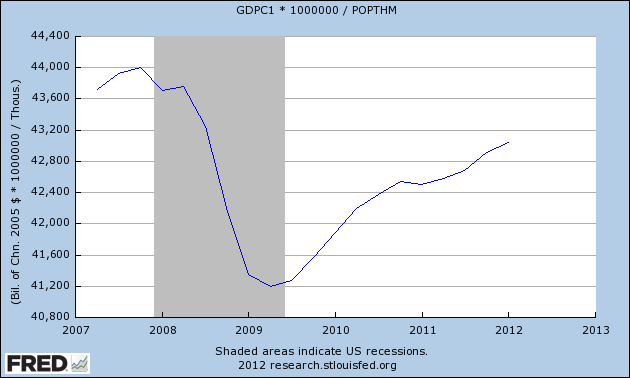
For four and half years we have been in recession, you think. No wonder we are arguing.
Was it as bad as the recession in the early eighties, you wonder. That was a double dip recession. You touch the starting date box and click on 1960 and a new expanded graph appears on the screen. “Hey, hon, why don’t you help me with the ice?” your wife asks. “Ok, just a sec,” you reply, not looking up from the screen.
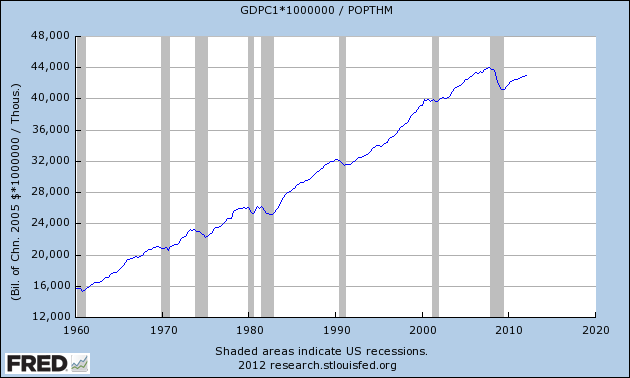
You see that this recession on a per capita basis is about the same as the early eighties, lasting about four and a half years, from late 1978 to mid 1983, with an upward hiccup during that period. The period was the same but the decline in the late 70s and early 80s was much shallower than this current recession.
You want to show both your friend and Uncle Bob why they are arguing, that the recession really hasn’t ended, the comparison of this recession and the 1980s but your wife needs help with the ice so you close the iPad cover. Maybe you can show them the graph after the meal. “Burgers are up!” your father-in-law shouts and the whole group sits down to chow down.
After the meal, your friend hauls out an old croquet set. There are a few hoops missing and one mallet has a head but no handle, but the kids are delighted. At some point in the game, Uncle Bob sends your friend’s ball far afield with a taunt “Out in left field where the liberals belong!” but your friend doesn’t take the bait. On second thought, you muse, showing these guys the graphs would only reignite the debate.
“Daddy, it’s your turn. You can use my mallet,” your kid says and you reach for the mallet, thinking We try to teach our kids to be considerate and cooperative on the playground and in school. So what happens to that sense of cooperation when we grow up?
