December 29th, 2013
In several past blogs here and here, I have noted a “rule of thumb” guide to recessions based on the unemployment rate. When the year over year percentage change in the unemployment rate goes above 0, recession smoke alarms go off. Sorry, no phone app for this alarm. This metric sometimes indicates a recession that doesn’t quite materialize in the economic data, a false positive, although the market may react to the possibility of a recession. Employment is but one factor in a complex economy and no one indicator can stand as a fail safe predictor of a serious enough decline in the economy that it gets labelled “recession” by the NBER.
Another related measure is the total employment level. This employee count comes from the Establishment Survey conducted by the BLS and is the source for the monthly headline job gains or losses. To show the correlation between payroll and economic activity, I took a measure of GDP – I’ll call it active GDP – that excludes changes in business inventories and net exports. From this I subtracted the change in real household debt in each quarter. This measure of economic activity reflects what consumers can actually pay for. Below is a chart of the yearly change in this adjusted measure of GDP and the number of people working. There is a remarkable correlation.

As I will show below, the employment market has not fallen into an unsafe zone but the decline in growth of domestic demand indicates a fragility that should not be overlooked. Comparing the number of people working to the 12 month average reveals trends and weaknesses in the economy. Historically, when the number of workers falls below its 12 month average we are almost certainly in a recession. As of now employment is maintaining a healthy but not robust growth rate.
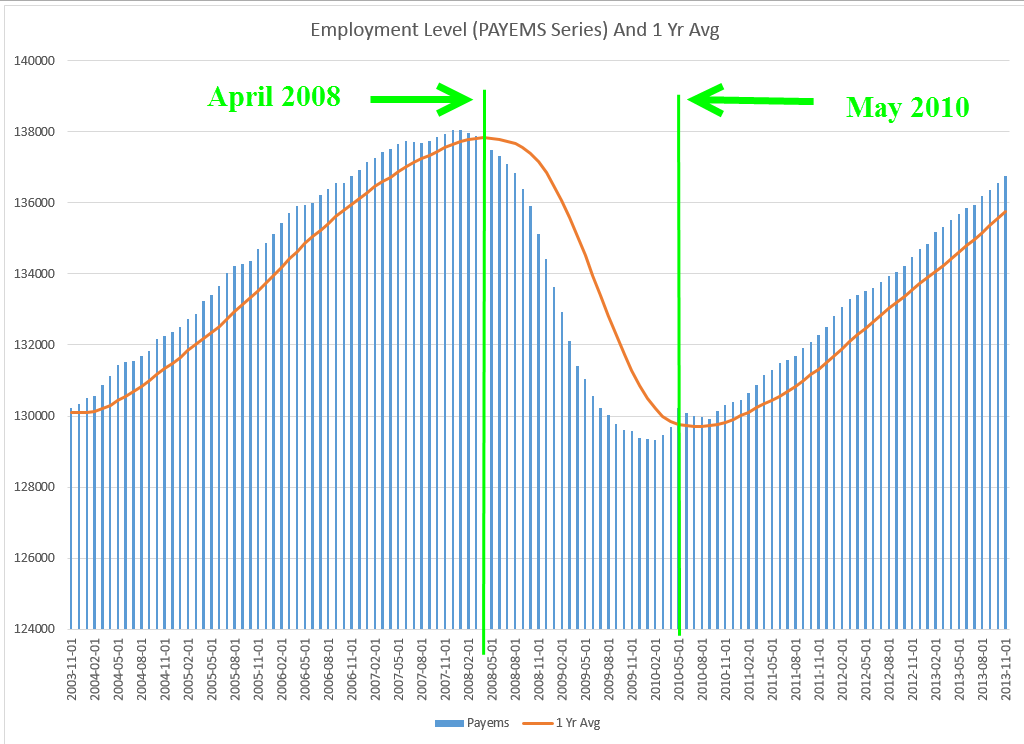
When the difference between the monthly count of people working and its 12 month average (I’ll call it DIFF) falls below 1% (I’l call it WEAK), it shows a pre-recession weakness in the economy. In past decades, this DIFF might fall to .75% before recovering, a temporary weakness. Since June 2000, employment growth has been in a WEAK state, never recovering above 1%. Following the dot com bust in 2000, 2001 included an 8 month recession, the admittance of China to the World Trade Organization and the sucking up of low skilled manufacturing jobs, and the horrific events of 9-11. For two years the country endured a painfully slow and fitful recovery, prompting a Republican Congress to pass what are called the Bush tax cuts. Neither tax cuts or the overheated housing market of the mid 2000s could kick the DIFF above 1% although it got very close for a number of months in late 2005 and early 2006 as the housing market peaked.
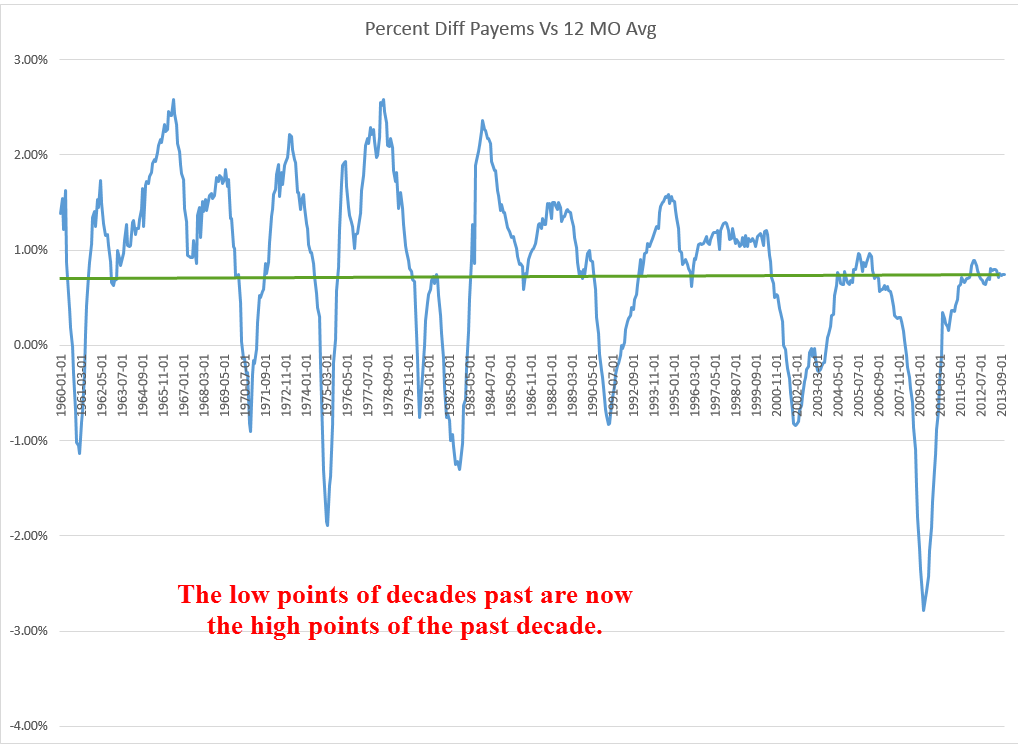
When the DIFF falls below 500, we can mark fairly closely the beginnings and ends of recessions as they are called by the NBER many months later.

It is important to note that historical data is already revised data. We must make investment decisions with the data available at the time. (See an earlier blog for some examples of revisions to payroll data.)
**************************
This week’s reports were generally better than expected. These included durable goods orders, sales of new homes, personal income and spending. Housing prices, as shown by the FHFA purchase only index, are maintaining an 8% year over year change. Over the past quarter century, housing prices have followed a 3.2% annualized growth rate.

**************************
In previous blogs, I have examined the PCE inflation measure that routinely produces the lowest rate of inflation. This is not the headline CPI index but is used to produce what is called a chain type price index. Inflation estimates based on this indicator showed 0% inflation in November and less than 1% for an entire year. Isn’t that great? Rents, food, utility bills, insurances have barely increased over the past year. Yes, I know you are ROFL until you realize that the joke is on you, on all of us.
***************************
Let’s get in the wayback machine and go back to early 2007 when the Bush administration released their estimate of GDP for the years 2007 – 2013. Every Presidential budget indulges in the folly of predicting the future economic growth of the largest economy in the world. When we dig into the figures, the process is rather simple. These estimates simply take actual figures from 2006 and calculate 5% annual growth in nominal GDP. Any of us could do this with an Excel spreadsheet. An unemployment rate below 5% is rather infrequent and unlikely to continue for very long but the Bush Administration projected that this sub-5%level would continue for another six years. If your 12 year old came to you with these calculations, you would probably praise them for their effort and smile inwardly at the innocence of the projections. You wouldn’t tell your twelve year old that things don’t stay rosy indefinitely because they will find that out in due time. This kind of middle school mentality is what passes for wisdom in Washington.

In the course of our lives, how many times do we come to a carefully calculated answer only to step back and say “Well, that can’t be. Something’s wrong.” It seems that there are few in Washington who doubt themselves. The polarization in Washington means that everyone in any position of responsibility has many critics on the other side of an issue. Each one then surrounds themselves with others who support their position, their values, their calculations. There is no stepping back and saying, “Wait, is that right?” The revolving door in Washington ensures that many politicians have little to lose even if they lose their seats. Many soon find an even more lucrative position in the private lobbying industry. What they do lose is the ability to wake up in the morning, look in the mirror and say, “I’m important.” Lose a bit of arrogance, gain a bit of humility. Not such a bad tradeoff.
The investor who puts his own money at risk, who has skin in the game, as the economist Nassim Taleb calls it, can not afford to NOT step back and take a second look at their investment strategies and allocations. As we complete another lap, this is a good time to recheck and rebalance. The 25+% gains in the stock market have probably skewed the allocations of many an individual’s portfolio. Here’s hoping everyone has a good year!
