April 6th, 2014
Capital Goods
Factory orders, including aircraft, rose in February but general investment spending on capital goods declined. The leveling off of non-defense capital spending in the past year indicates a lack of certainty among many businesses to commit funds for future growth.

A more panoramic view of the past two decades shows a peaking phenomenon at about $68 billion, one which this recovery has not been able to rise above.

Remember that these peaks are in current dollars and do not take inflation into account. When adjusted for inflation, the trend is not reassuring. A significant component of capital goods orders comes from the manufacturing sector – manufacturers ordering capital goods from other manufacturers – whose declining share of the economy puts a damper on growth in this area.

**********************************************
Employment
Modestly strong job gains of almost 200,000 in March sparked hope that the winter doldrums are over. The private payroll processor ADP reported 191,000 private job gains in March, in line with expectations and revised their February job gains from 139,000 to 178,000. The headline this month was that private sector employment FINALLY surpassed the level in late 2008.

Net gains or losses in government employment have been negligible in the past several months. State and local governments have been hiring enough to offset the small monthly declines in federal employees. Total non-farm employment is still below 2007 levels but so-o-o-o-o close.

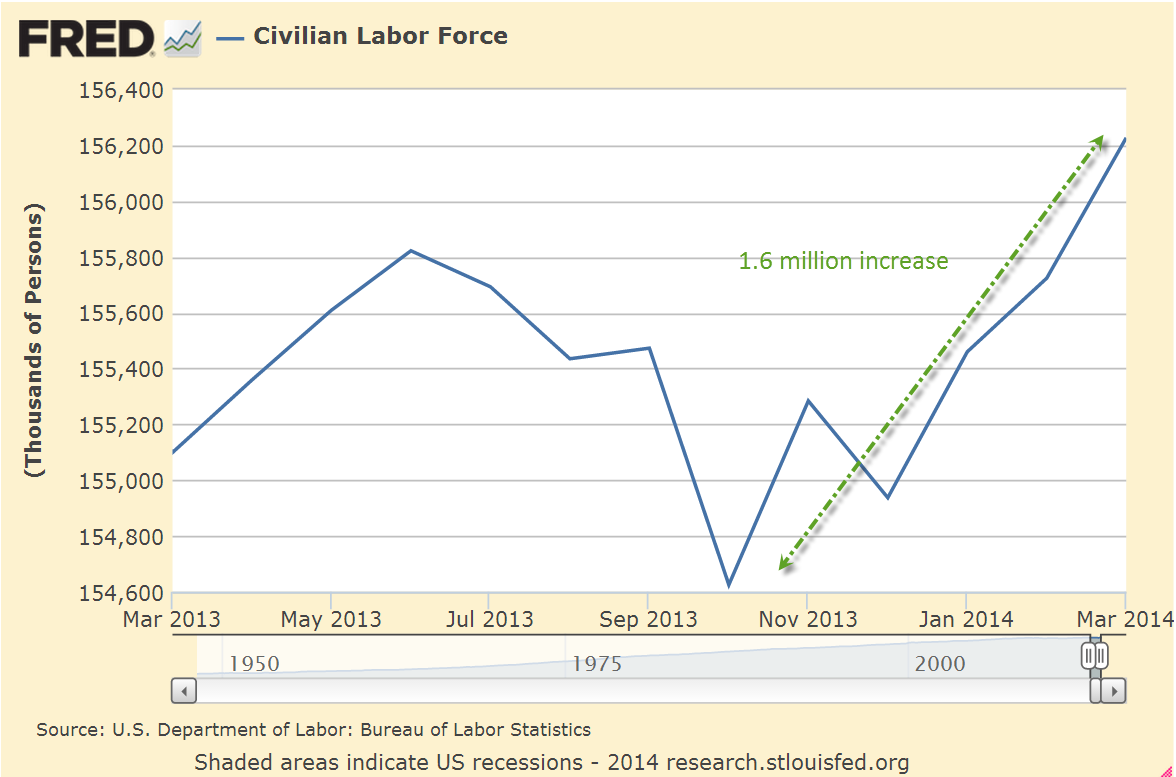
While the unemployment rate stayed unchanged, many more unemployed started looking for work. A reader writes “I read that the labor force has increased by 1.5 million from Jan-Mar, but that doesn’t jive with the number of people hired over that time. Am I missing something here?”
The labor force includes both the employed and the unemployed. Unemployed people, including those who retire, who have not looked for work in the past four weeks are not considered active participants in the labor force. Whether a person was 50 or 80, if they started looking for work, they would then be counted in the unemployed and in the labor force.
The Bureau of Labor Statistics (BLS) states that:
The basic concepts involved in identifying the employed and unemployed are quite simple:
People with jobs are employed.
People who are jobless, looking for jobs, and available for work are unemployed.
People who are neither employed nor unemployed are not in the labor force.
This definition of the labor force uses the narrowest, or headline, measure of unemployment. Since the beginning of the year, the labor force has increased 1.3 million, 1.6 million since October.
When people get discouraged, they stop looking for work. Then a friend says “Hey, ABC company is hiring,” and people start their job hunt again. In the past quarter, a net 800,000 people have come back into the labor force, despite the record number of people retiring and leaving the work force.

As the economy improves, enrollment in for-profit and community college will continue to decline, accelerating from the 2% decline in 2012 – 2013 (NY Times article) As students start looking for work, they officially re-enter the labor force.
Retirees: According to PolitiFact 11,000 boomers per day become eligible for Social Security. Let’s say that only 8,000 per day drop out of the labor force, making a total of about 700,000+ who retired this past quarter. A job market that can continue to overcome the drag from retirement is a sign of strength.
The Civilian Labor Force Participation Rate is the percentage of (employed + unemployed) / (people who can legally work). So if the Civilian Labor Force were 150 million and there were 250 million people 16 years and over and not institutionalized, 150/250 = .6 or 60%. The participation rate is currently at 63%.
**********************************************
CWPI
In the March ISM survey of service sector purchasing managers, employment rebounded strongly from the contracting readings of February. New orders grew stronger; both of these components get more emphasis in the calculation of the CWPI.

Weighed down by the winter lull, the smoothed composite index of manufacturing and services growth has declined for six months in a row but this should be the bottoming out of this expansionary wave. Barring any April surprises, March’s strength in employment and new orders should lead to an uptick in the composite in the coming months.

***********************************
Investing
What are the chances an actively managed fund beat its benchmark? Not good. An analyst at Standard and Poors compared various indexes that her company produces vs the performance of actively managed funds. In the past five years, only 28% of large cap actively managed funds beat the benchmark SP500 index. Some mid cap and real estate funds did much worse; less than 20% beat their benchmarks. Consider also that actively managed funds carry higher annual fees and/or operating expenses because the fund has to pay for the brain power of active management.
