August 23, 2015
Some of you may have spent the summer vacation on a small island in the Pacific where there was no access to the news. So a quickie catch up. The new Mission Impossible movie Rogue Nation is edge of the seat great fun and its still on the big screen. And, yeh, almost two weeks ago the central bank of China devalued the Yuan a bit over 3%. Yes, that was a bit unusual. An unexpected 8% drop in July’s exports spooked economists in the Chinese government.
That brought some additional pressure on oil stocks but the larger market eked out a .7% gain at the close of the week on August 14th. But – cue up the going down the dark stairs into the basement music – the 50 day average of the Dow Jones crossed below the 200 day average during that week.
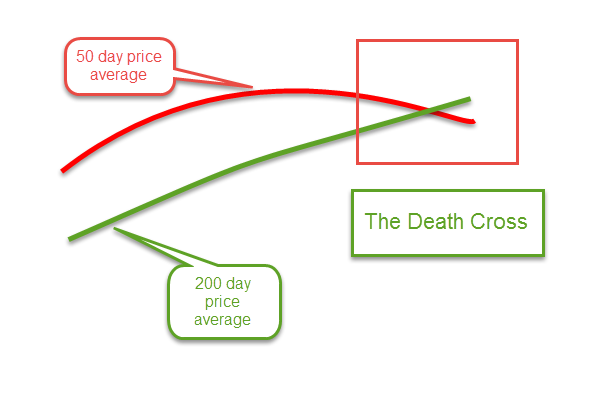
Yep, the death cross of doom. Of course, the Dow Jones is only 30 stocks, weighed down by the plunging fortunes of oil giants like Chevron and Exxon. The 50 day average of the broader SP500 index was still above the 200 day average so there was cause for concern, but not panic.
For the first two days of this past week, the market was essentially flat. USO, a commodity ETF that tracks West Texas Intermediate crude oil (WTI) rose more than 1% on Tuesday. Then came the news that crude oil inventories were continuing their relentless advance upwards. On the good side, lower oil prices are leading to higher demand but sometimes investors focus on the bad news. WTI oil dropped 4.4% on Wednesday. Whispers of disappointing manufacturing production out of China added fuel to the fire. On Thursday, the broader market fell 2%, joining the continuing downturn in energy stocks and emerging markets. A PMI (Purchasing Managers Index) survey of Chinese manufacturers confirmed a slight contraction in the Chinese economic machine. That spooked investors, leading to a 3% drop in the broader market on Friday.
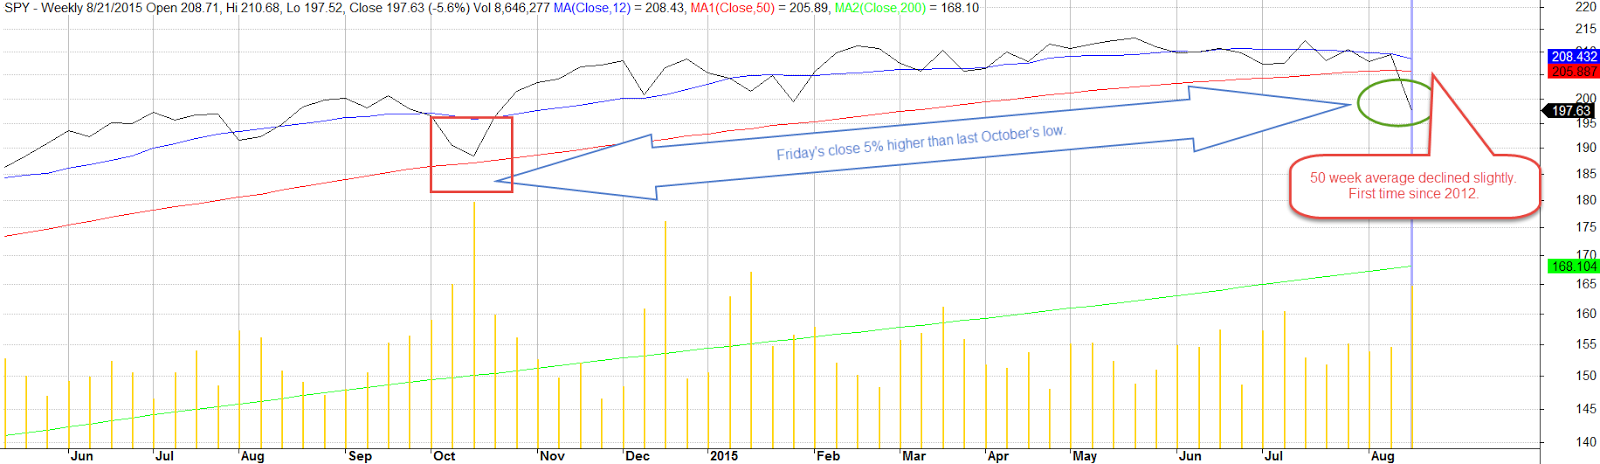
By the time the smoke cleared at the end of the week’s battle, the broader index had lost 5.6% for the week. Energy and emerging market indexes were down 8%. Weekly volume in the popular SP500 ETF SPY was the highest this year, an indication that this concern may be more than a temporary blip.
The 50 day average of the SP500 is still above the 200 day average. No feared death cross yet.

After four years without a 10% correction, the SP500 crossed below that mark this week, falling 10% from the recent high in late May. Time to sell? Did you get out of the market last October when the broader market fell more than 6% in a month? Remember that one? The market was going to fall by 50%, according to some market gurus. Friday’s close is 5% above that October low.
Some long term traders use a 50 week average as a guideline. As long as it is rising, why worry? Until this week, the 50 week average had been substantially rising since September 2009. Why do I use the word “substantially?” There were a few weeks in late 2011 and early 2012 when the average dipped a few cents. This week’s decline was like those little dips – a mere 5 cents in SPY, the popular ETF that tracks the SP500.
The world’s economy has come to depend on the growth of two stalwarts – the U.S. and China. For the past eight years, the Eurozone has fumbled and floundered through a cobweb of of political and economic problems. When the U.S. economy cratered in 2008 – 2009, the economic burden shifted to China, whose expansionist growth truly saved the world from a Great Depression. Although the U.S. economy is showing strong growth, can it offset the economic weakness in China? The stock market is holding an election, a vote of confidence on that very question.
