April 23, 2017
Human beings have an ability to foretell the future, or at least some people think so. A more accurate description is that we predict the likelihood of future events based on past patterns. Index funds average the predictions of buyers and sellers in a particular market.
During the recovery most active fund managers have underperformed their benchmark indexes. Standard & Poors, the creator and publisher of many indexes, provides a quick summary in their SPIVA spotlight. In the past five years, 88% of active fund managers have underperformed the SP500. In a random world, I would expect that 50% of active fund managers would beat the index, and 50% of managers would underperform the index because the index is an average of all those buy sell decisions.
The 1% higher fees charged by active fund managers contribute mightily to this underperformance. Using long term averages, we expect that a third of active fund managers would beat their benchmark index. The current percentage is only 12%. It is likely that the law of averages will eventually exert its pull.
Index funds mechanically rebalance regularly. Let’s look at a real life example. The pharmaceutical giant Johnson and Johnson is a member of both the SP500 and the smaller group of core stocks that make up the Dow Jones index. This week the company reported first quarter revenues that were below expectations, and sellers promptly knocked 3% off the stock price. Because most SP500 index funds are market weighted, index funds that mimic the weighting of the stocks in the index would buy and sell stocks in the index to capture these changes.
Because index funds are averaging the decisions of all stock investors, they should underperform. After all, the index funds are buying those companies that everyone else is buying, and selling companies that everyone else is selling. Index funds are buying high and selling low, creating a drag on performance that is overcome by the lower fees charged by these funds.
In an article last fall in the Kiplinger newsletter, Steven Goldberg makes the case for a mix of both index and active funds. Research shows that active fund mangers do better when an index does poorly. It’s worth a read.
The index fund giant Vanguard is featured in a NY times article. John Bogle founded Vanguard based on his thesis that a passive approach to investing and low fees would reward most investors over the long term.
///////////////////////
Correlation, not Causation
When the stock market crashed in 1929, the unemployment rate was less than 3%. A booming economy during the 1920s lifted demand for labor, while severe immigration restrictions enacted in 1924 reduced the supply of workers.
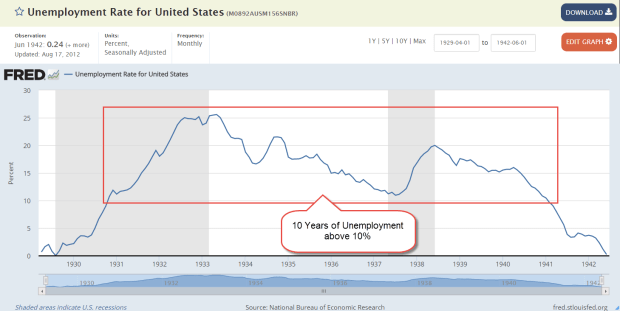
The unemployment rate was 6% when the market crashed in October 1987 and again in September 2008. There seems to be a weak connection between unemployment and severe market crashes. However, there is a consistent correlation between the change in number of unemployed and the start of recessions.
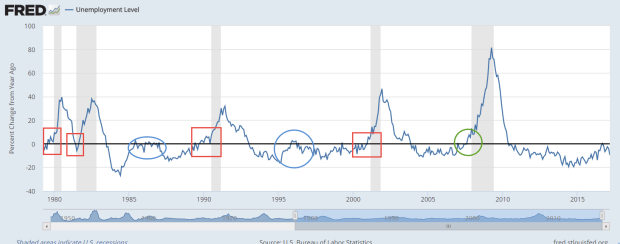
A yearly increase in the number of unemployed on a percentage basis indicates a fundamental weakness in the economy. Sometimes, the change reverses as it did in early 1996, at the start of the dot com boom, or in the mid-eighties after a downturn in oil and housing exposed a banking scandal. These two periods are circled in blue in the graph above.
Often the economy continues to weaken, more people lose their jobs, GDP falters and the economy slides into depression.
Because we cannot rely on just one indicator as a warning signal, we can chart the amount of production generated by each person in the labor force. The civilian labor force includes both those who are working and those who are actively looking for work. A growth rate below 1% indicates some weakness. Using both the change in unemployment and the change in production helps filter out some of the noise.
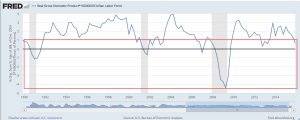
While production growth may be faltering, the current unemployment level is not worrying.
///////////////////////
Pay Attention to the Pros
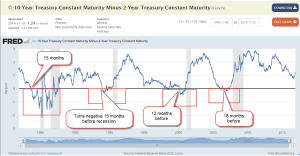
Institutional buyers and sellers of Treasury bonds will usually let the rest of us know when they are worried about a recession. In a middling to healthy economy, Treasury buyers will demand a higher interest rate for a longer dated bond. Subtracting the interest rate on a shorter term two year bond from a long term ten year bond should be positive. In a “normal” environment, a 10 year bond might have an interest rate of 3% and a two year bond an interest rate of 1%. The difference of 2% would be expected. However, a negative result indicates that buyers want more interest from short term bonds because they are more concerned about short term risks. As we can see in the chart below, a negative result precedes a recession by 12 to 18 months. The current difference shows no indication of concern.
Guessing the future is not divination, nor is it perfect. Retail investors may not have the time or expertise to estimate future risk, but we can study those who make it their business to manage risk.

>
LikeLike