December 9, 2018
by Steve Stofka
For the third time in six weeks, the SP500 fell below its 200-day moving average. This ten-month average of trading activity is a benchmark that indicates mid to long-term sentiment. It is a tug of war between the bulls and the bears, the buyers and sellers, over the developing trade war between the U.S. and China.
Technical market watchers call a crossing below the 200-day a Death Cross, a too dramatic name for something that may occur once or twice a year. Less frequently does it happen twice in a two-month period – a Double (Note #1). Rarely does it occur three times in such a short period of time – a Hat Trick (Note #2).
Hat Tricks signal strong investor worry about one or more structural conditions that will impact future earnings. The situation may resolve, and the market regain its upward trend. If the situation does not resolve, expect further price declines.
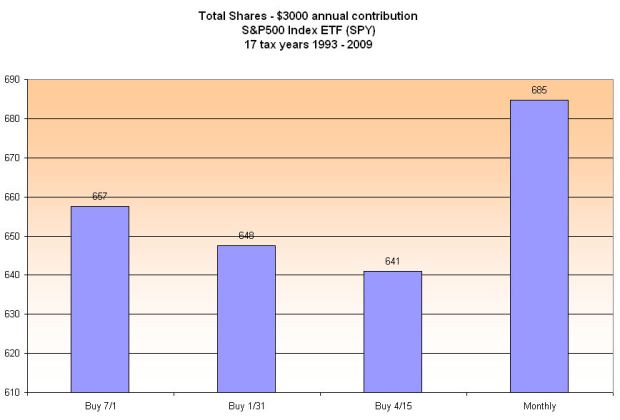
What does this mean for the casual investor? Contributions to an IRA at current prices will be priced as though you had dollar-cost averaged (DCA) each month of this year. As I showed in 2011 (Note #3), the DCA strategy has produced the highest long-term returns on the SP500. Look at the monthly bar on the chart below.
History is the only guide we have to investor behavior. Previous Doubles occurred in 2015 and 2012. Previous Hat Tricks developed in 2011 and 2010, producing strong price corrections (Note #4) in response to budget duels between Republicans and President Obama (2011), and debt crises in the Eurozone (2010).
In hindsight, the Hat Trick that occurred during four weeks in August 2007 signaled that this was more than a well-deserved correction in the housing market. Don’t we wish we had the clarity of a rearview mirror? Another Hat Trick a few months later in November and December 2007 coincided with the beginning of the recession that lasted 20 months and chopped 60% off the price of the SP500. Another Hat Trick in May and June 2008 came just months before the onset of the Financial Crisis in September 2008.
A Hat Trick accompanied the peak of the housing market in 2006, and the peak of the dot-com market in 2000. It signaled the start and end of the 1990 recession.
Lesson: be cautious.
////////////////
Notes:
1. In technical analysis, this double bottom forms a ‘W’ and indicates a possible exhaustion of selling before a reversal to the upside.
2. Hat Trick is a name I made up for 3 dips below the 200-day in a two-month period.
3. I compared various IRA investing strategies in May 2011
4. Price declines in 2010 and 2011 barely escaped being classified as bear market corrections, defined as a closing price 20% below a previous closing high price.
