Pool and Flow

October 2, 2016

A few weeks ago, I introduced two concepts: stock and flow. I’ll develop that a bit to help the reader analyze their portfolio with a bit more clarity.  To avoid confusion between stocks, as a type of investment, and the concept of a stock as in a reservoir or pool of something, I’ll refer to the concept as a pool and stocks as a type of investment.

Leverage

Each month we might check our investment and bank statements to find that the value has gone up or down.  In any one day only a tiny portion of stocks and bonds trade, yet these transactions determine the value of all the unsold assets, including the ones on our statement.  As I mentioned a few weeks ago, the flow from a reservoir of water determines the value of all the water in the reservoir.  It is like the butterfly effect, the idea that the fluttering of a butterfly’s wings in Mexico can cause a typhoon in southeast Asia.  In financial terms, when a small event has a large influence it is called leverage. A flow, a transaction, is the  catalyst for a transfer of value from one asset to another.

Let’s look at an example.  We buy a 1000 shares of the XYZ biotech firm for $10 a share, for a total investment of $10,000.  The next day the FDA announces that, contrary to expectations, they will allow a drug trial to proceed to Phase 3.  XYZ’s stock price rises 10% in response to the news.  The market price of our investment is now worth $11,000.  Where did the other $1000 come from?

Transfer of Value 

An asset value rose, so the value of another asset pool fell as the value is transferred from one asset to pool to another. Yesterday $10,000 of cash was worth 1000 shares of XYZ.  Today, that $10,000 of cash is worth only 909 shares of XYZ.  This is a different way of looking at cash – not as a liquid medium with  a stable value – but as an asset with an erratic value.

Cash = Investment 

What is cash?  It is an investment of faith in the United States.  We might give it a stock symbol like CASH and I’ll use that stock symbol to distinguish cash when it acts as an asset.  Stockcharts.com allows users to track the relationship between two stocks, or to price one stock in terms of another. We do by typing in the a stock symbol ‘A’ followed by a colon and a second stock symbol ‘B’.  Stockcharts will then show us the value of A priced in B units.  Below is the chart of Google (GOOG) priced in Apple (AAPL) units, or GOOG:AAPL.

On the left side of the chart in early 2014, Google’s stock was worth about 6.25 “Apples.”  By mid-2015, Google’s stock had fallen to 4.25 Apples.  Did Google’s value fall or Apple’s value rise?  Let’s imagine that we live in a world without money, as though we had taken the red pill as in the movie “The Matrix.”  Without a fairly constant measure like cash, we simply don’t know the answer to that question.  Imagine that each investor gets to choose which asset they want their monthly statement priced in and that our choice is Apple.  Over a year and a half, we see that we have lost about a third of the value of our portfolio of Google (6.25 / 4.25 = about 2/3).  We can’t stand the continuing losses anymore and sell our Google stock and get 4.25 units of Apple. It is now September 2016 and we still have 4.25 units of Apple because Apple is our measure of value.  Had we continued to hold the Google stock, we would have 7.29 Apple units.

What is CASH worth?

Now let’s turn to a slightly different example.  We are going to price CASH in Apple units, the inverse or reciprocal of how we normally do things.  When we say that Apple’s stock is $100, for example, we are pricing Apple stock in CASH units, or AAPL:CASH.  Instead we are going to look at the inverse of that relationship: pricing CASH in Apple units.  Remember, we are no longer in the matrix.

We begin with the same portfolio, 6.25 Apple units in early 2014.  We think that this CASH asset is going to do better than Apple, so we sell our Apple units for CASH and get 68 cash units for each Apple unit, a total of 425 cash units.  In mid-2015, we find that our CASH units are now worth only 3.5 Apple units.  We have lost about 45% in a year and a half!  We sell our CASH units and get 3.5 Apple units which is what we still have in this latest statement 15 months later.

Our losses are even worse than that.  Each year, Apple gives the owners of its shares another 2/100ths of a share as a dividend.  The owners of CASH get only 1/100th of a cash share each year.  Apple pays those dividends from its profits.  For owners of CASH, a financial institution pays the dividends from its profits. While the Federal Reserve, a creation of the Federal Government, doesn’t directly “set” interest rates it effectively does so through the purchase of bank securities.  Each dollar bill is equivalent to a share in an entity called the United States and it is ultimately the U.S. government that largely determines the dividend rate that is paid on safe investments like savings accounts.

Stock dividends compete with cash dividends

To remain competitive with safe investments, Apple only has to pay a little more than the very low dividend rate that savings accounts are currently paying.  If interest rates were 5% instead of the current 1%, Apple would have to devote more of its profits to dividends to appeal to income oriented investors.  By keeping interest rates low, the Federal government effectively allows Apple to retain more of its profits.  Where does Apple keep that extra money?  Overseas and out of the reach of the IRS.  That’s only part of the irony.  If Apple had to pay more of its dividends to the share owners, the share owners would pay taxes on the income. So the U.S. government loses twice by keeping rates low (See footnote at end of blog).

So CASH is effectively owning the stock of an entity called the United States, which doesn’t make a profit.  In the long run, owning the stocks of companies that do make a profit generates much more return to the owner.  Let’s look again at the leverage aspect of stocks and cash.  Earlier I noted the huge leverage involved in stock and other non-CASH asset transactions.  A tiny number of transactions affects the value of a large pool of assets.  On the other hand, millions of CASH transactions take place each day and have little effect on the nominal value of CASH.  So we price highly leveraged assets – stocks, bonds, etc. – in terms of an unleveraged asset – cash.

The functions of cash  

Cash plays several roles. First, as a medium of exchange, it acts as a measuring stick of economic flow in a society. This first role has a symbol – $.  Secondly, as an asset pool, CASH acts as a holding pond, a reserve in the waiting, the first in the asset reservoir to be tapped. Lastly, it acts as an insurance on the principal of other assets, like stocks and bonds.  Let’s call that INS.

Insurance

As an insurance, let’s consider a portfolio of $900 in stocks, $100 INS.  A 10% fall in stocks is reduced to a 9% fall because of the INS position.  Let’s consider the exact same portfolio, except that the investor’s intention is that the $100 is a CASH investment, a reservoir of asset buying power.  The same 10% fall in stocks is now a trigger for additional purchases.  In the first case the $100 is an anxiety reduction fee; in the second, a prediction of a market correction.

An investor might blur the distinction between the functions. Retired people who want to preserve the nominal value of their savings may tend to keep the majority of their nest egg in cash without distinguishing the different functions.  Cash = safety and liquidity. Because cash is used as a yardstick, its nominal value is kept constant.  But what that cash can buy, its purchasing power, changes.  When they need some of that CASH ten years from now, the purchasing power of that asset may have fallen by 30% but the nominal value is the same as it was ten years earlier.

Cash Analysis

As noted before, companies must make a profit or go out of business. Not so the U.S. government. Over time, the rate of a company’s profit growth must exceed the inflation rate, so that stocks give the best investment return in the long run.  Investors would benefit by separating their cash position into its functions, $ and CASH and INS, to understand more clearly what their intentions and needs are for the coming year.  This can be as simple as a piece of paper that we review each year.

Analysis Example 

An example – Cash needs:
1) income for the next year including emergency fund – $50K – $ function.
2) stock market seems awfully high and it has been a while since there has been a 10% correction – $100K CASH function.
3) $30K INS function to help me sleep at night in case there is more than a 10% correction.
Total: $180K.

Why write it down?  Believe it or not, we forget things.

////////////////////////

As a footnote:

Offsetting the tax losses to the government is the fact that some of Apple’s cash consists of cash-like equivalents like Treasury bonds which pay a very low dividend.  Apple loses income because of the low dividend and the U.S. government gains by being able to borrow money from Apple at low rates.

The Long Road

September 25, 2016

Almost daily I read about the coming implosion in the stock market.  There are only two price predictions: up and down.  One of them will be right.  So far, no catastrophe, so why worry?  Should an innocent investor just Ease On Down the Road? (Video from the 1978 movie).

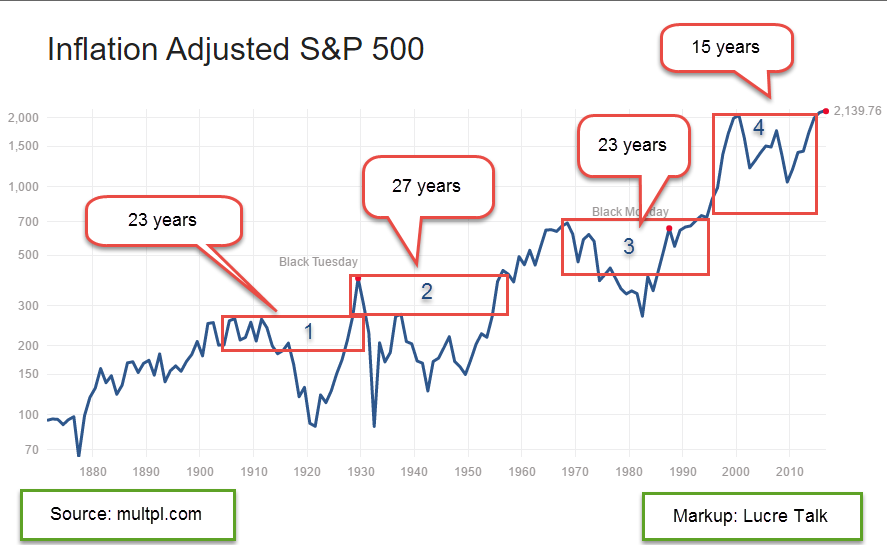
Unfortunately, the stock market road looks like Rt. 120 south of Mono Lake in California. The road is like a ribbon, marked by highs that are many years apart, more years than the majority of us will live in retirement.  In the graph from below from multpl.com I have marked up the decades-long periods before the inflation adjusted SP500 surpassed a previous high.  It is truly humbling.

It took 23 years for the market to finally surpass the high set in 1906.  Happy days!  Well, not quite.  Several months later came the stock market crash of 1929.  In 1932, the market fell near the 1920 lows.  In 1956, 27 years after the ’29 crash, the market finally notched a new high. In more recent decades, the market spent 23 years in a trough from 1969 to 1992.  Lastly, we have this most recent period from the high set in 2000 to a new high set in 2015.

IF – yes, the big IF – a person could call the high in a market, that would sure be nice, as Andy Griffith might say. (Youngsters can Google this.)  Of course, Andy would be suspicious of any city slicker who claimed to have such a crystal ball.  Knowing the high mark in advance is magic.  Knowing a previous high is not magic.

Looking at the chart we can see that the price in each period falls below the high of the period before it.  In the period marked “1” in the graph, the price fell below the high set in 1892. In period marked “2”, the price fell below the high set in 1906.  In the period marked “3”, the price fell below the high set in 1929.  In this last period marked “4” the price – well, it never fell below the high set in 1969.  The run up in the 1990s was so extreme that the market still has not truly corrected, according to some. Even the low set in 2008 didn’t come close to falling below the highs of that 1969-1992 period.  An investor who used a price rule that had been good for more than a hundred years found that the rule did not apply this time.

In 2008-2009, why didn’t prices fall below the high of the 1969-1992 period? They would have had to fall below 500 and in March 2009, there were a number of market predictors calling for just that. On March 9th, the SP500 index closed at 676, after touching a low of 666 that day.  The biblical significance was not lost on some. Announcements from major banks that they had actually been profitable in January and February caused a sharp rebound in investor confidence.  The newly installed Obama administration had promised some economic stimulus and the Federal Reserve added their own reassurances of monetary stimulus.

Did these fiscal and monetary relief measures prevent the market from fully purging itself?  Maybe.  Are stock prices wildly inflated because the Federal Reserve has kept interest rates so low for so long.  Could be.  How low are interest rates?  In 2013 the CBO predicted interest rates of 3-4% by this time.  They are still less than 1/2%.

How much are stock prices inflated?  Robert Shiller, the author of “Irrational Exuberance,” devised a price earnings ratio that removes most of the natural swings in earnings and the business cycle. Called the Cyclically Adjusted Price Earnings ratio, or CAPE, it divides the current price of the SP500 index by a ten year period of inflation adjusted earnings.  The current CAPE ratio is just below the high ratio set in 2007 by a market riding a housing boom.  The only times when the CAPE ratio has been higher are the periods during the housing bubble (2008), the dot-com boom (2000), and the go-go 1920s when many adults could buy stocks on credit.  Each of these booms was marked by a price bust that lasted at least a decade.

Price rules require some kind of foresight, and crystal balls are a bit cloudy.  There is a strong argument to be made for allocation, a balance of investments that generally are non-correlated, i.e. one investment goes up in price when another goes down.  An investor does not have to frequently monitor prices as with price rules. A once or twice a year reallocation is usually sufficient.

In an allocation strategy, equities and bonds are the most common investments because they generally counterbalance each other. A portfolio with 60% stocks and 40% bonds, or 60/40, is a common allocation. (Some people write the bond allocation first, as in 40/60.)   Shiller has recommended that an investor shift their allocation balance toward bonds when the CAPE ratio gets this high. For example, an investor would move toward a 60% bond, 40% stock allocation.

To see the effects of a balanced allocation, let’s look at a particularly ugly period in the market, the period from 2000 through 2011.  The stock market went through two downturns.  From 2000-2003, the SP500 lost 43% (using monthly prices). The decline from October 2007 to March 2009 was a nasty 53%.  In  2011 alone, a budget battle between the Obama White House and a Republican Congress prompted a sharp 20% fall in prices. During those 12 years, the SP500 index lost about 10%, excluding dividends.

During that period, a broad bond index mutual fund (VBMFX) more than doubled. Equities down, bonds up.  A rather routine portfolio composed of 60% stocks and 40% bonds had a total return of 3.75% per year.  Considering the stock market losses during that period, that return sounds pretty good. Inflation averaged 2.6% so that balanced portfolio had a real gain of about 1.2%.  Better than negative, we reason.  On the other hand, a portfolio weighted at 40% stocks, 60% bonds had a total annual return of 4.75%, making the case for Shiller’s strategy of shifting allocations.

There is also the nervousness of a portfolio, i.e. how much an investor gets nervous depending on one’s age and the various components of a portfolio.  During the 2000-2003 downturn in which the SP500 lost 43%, an investor with a 60/40 allocation had just 14% less than what they started with in the beginning of 2000. Not bad. 2008 was not pleasant but they still had 11% more than what they started with.  That is a convincing case for a balanced portfolio, then, even in particularly tumultuous times.

Can an investor possibly do any better by reacting to certain price triggers?  We already discussed one price rule that was fairly reliable for a hundred years till it wasn’t. The problem with rules are the exceptions and it only takes one exception to bruise an average 20 year retirement cycle.  Another price rule is a medium term one, the 50 day and 200 day averages.  These are called the Golden Cross and Death Cross.  Rules involve compromises and this rule is no exception.  In some cases, an investor may sell just when the selling pressure has mostly been exhausted.  Such a case was July 2010 when the 50 day average of the SP500 crossed below the 200 average, a Death Cross, and triggered a sell signal.  The market reversed over the following months and when the 50 day average crossed back above the 200 day average, a Golden Cross, an investor bought back in at a price 10% higher than they had sold!

The same scenario happened again in August 2011 – January 2012, buying back into the market in January 2012 at a price 10% higher than the price they sold at in August 2011.  These short term price swings are called whipsaws and they are the bane of strict price rules. In the past year there were two such whipsaws, one of them causing a 5% loss.  Clearly, this traditional trading rule needs a toss into the garbage can!  What works for a few decades may fail in a later decade.

For those investors who want a more active approach to managing a portion of their portfolio, what is needed is a flexible price rule that has been fairly reliable over six decades.  As a bull market tires, the monthly price of a broad market index like the SP500 begins to ride just above the two year average.  The monthly close will dip below that benchmark average for a month as the bull nears exhaustion.  If it continues to decline, that is a good indication that the market has run its course.  The price rule is an attention trigger that may not necessarily prompt action.

Let’s look at a few examples.  President Kennedy’s advisors were certainly aware of this pattern when the market fell below the two year mark in 1962.  They began pushing for tax cuts, particularly for those at the highest levels.  Rumors of a tax cut proposal helped lift the market back above the benchmark by the end of 1962   In early 1963, JFK made a formal proposal to lower personal rates by a third and corporate rates by 10% (At that time, corporations paid a 52% rate). An investor who sold after a two month decline suffered the same whipsaw effect, buying back into the market at about 10% higher than they sold.  However, at that selling point in 1962, rumors of tax cuts were helping the market rebound and might have caused an investor to wait another week before selling. The market had  in fact reached its low.

In mid-1966, the SP500 fell below its 24 month benchmark for seven months.  Escalating defense spending for the Vietnam War helped arrest that decline.

The bull market finally tired in the summer of 1969 and dropped below the 24 month benchmark in July.  The index treaded water just below the benchmark for a few months before starting a serious decline of 25%.  More than a year passed before the monthly price closed above the benchmark in late 1970.

The 1973 Israeli-Arab war and the consequent oil embargo threw the SP500 into a tailspin.  The price dipped below the average a few times starting in May 1973 before crossing firmly below in November 1973.  After falling almost 40%, the price finally crossed back above the benchmark in late 1974.  Remember that this was a particularly difficult fourteen year period marked by war, high unemployment and inflation, and a whopping four recessions.  The SP500 crossed below its ten year – not month, but year – average in 1970, again in 1974-75, and lastly in 1978.  Such crossings happen infrequently in a century and are great buying opportunities when they do happen.  To have it happen three periods in one decade is historic.

I’ll skip some minor events in the late 1970s and early 1980s.  In most episodes an investor can take advantage of these opportunities to step aside as the market swoons, then buy back in at a price that is 5-10% lower when the market recovers.

The most recent episodes were in November 2000 when the SP500 fell below its benchmark at about 1300. When it crossed  back over the benchmark in August 2003, the index was at 1000, a nice bargain.  This was another crossing below the ten year average.  The last one was in 2008 when the monthly price fell below the benchmark in January.  Although it skirted just under the average it didn’t cross back above the 24 month average.  In June it began a decline that steepened in September as the financial crisis exploded. Again the index fell below its ten year average. By the time the price closed back above the benchmark in November 2009, an investor could buy in at a 20% discount from the June 2008 price.

In September 2015 and again in February of this year, the index dropped briefly below its 24 month average. They were short drops but it doesn’t take much of a price correction because the index is riding parallel with the benchmark, above it by only 100 points, or less than 5%.  Corporate profits have declined for five quarters.  The bull is panting but still standing.

As we have seen in past exhaustions, there is a lot of political pressure to do something.  What could refuel the bull market? Monetary policy seems exhausted.  The Federal Reserve has indicated that they will use negative interest rates if they have to but they are very reluctant to do so.  Just this past week, the Bank of Japan (BOJ) indicated that their policy of negative interest rates is not helping their economic growth.  The BOJ had started down a negative interest rate path and has now warned other central banks not to follow.

What about fiscal policy? The upcoming election could usher in some fiscal policy changes but that seems unlikely.  Donald Trump has joined with Democrats advocating for more infrastructure spending but that is unlikely to pass muster with a conservative House holding the purse strings and a federal public debt approaching $20 trillion.  Only sixteen years ago, it was less than $6 trillion.  Democrats keep reminding everyone that the Federal Government can borrow money at very cheap rates.  However, the level of debt matters and Republicans will likely control the money in this next Congress.

Managing an entire portfolio with a price rule is a bit aggressive but might be appropriate for some investors who want to take a more active approach with a portion of their portfolio.  This price rule – or let’s call it guidance – is more a pain avoidance tool than a timing tool.

The Fed Feints

September 18, 2016

This week I’ll cover several topics, most of them concerning personal finances.

Social Security and COLA

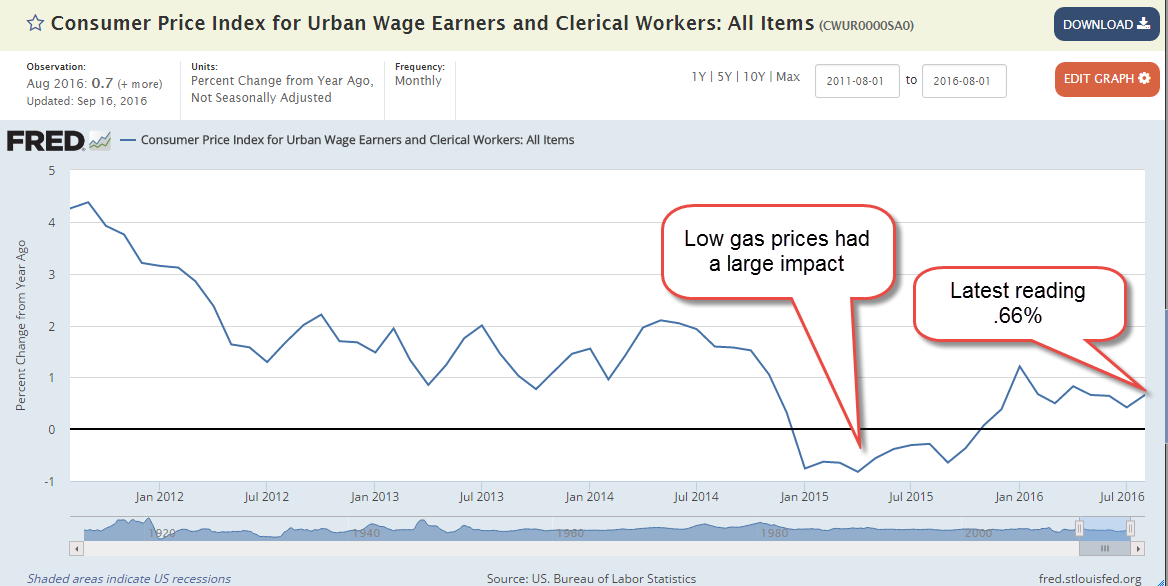
 Sometime in mid-October the Social Security Administration (SSA) will announce the cost-of-living adjustment (COLA) for social security benefits in 2017 and it will probably be less than 1% (History of previous COLA adjustments).  The COLA is based on the year-over-year increase in the Consumer Price Index (CPI).  In 1982, Congress specified that the SSA use the CPI version for urban workers, called CPI-W. (Info from SSA).  Each month the BLS releases their estimate of inflation, and this week they published their calculation for August – a yearly increase of just .66%.  September’s inflation number may be slightly different but the reality for the average SS recipient is a monthly increase of less than $10 in the average benefit of $1340.

Gas prices fall

For years senior advocacy groups like AARP have argued that a different CPI measure should be used to calculate the COLA.  The alternative measure, the CPI-E, puts more weight on health care expenses and less weight on gasoline and transportation costs because seniors don’t drive as much. So far, Congress has not adopted any changes to the methodology of calculating inflation for retirees.

In late 2014 gasoline prices began to fall and this had a significant impact on measured inflation in 2015, as we can see in the chart below. Although gas prices remain low, they have stabilized so that they will have less of an impact on yearly inflation growth in the future.

Reaching For Yield

Investors who are reliant on the income from their investments, including giant pension and endowment funds, typically desire fairly safe investments that will give them a decent return while preserving their principle.  These include high grade corporate bonds (Johnson and Johnson, for example), Treasury bonds, CDs and savings accounts. Abnormally low interest rates have made those traditional investment choices less desirable.

Like a stream diverted, investors have wandered to riskier assets, bidding up the prices of stocks which are considered more likely to retain their value because they pay dividends.

Dividend ETFs 

 As one example, Vanguard’s VIG is a Dividend Appeciation ETF containing of stocks that  have a consistent record of dividend growth of almost 5% per year.  The growth rate is 5%, not the dividend yield. The companies in this basket are household names: Johnson and Johnson, Microsoft, Pepsi, McDonald’s, and Walgreens, to name a few.  Vanguard has an added benefit: a very low expense ratio.  At the end of August, the Price-Earnings (P/E) ratio on this basket of stocks was 24.5 (see here). In the first two weeks of September, the prospect of an interest rate hike in the next few months has put a small dent in the price, and lowered the PE ratio slightly.  Clearly, investors are willing to pay extra for income, and extra for reliability.  The yield on this basket of reliability is 2.1%, just .4% more than a 10 year Treasury.

DVY

iShares’ DVY is a popular dividend ETF that has a less selective basket of stocks.  This basket also includes oil and energy companies that have a 5 year record of paying dividends but may not have a consistent record of dividend growth because of declining oil prices.  Because the criteria is less restrictive, this ETF is cheaper – it has a higher yield of 3.2% and a lower PE ratio of 20.8.

The Fed

After eight years of near zero interest rates, the Federal Reserve has put itself in a corner. Whatever actions or adjustments it takes must be in small increments to avoid causing a sudden repricing of the very asset prices it has helped lift by maintaining a low interest rate environment.

The financial crisis was so severe that the Fed thought it must lower rates to near zero, which choked income flows from savings.  Such a policy could be justified as an emergency measure. The economy had suffered the equivalent of a heart attack and the Fed need to shock it alive.  However, the recovery that followed was so weak that the Fed thought it must continue to keep rates low.  After eight years of ZIRP (Zero Interest Rate Policy), the Fed finds that it has effectively been picking winners and losers. Debtors win, savers lose. The Fed was forced into the role by the inability of a bitterly divided and ineffective Congress to pass fiscal policy solutions.

To fully grasp the effects of Fed policy, let’s take a trip up into the mountains.  Imagine a high mountain lake reservoir with a dam at one end to contain the water.  On the mountains surrounding the lake falls snow and rain that drains into the reservoir.  The dam is opened enough so that it releases a measured stream of water for users downstream.  The lake is a stock. The release of water is a flow.

Now let’s say that there is a drought for a year or two.  The water level in the reservoir begins to fall.  The dam operators reduce the amount of water released and this has a negative impact on downstream farms and businesses who depend on the water. The price for water rises as farms and businesses bid to get more water, a simple case of supply and demand. Land, another store of value, decreases in value because the lack of adequate water has made the land less productive. Assuming the same demand, prices for produce from the land rises.  This is the flow from the land, So the flow from the land rises while the stock value of the land falls.  Water is a different kind of asset, a consumable.  In the case of water, both the flow and the stock value rise during a drought.

Eventually the rainfall increases and the reservoir refills with water.  Now the dam operators release more water and the price per unit of water naturally declines. Now the stock value and the flow value of the water have declined. A greater supply of produce leads to price declines in the flow of produce from the land, while the price of the land itself, the store of land’s value, increases in anticipation of more productivity from the land.

After the crisis is over, flows from both types of assets declines.  The extra stock value of the water is transferred back to the land. The flow of water from the reservoir has been the catalyst for this transfer of value.

Let’s take this simplified situation and use it as an analogy to understand the Fed.  When the Fed adjusts interest rates, it transfers a store of value from one asset class to another. (It involves a number of asset classes.  I’ll keep it simple.) That’s the transfer of stock value.  But there is also a raising or lowering of the price of the flows from each of those assets.

Now let’s imagine that the Fed raises interest rates by 1%, effectively opening up the dam’s sluice gates a little more.  The flow of income shifts from debtors, who must pay more for borrowed money, to savers, who receive more for their savings.  Debt is a store of value and this is where the transfer of value happens.  New debt competes with old debt and lowers the price of existing debt, both corporate and government, so that old debt can generate the same income flows as new debt. Assets like bonds, which generate income flows at lower interest rates are now worth less.  Why buy a safe bond paying 2% when I can buy a safe bond paying 3%?  Dividend paying stocks are worth less unless they can realistically increase their dividend to compete with higher interest rate expectations. Buyers and sellers of these instruments adjust the prices to reflect the new expectations.

The change in flows acts as a catalyst for the transfer of the stock values between assets.  When we are younger and working, we don’t pay much attention to income flows from our savings.  We look at our portfolio statements, check our 401K or savings balances to see how much of a stock of assets we have built up.  We measure these assets in dollars, not value and may come to think that dollars and value are the same.  Income flows are measured in dollars.  The stock those flows come from are measured in value.  In the future, I hope to explore the ways that we try to convert value to dollars.

The Supply Chain Sags

September 11, 2016

Fifteen years ago almost three thousand people lost their lives when the twin towers crumpled from the kamikaze attack of two hijacked airplanes.  Over the fields of rural Pennsylvania that morning, the passengers of a another hijacked plane sacrificed their own lives to rush the hijackers and prevent an attack on Washington.  We honor them and the families who endured the loss of their loved ones.

/////////////////////////

Purchasing Managers Index

Each month a private company ISM surveys the purchasing managers at companies around the country to assess the supply chain of the economy. Are new orders growing or shrinking since last month?  Is the company hiring or firing?  Are inventories growing or shrinking?  How timely are the company’s suppliers?  Are prices rising or falling? ISM publishes their results each month as a  Purchasing Managers Index (PMI), and it is probably the most influential private survey.

ISM’s August survey was disappointing, especially the manufacturing data.  Two key components of the survey, new orders and employment, contracted in August. Both manufacturing and service industries indicated a slight contraction.

For readers unfamiliar with this survey, I’ll review some of the details The PMI is a type of index called a diffusion index. A value of 50 is like a zero line.  Values above 50 indicate expansion from the previous reading; below 50 shows contraction. ISM compiles an index for the two types of suppliers, goods and services, manufacturing and non-manufacturing.

The CWPI variation

Each month I construct an index I call the Constant Weighted Purchasing Index (CWPI) that blends the manufacturing and non-manufacturing surveys into a composite. The CWPI gives extra weight to two components, new orders and employment, based on a methodology presented in a 2003 paper by economist Rolando Pelaez.  Over the past two decades, this index has been less volatile than the PMI and a more reliable warning system of recession and recovery, signaling a few months earlier than the PMI.

Weakness in manufacturing is a concern but it is only about 15% of the overall economy.  In the calculation of the CWPI, however, manufacturing is given a 30% weight.  Manufacturing involves a supply chain that produces a ripple effect in so many service industries that benefit from healthy employment in manufacturing. Because there may be some seasonal or other type of volatility in the survey, I smooth the index with a three month moving average.  Sometimes there is a brief dip in both the manufacturing and non-manufacturing sides of the data. If the downturn continues, the smoothed data will confirm the contraction in the next month.  This is the key to the start of a recession – a continuing contraction.

History of the CWPI

The contraction in the survey results was slight but the effect is more pronounced in the CWPI calculation. One month’s data does not make a trend but does wave a flag of caution. Let’s take a look at some past data.  In 2006 there was a brief one month downturn. In January 2008, the smoothed and unsmoothed CWPI data showed a contraction in the supply chain, and more important continued to contract. The beginning of the recession was later set by the NBER at December 2007. ( Remember that these recession dates are determined long after the actual date when enough data has been gathered that the NBER feels confident in its determination.)  The PMI index did not indicate contraction on both sides of the economy until October 2008, seven months after the signal from the CWPI.  During that time, from January to October 2008, the SP500 index lost 30% of its value.

The CWPI unsmoothed index showed expansion in June 2009 and the smoothed index confirmed that the following month. The PMI did not show a consistent expansion till August 2009.  The NBER later called the end of the recession in June 2009.

The Current Trend

Despite the weak numbers, the smoothed CWPI continues to show expansion but we can see that there is a definite shift from the wave like pattern that has persisted since the recovery began.

With a longer view we can see that an up and down wave is more typical during recoveries.  A flattening or slow steady decline (red arrows) usually precedes an economic downturn.  The red arrows in the graph below occurred a year before a recession.  The left arrow is the first half of 2000, a year before the start of the 2001 recession.  The two arrows in the middle of the graph point to a flattening in 2006, followed by a near contraction.  A rise in the first part of 2007 faltered and fell before the recession started in December 2007.  The current flattening (right arrow) is about six months long.

New Orders and Employment

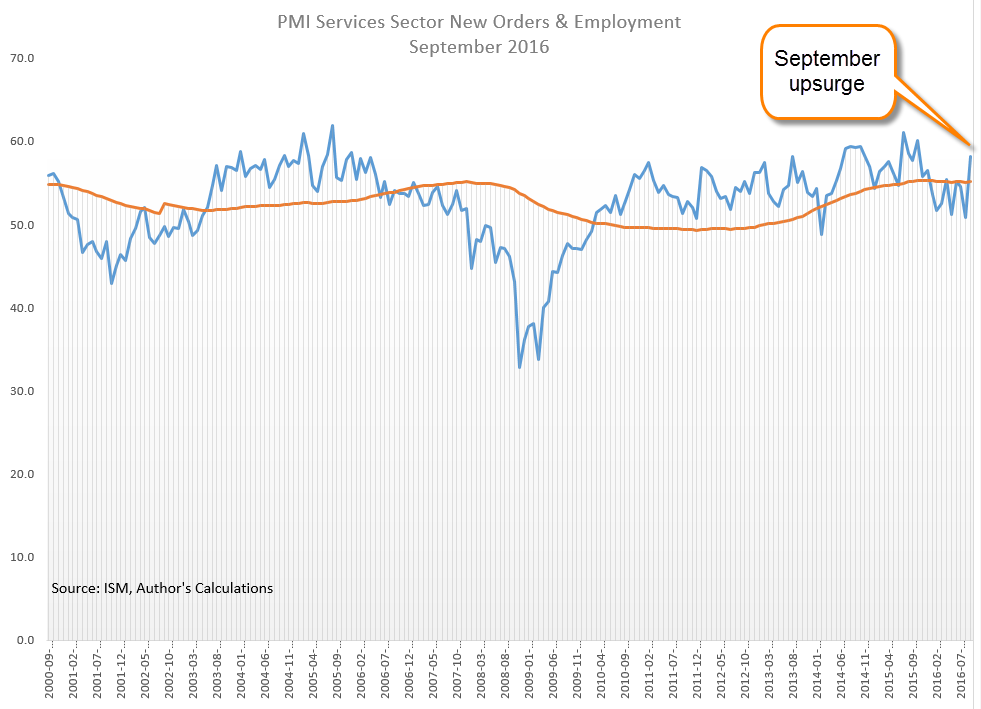
Focusing on service sector employment and new orders, we can see the weakness in this year’s data.

With a long view, a smoothed version of this-sub indicator signals weakness before a recession starts and doesn’t shut off till late after a recession’s end.  The smoothed version has been below the 5 year average for seven months in a row.  If history is any guide, a recession in the next year is pretty certain.

The 2007-2009 Recession

 In August 2006 this indicator began consistently signaling key weakness in the service sectors of the economy (big middle rectangle in the graph below). Stock market highs were reached in June 2007 and the recession did not officially begin till December 2007, a full sixteen months after the signal started.  That signal didn’t shut off till the spring of 2010, about eight months after the official end of the recession.

The 2001 Recession, Dot-Com Bust and Iraq War

The recession in 2001 lasted only six months but the downturn in the market lasted three years as equities repriced after the over-investment of the dot-com boom.  The smoothed version of this indicator first turned on in January 2001, two months before the start of the recession in March of that year.   Although, the recession officially ended in November 2001, the signal did not shut off till June 2003 (left rectangle in the graph above).  Note that the market (SP500) hit bottom in September 2002, then nosedived again in the winter.  Weak 4th quarter GDP growth that year fueled doubts about the recovery.  Concerns about the Iraq war added uncertainty to the mix and drove equity prices near that September 2002 bottom.  In April 2003, two months before the signal shut off, the market began an upward trajectory that would last over four years.

No one indicator can serve as a crystal ball into the future, but this is a reliable cautionary tool to add to an investor’s tool box.

//////////////////////////////

Stocks, Interest Rates and Employment

There are 24 branches of the Federal Reserve. This week, presidents of two of those banches indicated that they favored an interest rate hike when the Fed meets later this month (Investor’s Business Daily article).  On Friday, the stock market dropped more than 2% in response.  One of those presidents, Rosengren, is a voting member on the committee (FOMC) that sets interest rates.  I have been in favor of higher interest rates for quite some time so I agree with Rosengren that gradual rate increases are needed. However, Chairwoman Janet Yellen relies on the Labor Market Conditions Index (LMCI) to gauge the health of the labor market.

Despite an unemployment rate below 5%, this index of about 20 indicators has been lackluster or negative this year.  There are a record number of job openings but employees are not switching jobs as the rate they do in a healthy labor market.  This is the way that the majority of employees increase their earnings so why are employees not pursuing these opportunities?

The Federal Reserve has a twin mandate from Congress: “maximum employment, stable prices, and moderate long-term interest rates.” (Source) There is a good case to be made that there are too many weaknesses in the employment data, and that caution is the more prudent stance.  The FOMC meets again in early November, just six weeks after the upcoming September meeting. Although the Labor Report will not be released till three days after the FOMC meeting, the members will have preliminary access to the data, giving them two more months of employment data. Yellen can make a good case that a short six week pause is well worth the wait.

Stuck in the Mud

In 18 months, the SP500 is little changed.  A broad index of bonds (BND) is about the same price it was in January 2015.  The lack of price movement is a bit worrying.  There are several alternative investments which investors may include in their portfolio allocation.  Since January 2015, commodities (DBC)  have lost 15%, gold (GLD) has gained a meager 1%, emerging markets (VWO) are down 5%, and real estate (VNQ) is literally unchanged.  A bright note: international bonds (BNDX) have gained almost 6% in that time and pay about 1.5%.  1994 was the last time several non-correlated assets hit the pause button.  The following six years were good for both stocks and bonds.  What will happen this time?  Stay tuned.

Investment Declines

September 4, 2016

The market seems awfully quiet leading into September, a month that is the most consistently negative for the past century. LPLResearch notes that it has been about 35 years since the market was this quiet for this long.  It has been 30 trading days (at the end of August) since the SP500 had strayed more than 1% from its 10 day average.  A year ago in August 2015 the market spent 17 trading days in this quiet zone then fell 6% in 3 days. In September 2014, the market acted like a sailing ship in the horse latitudes before sinking 6% over the following ten days.  We wish the market went up after these long quiet periods, but the trend is usually down.

Investment

Let’s look at a disturbing long term trend – a decline in private investment in housing (residential), as well as factories, equipment and office buildings (non-residential).  What is private?  Non-government, i.e. companies and individuals in the private market.

First, let’s look at private investment as a whole before we look at the parts.  As a percent of GDP, we are near post-WW2 lows.

“Oh, that was the housing bubble and financial crisis,” we might say.  Everytime we think we’ve got it figured out, that is the beginning of the journey of learning, some Zen master probably said at some time.  Be humble, little tree frog, or wax on, wax off.  Something like that.

Only this year has the economy surpassed the 2008 level of inflation adjusted private investment.  To get a sense of the damage done by the financial and housing crisis, the chart below is a rolling 5 year sum of investment and covers most of the post-WW2 period.  Look at the historic dip – not a pause, not a flattening, but a genuine crater in investment growth.  Here we can see the over-investment during the tech bubble of the late nineties when the 5 year sum climbed at a 60 degree angle, followed by the 45 degree climb as the housing bubble climaxed. Even scarier is the possibility that we may still be above the growth trend of the 70s, 80s and early 90s – that there is still a bit of correction left.

Housing Investment

Seven years after the official end of the recession, ten years after the height of the housing bubble, investment in residential housing is still near all time lows.  As a percent of the economy (GDP) it has been rising but from a great depth.

Slow household formation after the financial crisis, i.e. Johnny and Mary staying home or moving back in with Mom and Dad, has contributed to the slow recovery in housing investment.  The millennial generation, bigger in numbers than the aging Boomers, doesn’t have the same preference for owning their own home.  Census Bureau data shows that the home ownership rate in the under-35 crowd has declined from 39% in 2010 to 34% in 2016.  While it may be more noticeable in the millennial aged cohort, the data shows a decline in all age groups, and across incomes (page 10).   Competition for a dwindling stock of apartment rentals has caused a sharp rise in median rental rates across the country.

Why a dwindling number of rental units?  As home ownership rose in the 2000s, the investments in new apartment building began to decline in 2007, then fell abruptly during the crisis.  Only in 2011 did it finally start to rise up from its trough.  The drop in investment was so huge that just posting a number doesn’t do it justice.  Millennials are now being squeezed by a lack of rental housing stock.  Sharply rising home values in popular areas like Denver make it more difficult for millennials to shift preferences to home ownership.

The business Side

Now let’s look at investments in office buildings, equipment and factories.  These can be somewhat cyclical but the long term trend is down.  Since China was admitted to the WTO in 2001, the highs in the cycle have been trending lower.  During the 2000s Americans were not saving enough to fund business investment growth and our economy increasingly relied on foreign investment dollars.  Today we are on the decline in that investment cycle and we can expect further declines.

Does low inflation hurt investment?

It makes sense that a stable environment of low inflation should encourage business investment.  Low interest rates should encourage lending to business, etc.  This is the conventional narrative that has guided policy making at the Federal Reserve.  Stop an economist on the street and ask them if low interest rates encourage business investment and they will probably say yes. Here’s a quote from an economics course “If the expected rate of return [on the new investment] is greater than the real interest rate, the investment makes sense.”

Makes sense but what if it is partially wrong? Is it possible that low interest rates could, in some cases, discourage investment?  This is the opposite of the conventional narrative but let’s walk this path for a bit.  We often think of interest rates as a dependent variable, a response to something indicating a demand for money.  What if it is also an independent variable, a cause affecting the demand for money? Yep, it’s one of those interdependent cyclic things that might make you want to meditate on the universality of love and being, but stay with me 🙂

Interest rates can be a heuristic for investors, a signal of the demand for money, a weather vane of the underlying strength of the economy as seen by the top economists in the country, the folks at the Federal Reserve.  Low rates could be seen as a cautionary warning to investors.  If the economy were really getting stronger, would interest rates remain low?  Of course not, an investor might reason.  They would rise in response to stronger demand for money.  But they are not rising so better to be cautious, the investor reasons.  The dog chases its tail.

Do low interest rates cause reckless borrowing?

Are low interest rates prompting companies to borrow excessively?  Well, yes and no.  Yes, they are borrowing more but the growth trajectory, the rate of growth, is about the same as it has been since 1990.  As we can see in the chart below, each recession is a pause in the growth of corporate debt.  After each recession, the level rises again on approximately the same slope.  The “pause” in this last recession lasted a whopping four years, during which corporate debt declined as much as $600 billion, or about 5.6%.

The problem is what they are borrowing it for.  Companies typically buy back their own shares at their hghest, not lowest value.  By lowering the number of shares outstanding, buybacks raise the earnings per share even if there is no real growth in earnings.  Instead of buying low, selling high, companies tend to buy high, sell low. FactSet gathers and crunches a lot of market data.  Their mid-year analysis of share buybacks shows that total dollars spent on buybacks is approaching the highs of 2007.  Investment in real growth, in productive plants, equipment and office buildings, has declined the past three quarters but share buybacks, the appearance of growth, have increased.

A simple example

How could low inflation hurt investment?  If predicted inflation is rather low, about 2%, sales growth will not get that extra kick from inflation. Let’s say that a company’s sales are $1000 and the owners have an extra $50 to invest.  They are considering a plan to invest $50 and borrow $50 from the bank to expand in the hopes of making more sales.

First they consider the return by not expanding.  They put their $50 in the bank and make 2% interest or $1.  At 2% inflation, $1000 sales grows to $1020.  Let’s say that the company has a 30% gross margin, which gives an extra $6 profit on the extra $20 in sales.  The combined extra return to the owners is $7, a $6 profit and $1 in interest income.

Then they consider a second scenario.  Let’s say that the interest rate on the borrowed money is 6%, or 4% above the inflation rate of 2%.  As in the first scenario, they assume that the savings rate, or opportunity cost, of the invested $50 is about 2%.  The owners can expect an extra $4 imputed and actual cost on that combined $100 of investment.  If inflation is averaging 2% per year, then they can expect sales of $1020 even if there is no real sales growth.  Again, they use a 30% gross margin to arrive at an extra profit to them of $6, the same as the first scenario. If the extra investment does not produce any real sales growth, then the owners will net an extra profit of about $2, much less than the scenario of no expansion.  To make the same extra profit as in the first scenario, the owners need to generate an extra $11 in profit.  Minus the $4 in costs, the extra profit will be $7, the same as the first scenario.  Note that the owners are now trying to break even with the extra profits of not expanding.  To do that they must have sales of about $1037, or almost 2% real sales growth in addition to the 2% inflation growth.

Now, let’s consider a higher inflation rate of 4%.  Let’s imagine that the cost to borrow money is 8%, or 4% higher than inflation, as before, so that the cost of borrowing the $50 for a year is $4. As before, we’ll assume that the savings rate, or opportunity cost, of the $50 from the owner’ pockets is the same as inflation, or 4%, so that the imputed cost of the owners’ investment is $2.  Borrowed and imputed cost of the extra $100 invested in the company is now $6. If there is no real sales growth, total sales will now be $1040, or $40 more.  A 30% margin gives a gross profit of $12, leaving the owners with about $6 extra profit on investment.

Note that a doubling of the inflation rate in this scenario has produced a tripling of extra profit even with no real sales growth. Still the extra profits are less than not expanding at all.  They must still have a real increase in sales, but it is very small.

So a stable higher inflation rate and interest rate encourages business investment.  The key word here is stable.  We could keep doing this calculation with higher and higher rates producing more net profits to the owners but….  As inflation gets higher, it becomes less stable, less predictable and this unpredictability actually hurts business investment.

The Federal Reserve has set a target inflation rate of 2%.  I think it is too low and the lackluster growth of the economy seems to bear that out. Since the 1970s, prominent economists (Taylor and Tobin, for example) have suggested alternative targets that the Federal Reserve could use to replace the “dual mandate” set by the Congress in 1977.

A prominent alternative is a growth target in nominal GDP, called NGDP,  There are several variations but the one most favored has been level targeting, the calculation of GDP targets over the following five years or so based on an agreed growth rate.  The Fed would then take action to offset deviations from those targets. Two prominent economists, Robert Hall and Greg Mankiw, wrote a paper in 1993 explaining these alternative targets and the policy tools that the Federal Reserve could employ to help reach those targets.  During the period called the “Great Moderation,” from 1985-2007 national income grew at a rate just a bit more than 5%.

Hall and Mankiw noted (pg. 5) that the consensus among macroeconomists at that time was in favor of a targeting of nominal national income because it was a transparent measure, a clear, simple target.  The authors commented (pg. 4): “A rule like ‘Keep employment stable in the short run but prevent inflation in the long run’ [the current rule, by the way] has proven to be hopelessly vague; a central bank can rationalize almost any policy position with that rule.”

So the idea of nominal income or production targeting is familiar to economists and policymakers for several decades but has never been adopted. We can only assume, as the Nobel winner James Buchanan posited, that there is a very good reason for that.  When an obscure policy remains in place, it does so for a reason.  Enough policymakers want the obscurity that the policy provides.  I’m reminded of a letter John Adams wrote to Jefferson lamenting some of the vague language used in the Constitution which both of them had helped to craft.  Adams noted that the vagueness was necessary to reach consensus at the Constitutional Convention.  Efforts to achieve more precision in language or attempts to add specific detail were sometimes met with hardened disagreement.  The “general Welfare” wording of the tax and spending clause, Section 8, was one example.  Some argued that the lack of precision would give future generations of lawmakers some flexibility in determining what, in fact, was the general welfare of the United States.

 Whatever the Fed is doing now is only partially working and a different approach might be in order.  The use of the Labor Market Conditions Index, a broad composite of over twenty employment indicators, in guiding monetary policy shows that the Fed is reaching for a broader set of guidelines.  As Hall and Mankiw indicated, nominal targeting might give the Fed that broad guide, one that is less influenced by the needs and whims of elected politiciams.

Investment decline and the stock market

Let me finish on a somber note.  The year over year growth rate in the SP500 and private investment have both gone negative this year, for the first time since the end of the recession in 2009. The SP500 data is copyrighted so here’s a link to that chart. Pay attention.

/////////////////////////////

Notes:
If you would like to read more on the relationship of investment to savings, check out this 2006 NBER paper.

///////////////////////////

Happy Labor Day and put a shrimp on the barbie as a toast to the summer passing!

Election Reflections

August 28, 2016

Let’s pay a visit to an earnest voter…

The Labor Day weekend was a week away and the election campaigns would swing into full gear following the holiday. He had a hard time deciding what to do with his vote in November.  His mom used to make it easy, voting the party ticket no matter what. He heard someone say that they would write in Reagan’s name this election. He told himself that he was more conscientious than that so he reviewed some of the issues.

Climate Change

He thought that climate change was at least partially caused by human activity, so he decided he should probably vote Democratic this election. Republicans were climate deniers, weren’t they?  Hell, some Republicans denied evolution.  Michele Bachmann had announced that she wasn’t running for re-election for her House seat. He thought that she should be put out to pasture where she could do the least harm.  He had read a climate scientist writing that it didn’t matter much anymore, that human activity had already flipped the switch.  Sure, we might be able to make a few small improvements, some amelioration of the damage, but it wasn’t worth arguing with others who preferred to think that climate change was as real as Santa Claus.  What was that song by Chris Rea?  The Road To Hell

White House Short-timers

Obama had a few months left in his second term.  Was he hoping that Iran didn’t do something crazy in the meantime?  Former White House Press Secretary Robert Gibbs said (Interview with David Axelrod) that the worst day in an election campaign is the best day working in the White House. Everyday some part of everything that happens in the world came into the White House so the stream of problems was constant.

September was coming up.  Did Obama say a little prayer that there would be no financial crisis like the one that beset former Prez Bush in September 2008?  Bush’s body language in those last few months of his second term screamed out that he wanted to be gone from the flood of problems coming across his desk.  Bush had turned out to be a big government Republican with dramatic big government solutions to the financial crisis.  He had flooded Iraq with lots of cash in 2003.  Then he had wanted $700 billion from Congress.  His Treasury Secretary, Hank Paulson, had famously handed the Congress a scrap of paper, the most concise emergency bailout plan ever devised.  Hank could have written it on a piece of toilet paper in the men’s room.  $700B!

Rock-em-sock-em big government robot fights for justice

Democrats had been proposing big government solutions to society’s problems for as long as he could remember.  Solutions that cost a lot of money and produced meager or mixed results.  Was it bad execution of a good solution or was it the wrong solution?   The Dems were good at blaming someone or something else when their programs didn’t work very well.  Human greed, Republicans, selfishness, and poverty were the usual suspects.

Republicans blamed most problems on government regulators, Democrats, high taxes, and a loss of Christian values.  Republicans believed that a progressive income tax, the taking of money from one person and giving it to another, was a violation of a person’s property rights.  He agreed with that so maybe he should vote Republican.  But then most Republicans wanted to take away a woman’s right to choose what happened inside of her own body.  That was also a violation of a woman’s property rights, a God given right to privacy. So which property rights should he hope to protect with his vote?  Neither party cared much for the Constitution, that was for sure.

Social mores

At heart he was a classic liberal, or what is now called a moderate Libertarian. Gay marriage, fine.  If transgender people wanted to use the sex of bathroom that they identified with, fine.  His granddaughter had said she didn’t care if some transgender boy wanted to use the bathroom. The stalls had doors.  Dems seemed more libertarian on social issues, but very autocratic on economic issues.  Why couldn’t the Dems or Republicans be libertarian on both social and economic issues?  Because then one of them would be the Libertarian Party, he thought ruefully.  The anti-government anarchists had taken over the Libertarian Party several decades earlier.  Maybe it was time for the moderates to take it back?

Taxes

He didn’t think that politicians in Washington should be using the tax code to correct what they perceived as inequities in society.  It was the Republicans in 2003 who had stopped the practice of penalizing married couples through the tax code.  A Democratic House and Senate had put that one into place in 1971 (1998 article) but it was Nixon, a Republican, who signed the legislation.  Democrats could justify any tax.

The Hammer of God

He didn’t think Bible thumping politicians should be telling us how to live our lives. He was with the Dems on this one.  No, God wasn’t dead.  He was kept alive by politicians who used Him as a rhetorical weapon against the other party. Running for his first term in Congress, Abraham Lincoln, a Whig, had endured accusations that he was not a religious man (Sandburg’s Lincoln bio).  The Whigs had morphed into the Republican Party during the 1850s and now it was the Republicans who used religion as a cudgel against Democrats.  (Obama warning in 2012 race)  Apparently, only Republicans knew God’s will and how to implement it here on earth.  How could he vote for a party that was so conceited and arrogant?

Obamacare

But he also thought that the Federal government had no constitutional right to be telling people that they had to buy health insurance.  Each party wanted to take away people’s rights and freedoms.  As a small employer for several decades, he had often wished that health insurance wasn’t tied to employment. Bigger companies could offer more favorable benefits to good employee prospects, and it was tough to compete with that. Despite his preference for private solutions to societal problems, he wished that there was a program like Medicare for all or no tax write offs for health care benefits.  One or the other.  A public option had been a part of Obama’s 2008 platform (Politifact) but he had not been a particularly strong leader on this one and had encountered resistance from the members of his own party.  The result was Obamacare, a rough draft legislative hodge-podge that was more typical of a preliminary committee product, not a final piece of law.  Democrats just sucked at crafting economic legislation yet, in an ironic twist, they tended to see most of society’s problems as economic ones.  Obama had got his health care legislation passed only to see it used against the Democratic Party in the important census election of 2010, when the Dems lost a large lead and control of the House. Bill Clinton had tried to pass a health care bill in 1993 and lost Democratic control of the Congress to the Republicans in the 1994 election.  The Dems had apparently not learned their lesson.

Security

He couldn’t decide who was going to best keep the country safe.  Republicans seemed to think that Mexicans threatened each American family somehow.  Not all Mexicans, he understood, just illegal Mexicans.  For years, hundreds of thousands of students and visitors had come to the U.S., then overstayed their visas and remained in the U.S. illegally.  According to Republicans, all those other illegals weren’t a problem. Just Mexicans.   The Donald would build a wall.  In 2006, a Republican Congress had approved funds for Homeland Security to build more fences along the southern border.  Neither Democrat or Republican Congresses had been able to move the fence building further along toward actual construction.  Having once solved the problem of building a skating rink in Central Park, the Donald thought that he – and only he – could get this fence thing going.  He wished the Donald good luck in herding 535 fat cats in Congress toward any one project.  As the top Fat Cat, maybe the Donald could make it work.

Crazy vs Experience

Nah, he thought, the Donald was too crazy and inexperienced. Most Presidents were either one or the other, but not both, except for Bill Clinton.  Clinton had been crazy enough to have sex with an intern in the Oval Office and inexperienced enough to propose a universal health care plan.  He had won the Presidency with the lowest popular vote in the country’s history yet Clinton had thought he had some clear mandate. Even strong Democratic control of both the House and Senate could not help him and within two years, Clinton certainly contributed to the loss of  both the House and Senate to the Republicans.

Split the vote

Several decades ago a co-worker had shared his personal voting system.  “Split your ticket in the hope that the government stays split,” the guy had said.  That way the politicians could do the least harm.  Maybe that’s what he would do this election.  His congressional vote didn’t matter.  Few Congressional districts were contested in the general election and his district had voted Democratic for more than forty years.  Republicans would likely keep the House anyway.  Democrats might just take the Senate so he should vote Democratic to make it more likely.  That would help split the Congress.  That still left his vote for President.

Supreme Court

Over and over again he had heard that this Presidential election was a vote for the direction of the Supreme Court for the next decade or more.  His secret hope was that the Court would remain at eight members. If there was no clear majority on the Court then there should be no precedence set in Constitutional law.

Libertarian?

Maybe he should vote for the Libertarian Candidate, Gary Johnson?  Johnson seemed neither inexperienced or crazy other than the fact that anyone who runs as a third party candidate in this country must be crazy.  If the Dems took the Senate, they could simply block any nominee to the court and keep the Court at 8 members.  He could tell himself that a Libertarian vote was a combined nod to both the Democrat and Republican parties.  It would not be first time that he had split his vote but it had been quite some time since it did it in the hopes of a split government.

Baseball

Having resolved all those election issues, he turned his attention to the World Series schedule.  If the series went to seven games, the last game would be played on November 4th, at the height of pre-election coverage and just a few days before the election. (Schedule) If the Cubs were in the World Series for the first time since 1945, the attention of many voters might easily be diverted to the historic match up.  Let’s say the Cubs won the series for the first time since 1908 and let’s imagine that the series went to seven games, with the final game played on Friday, the 4th. KC Royals’ fans had celebrated their 2015 series extra inning win over the Mets just two days after the final game.  He could imagine that millions of Chicago residents and former residents would be there to celebrate the event on Sunday perhaps and the festivities rolling into Monday.  Although Illinois was usually a solid vote for the Democratic Presidential contender, he imagined the possibility that thousands of Illinois voters, distracted by the post-Series events, didn’t vote in Tuesday’s election.  Like Florida in 2000, the results turned on the votes of a few in Illinois and Donald Trump won the Presidency because the Cubs won the series.  Nah, he thought, sounds too much like a bad movie script.

Next week: a troubling long term trend that will hurt many investors

Manufacturing Miracle Coming Soon

August 21, 2016

In the olden days, like the late ’90s and early ’00s, it was a good thing that America was ridding itself of heavy manufacturing industries. They were, like, so 20th Century, man.  We were entering a new century of computers, the internet and high tech manufacturing.  Compaq Computer, Sun Microsystems (Java), Microsoft, Oracle (databases), and Apple expanded in Massachusetts, Colorado, California and N. Carolina.  Bye, bye old smoke belching industries and hello new clean room high tech industries.  America was becoming a knowledge and service economy.  Let those third world countries like Mexico, China and Thailand make stuff and pollute their cities, and ship the finished products to our shores.

Wind the clock of history to the present day and we are having a markedly different discussion.  Donald Trump, the Republican candidate for President, vows to bring old time manufacturing back to the U.S.  Under pressure from the leftist wing of the Democratic Party, Hillary Clinton pledges to kill the Trans-Pacific-Partnership (TPP) trade agreeement in its present form. The theme of this election: jobs and security.

Remember the billionaire Ross Perot who ran for President in the 1992 and 1996 elections?  Ross and The Charts.  Sounds like a Motown group.   While Perot didn’t get any votes in the electoral college, 20% of voters pulled the lever for him and probably pulled most of those votes away from George H.W. Bush, the incumbent Republican President in the 1992 election.  Bill Clinton won that one with the lowest popular vote in history and may send Mr. Perot a Christmas card each year as a thank you.  Perot said that if NAFTA passed – and it did pass in 1993 – there would be a big sucking sound as jobs were vacuumed from the U.S. into Mexico. In the late 90s, not too many companies had moved to Mexico yet.  The high tech and internet booms were in full swing and the unemployment rate was less than 5%.

 No big suck until…

In 2001 China was admitted to the World Trade Organization (WTO).  Put into a big pot a lot of cheap labor, eager urban planners in China, and lax environmental regulations.  Stir vigorously.  A black hole forms that sucks jobs from America and other developed countries.

From 2000 to mid-2008, before the financial crisis, manufacturing industries lost four million jobs.  Almost 25% of the work force gone in just eight years.  The transition from manufacturing had been going on for several decades but at a much slower pace.  In the previous twenty-two years, from 1978 to 2000, the manufacturing work force fell by two million.  As more product manufactures moved to China and southeast Asia in the 2000s, the job loss rate was five times what it had been in those two decades.

Manufacturing is a stew of many ingredients called the supply chain.  The chain includes the companies that make parts and tools for big industry as well as the transport needed to get raw materials to these suppliers.  It includes the housing, schools, shops and hospitals for a large regional work force.  Donald is going to bring that huge infrastructure back.  All by himself.  Yay for Donald.

//////////////////////

Franklin D. Roosevelt and the Banking Panic of 1933

Two days after FDR took office in March 1933, he declared a national bank holiday, shutting the nation’s banks for a week.  For a month before FDR took office, depositors had been withdrawing their money from banks in a concerted panic.  The conventional narrative is that FDR’s quick action saved the banking system from a certain collapse.  But wait, there’s more.  Why were people in a panic?

In order to win the election in November 1932 against the incumbent Herbert Hoover, FDR used a familiar tactic – scare the voter.  In the midst of the Depression, this wasn’t difficult.  Britain had gone off the gold standard in 1931 and American confidence in their financial institutions and their very currency was sorely tested. FDR’s oratorical and theatrical skills helped convince many voters that only an FDR presidency could rescue the American family.

In those days, a new President did not take office until March of the year following a November election. Soon after FDR was elected, people began to fear that he would devalue the dollar once he took office. En masse, people wanted to trade in their dollars for gold or something that could be converted to gold. In the first months of 1933, states began to declare bank holidays to halt the wave of withdrawals but the panic caused many more banks to fail. (A detailed account of the bank panic)

When FDR took office, 35 states had declared bank holidays of various extent.  FDR made the bank holiday a national one that included the reserve banks.  In the ensuing week people grew more confident as they realized that FDR would not devalue the dollar and that the Federal Reserve would guarantee all deposits until a national insurance program could be enacted.  When the holiday was over, people began to return the hoarded money to the banks. To sum it up, FDR’s quick action helped alleviate the panic which was started in part by FDR’s election.  Here’s a more complete account from the FDIC    I wish history was more like the simple version found in our grade school history books.

The Erosion of Inflation

August 13, 2016

What is inflation?  Commonly regarded as the change in prices from one year to the next, we can also define it as the rate at which the value of money declines.  In classical monetary theory, inflation reflects government demand for private savings.  When savings can not meet the demand, immoderate governments create the money they need.  This influx of invented money leads to higher prices and inflation.

Higher inflation encourages borrowers, including governments, since they can pay back loans borrowed in Year 1 with money that is worth less in Year 2.  A person who borrows $100 for a year at 10% interest but with 10% inflation, pays back a total of $110.  But the $110 is only worth 90%, or $99, in purchasing power.  In effect, the lender has paid the borrower for loaning the borrower money.  In a case like this, no one wants to lend money at that interest rate. The lender must charge a higher interest rate, driving up the price of borrowed money in a self-reinforcing tailspin of inflation chasing interest rates chasing inflation.

Deflation, or negative inflation, discourages borrowing for the opposite reason; money borrowed in Year 1 is paid back with money that is worth more in Year 2.  That same $100 borrowed for a year at 10% interest and 10% de-flation is paid back with $110 that now has the purchasing power of $121.  In this example, the borrower effectively pays the lender 21% interest.

I marked up a graph of post-1850 inflation I found here to show several key points in the “hockey stick” of inflation.

The Federal Government borrowed and spent a great deal of money during the Civil War period 1860-65, driving up the rate of inflation.   With a  currency backed by gold and sometimes silver, it took several decades of intermittent deflationary periods to correct for the imbalance of the Civil War.

When the Federal Reserve was created in 1913, the value of a dollar was little changed since 1850.  The Bureau of Labor Statistics doesn’t compile data on inflation before 1913.  After a World War and a severe short recession, a dollar in 1920 was worth half of what it was in  1913 {BLS }

Several years of deflation after the stock market crash restored some of the value to the dollar until the Federal Government began borrowing large sums of money to fund Roosevelt’s New Deal.  Inflation accelerated under the heavy government borrowing for World War 2.

Even though Roosevelt had ended the ready convertibility of dollars to gold during the Depression, several countries wanted cooperation in setting an international monetary standard.  At the Bretton Woods Conference in 1944, a year before the end of World War 2, the price of gold was fixed at $35 per ounce, a dollar benchmark that effectively made the U.S. dollar the world’s reserve currency.
In 1971, the Nixon administration removed that fixed price and allowed the dollar to float in price against gold and other currencies.  Within two years, the rest of the developed world followed suit.  A glance at the chart shows that this is the bend in the hockey stick, the point where cumulative inflation marches relentlessly upwards.

As I noted at the start, some inflation encourages borrowing. The keyword is “some.”  High inflation introduces so much uncertainty into the economy that it becomes debilitating.  Workers can not negotiate wage increases fast enough to keep up with the speed of inflation,, so they reduce their real spending.  Lenders demand high interest rates when they lend money in order to compensate for the declining value of money.  The high rates discourage borrowing and crimp economic activity.

A reasonable and fairly predictable inflation rate allows debt burdened governments to pay back borrowed money with money that has less value. In half a lifetime, from the point in 1973 when most governments freed their currency from a gold standard, the U.S. dollar has lost 80% of its value.  For the first two decades of these past forty years, family income kept pace with that loss of value.  During the last two decades the value of a family’s labor has been transferred to governments whose elected officials devise programs to return some of that transferred value to the most disadvantaged families.

In real terms, personal incomes have more than tripled since 1973 {Graph} but most of those gains were in the twenty-five years ending in 2000 when real personal incomes grew by 135%, a 5% annual pace.  In the sixteen years since 2000, real incomes have risen only 35%, averaging slightly above 2% per year.  When the value of money declines, the only way to save value is to invest money in assets, and only those on the upper half of the income scale have been able to preserve the value of their money in assets.  The lower half on that income scale has struggled.

As the value of money has declined in the past forty years, money invested in assets have gained in value. The press goes goo-goo as the SP500 makes new highs but that is a nominal value.  The inflation adjusted value is barely above its value in 2000 (Table) but has tripled in real value since 1973.  Home prices have not done as well but have gained 50% since 1975 (Graph).  For many families, their house is the majority of their assets and the inflation adjusted Case Shiller home price index is still below the level of ten years ago.

Elections are a competition of ideas for solutions and this election is no different.  The chief theme has been the ever declining value of money and labor, the relentless struggle of those on the lower half of the income scale. Folks on the political left favor ever more government intervention and clamor for more social programs to reduce household expenses, including free college tuition,  childcare and medical care. On the income side, the left calls for a doubling of the minimum wage.  Higher taxes and more debt will pay for these solutions.

Folks on the right side of the political aisle are ruled by an ideology that opposes government solutions, believing that there always exist remedies from the private sector even if there are no proposals for a private solution.  However, even those on the right want more government spending, but of the military kind, where it can most benefit families and economies in rural communities.  Donald Trump is now calling for greater infrastructure spending but this is sure to anger the conservatives in his party.  Folks on the right claim that more spending will be paid for by lower taxes on upper income families and the magic of wishful thinking called optimistic economic assumptions and dynamic budget scoring

For more than four decades, the world has been engaged in an international game of currency manipulation to prevent the fair market pricing of each country’s currency. Nations newly industrializing disregarded or gave a knowing wink to international agreements on labor practices and environmental protections.  Now the populations of the developed countries are aging and their birth rates are falling, particularly those countries in western Europe.  Already high government debt levels are strained by a swell of retiring workers who want the pension benefits they have been promised.  Economic growth that is sluggish or non-existent can not meet the demands for services and benefits, prompting more government borrowing.

Promises in a Presidential campaign are like unicorns.  After the election, the candidate removes the horn and voters realize that what they got was a rather good looking but ordinary horse, not a magical unicorn.  Promises are nevertheless calling cards to a political vision, and the vision of both campaigns is a rally ’round the flag of the domestic economy and American families. Trump’s supporters are endorsing his call for tariffs on imported goods to punish those countries which subsidize their industries and make American products less competitive in price.  Hillary Clinton is now calling for penalties for company inversions, the practice of relocating the legal presence of a business overseas to lower a company’s tax liability.  To rally their troops each candidate promises to fight the international system that threatens the well being of many American families.  However, it is our own government that is part of that system, the war on the value of money, on the value of work.

Hillary’s America

August 7, 2016

Those of us who did not fall asleep in sixth grade civics class remember that the Democratic Party was the party of slavery in this country for almost two hundred years.  (To save some typing, I’ll use DP and RP for the Democratic and Republican parties.) Dinesh D’Souza, the maker of the political documentary “Hillary’s America: The Secret History of the Democratic Party” beats us over the head with that party association for about half the length of the film.

The film’s release was deliberately timed for July, coinciding with the conventions of both political parties.  The timing and the strong audience interest surely have the industry’s attention. In almost two weeks, the film had grossed over $5  million, admittedly weak compared to the usual movie offerings from Hollywood.  For a documentary, however, those are strong numbers.  I went to an early afternoon showing on a weekday, expecting a theater of mostly vacant seats.  Instead, I had difficulty finding a seat among a sea of gray haired retirees, the age demographic that votes in consistently high percentages each election.  The person manning the ticket booth later confirmed that the movie was the most popular daytime choice among the twelve movies it was showing.

The movie begins with the conviction and two year imprisonment of D’Souza, who contributed too much money to the campaign of a friend who was running for local office.  An innocent man persecuted by our legal system, we are told.  A sentence that was hardly commensurate with a technical violation of election law.  D’Souza had my sympathies until he attributed his plight to a vendetta by President Obama who evidently orchestrated this judicial persection of D’Souza in retribution for earlier documentaries that D’Souza had created.  What was next, I wondered?  The Illuminati?

Taking notes during the film, I did some fact checking afterwards.  Did D’Souza go to prison for two years?  Not according to this NY Times article.   By law, the judge could have given D’Souza two years but declined to do so.  The details of the trial are here. The reader will see that this was not an innocent mistake of  mistakenly writing one too many checks to a political campaign. The audience is led to believe that several scenes and conversations that occurred inside the jail were during D’Souza’s two year sentence.  They might have happened while he was in detention, not a pleasant experience, for sure, but not two years in prison.

D’Souza makes the claim that Obama rules over an urban plantation of blacks, other minorities and immigrants, following a template laid down by rural southern plantation owners and urban DP politicians.  Obama’s political background is rooted in the state of Illinois where Democratic mayors and a gang of political cronies have ruled Chicago through a system of voter impressment, physically forcing immigrants and blacks to the ballot box. D’Souza neglects to mention that the most corrupt mayor of Chicago was “Big Bill” Thompson, a Republican whose two terms during the Prohibition era set the template of power and corruption that marked successive administrations in the city. But this is not a Republican Party hatchet job, is it? More inconvenient facts, darn it.

D’Souza makes the case that FDR’s reign during the Depression era 1930s marks the beginning of the Democratic theft of America.  Whether it was a theft is a matter of opinion.  As Lincoln did, FDR used the crisis to help rewrite the relationship of the Federal government to the states and its citizens.

During some forty minutes, the movie documents the many horrors of slavery by Democratic landholders. The moral rot at the heart of the DP is evidenced by the election of a savage, ruthless man to the highest position in the land.  Andrew Jackson was a Democratic President who treated his slaves worse than farm animals and forced Indian tribes on a long death march from their ancestral lands.  The party of slavery and Jim Crow laws now tries to market itself as the champion of blacks and minorities.

As with other documentaries of political propoganda – yes, Michael Moore, I’m talking about you – there are careful omissions of fact and context as well as just plain old sloppy research.  Facts are sacrificed to the cause the film promotes.  D’Souza tells us that Abraham Lincoln started the Republican Party, a falsehood that is easily checked by anyone with a cell phone.  Why tell such balderdash? D’Souza wants to stress that the RP, which began as a friend to the blacks, is still a friend of the blacks and other minorities.

D’Souza notes that it was Republicans who took land from the defeated Democrats after the Civil War and gave it to the blacks who had worked those lands.  On the face of it, this is true.  Now for the rest of the story, as broadcaster Paul Harvey would say. In the Reconstruction period following the Civil War, Republican politicians took over state legislatures and did award white owned farms to the newly freed blacks.  Many blacks, illiterate and unschooled in the management of a farm, lost the newly awarded lands to tax forfeiture.  Republican legislators and their friends were at the courthouse when the lands were auctioned and became the new owners of the land for a paltry sum.  That unlovely coincidence of human greed surpasses all political affiliation.

Emphasizing the point that it is the Democrats who are the party of racism, D’Souza recounts Democratic President Woodrow Wilson’s sordid sentiments toward blacks, his endorsement of the KKK and the hosting of a White House screening of the D.W. Griffith film “Birth of a Nation.”  D’Souza includes several clips from the movie to cement the association between the Democratic Wilson and slavery.

D’Souza dramatizes a scene where Wilson repulses the efforts of Ida Wells, a black journalist and activist, who attempted to get the President’s help to stop lynchings in the Democratic South.  Left out is the fact that Wells had been unable to get cooperation in this cause from a Republican President, William McKinley (Source).  In 1918 and subsequent Congresses, there were repeated Republican efforts to pass anti-lynching legislation but they were blocked by Democratic Senators (See notes at end).

The RP is a friend of women as well as blacks, D’Souza tells us.  After all, a Republican Congress passed the women’s suffrage amendment.  What we are not told is that Republicans specifically excluded women from the draft language of the 14th Amendment.  As this historian notes, “History is messy.”  Inconvenient facts are tossed aside to present a consistent narrative with a simple, clear message.  Donkeys bad.  Elephants good.

Although Democratic President Lyndon Johnson signed the Civil Rights Act of 1964 into law, D’Souza reminds us that it was the Republicans who overcame a Senate filibuster of the Act by southern Democrats.  One more reminder in an election season that the RP has been a friend to blacks.  Republican efforts to make voting by blacks a bit more difficult is conveniently left out of the narrative.

D’Souza dismantles the notion of a party switch, the idea that southern racist Democrats switched parties and are now Republican.  To refute this theory popular in Democratic circles , D’Souza shows a graphic of the 1500 KKK leaders and Democratic politicians in the southern states in the 1960s.  After the passage of the Civil Rights Act, less than 1% switched parties.  The graphic is a visually powerful argument but there is little explanatory information with this graphic. What years are compared? Why include the KKK members?  How were the party affiliations of these members checked?  A comparison of election maps before and after the passage of the Civil Rights Act makes it clear that there was a party switch.

In the 1960 Presidential election, most of the southern states, including Johnson’s home state of Texas, voted Democratic. This election map shows the southern blue voting block.  The Civil Rights Act passed in July 1964, a few months before that year’s Presidential election.  Texas stayed with Johnson but five Southern states went Republican, as this election map shows. (You can also toggle the election year above the map.)

In the 1968 election, four of those five southern states voted for George Wallace, the former Democratic governor of Alabama who had refused to integrate public schools in the state. Running as an Independent and a champion of segregation and states’ rights, Wallace won about 10% of the electoral votes, a feat achieved by no third party candidate since. (Map)

Clearly now the southern states were in the hands of Republicans and segregationists. Or were they?  In the 1976 election, many southern states voted for Jimmy Carter, a fellow southerner and the Democratic governor of Georgia. (Map)

The appeal of political propoganda documentaries is that they simplify history by carefully filtering out the confusion of contradictory events and data.  We would all like to disregard the complexity of human behavior, the conflicting loyalties that confirm the chaotic in human affairs.  We want tidy circles, not ragged inkblot shapes.  What keeps historians busy in a lifetime of academic research and study can be easily brushed aside by the makers of message films.  Darn it, we’re still arguing over the causes of WWI  and that was a century ago!

Champions of slavery, tolerant of racist Jim Crow laws and lynchings in the southern states,  the DP has also supported eugenics laws.  D’Souza implies that this is part of a continuing effort to eradicate the black race.  No longer able to use black people as free slave labor, the DP seeks to rid the country of them through sterilization and abortion.

Margaret Sanger, the founder of what is now called Planned Parenthood, was also a champion of eugenics (see here),  as were many progressives.  In today’s political alignment, progressives are part of the DP, but they used to be part of the Republican Party when the eugenics movement first gained popular strength.  Led by President Theodore Roosevelt, the progressive movement was responsible for workplace and social reforms, and the creation of the first national parks.  Eugenics was an “enlightened” and scientific idea at the time, but horrifies us now. Hitler’s devotion to the concept impelled his commitment to the methodical destruction of the Jewish race, and the wholesale slaughter of Slavs and Communists who surrounded and threatened the noble German race.

Linking Sanger with another group devoted to the suppression and eventual eradicaton of the black race, D’Souza shows a picture of Sanger at a KKK rally as proof of her association with the racist group. The researchers at the debunking site Snopes showed that this was a doctored photo .  Sanger did speak before a NJ women’s chapter of the KKK as part of her effort to speak about birth control to as many groups as possible.  In her autobiography, Sanger wrote about the meeting and the strangeness of the experience so D’Souza uncovers no dark and hidden secrets.

Sanger wrote that she wanted Negro parents to have the ability to make the same family planning decisions that white parents did.  She envisioned a day when Negro parents had the same access to hospital services for their births that white parents did.  She wrote ” Some day … there will not be a single section of the country without adequate hospital facilities for all. But until that day is here, Negro mothers should be given all possible protection against needless sacrifice through childbearing.”  Doesn’t sound like someone who wants to eradicate the Negro race, does it?

D’Souza’s message is that abortion and sterilization are the twin weapons of the eugenics movement.  Although sterilization was discontinued after the 1970s, abortion remains a tool of the eugenics movement primarily aimed at black women and the gradual reduction of the black race in America.

As evidence of this, D’Souza notes that the majority of Planned Parenthood (PP) clinics are in black-majority neighborhoods.  Protecting Black Life, a pro-life advocacy group, has an interactive tool using 2010 census figures that verifies the correlation of clinics in black and Hispanic neighborhoods.  With a tendency to have lower incomes, these minority population may simply use PP’s services more frequently, prompting PP to position their clinics in these areas.  Secondly, lease rates are lower in these neighborhoods and are attractive to an organization with constant funding needs.  However, those are boring pedestrian explanations for the correlation of locations.  D’Souza’s more dramatic explanation is that the location of PP clinics is part of a DP master plan of genocide.  Republican presidential candidates Herman Cain (2012) and Ben Carson (2016) have made accusations similar to D’Souza’s (WP article)  Maybe D’Souza will write the next Jason Bourne film?

A conservative propoganda piece must include Saul Alinsky, the anti-Christ of liberal politics who wrote “Rules For Radicals.”  The 1971 book consisted of tactics that a community organizer might use to knit low income communities into a more powerful voice at the political bargaining table. Confrontation and conflict are themes common to many of the tactics.

Political propoganda consists of a series of “dog whistles” familiar to the target congregation.  Conservatives are quick to tar any Democratic politician with the epithet “Alinskyite” as in “Alinskyite ideas.”  The congregation barks with approval.

Obama was only ten years old when Alinsky died in 1972 but Obama was a community organizer who has quoted Alinsky.  The quotes are not direct but close enough that any true conservative can see that Obama is a commie radical like Alinsky.  In Chapter 2 of Rules for Radicals, Alinsky wrote about the world as it is and the world as it should be. When Obama uses the words “world”, “is” and “should” in the same sentence, he is quoting Alinsky and professing to be a Communist.  I totally get that.  Here is one example of this kind of dogmatic analysis.

In a 1963 speech, President Kennedy – yes, a Democrat – differentiated those who saw the world as it was and asked why, and those who dreamed of what the world could be and asked why not.  His brother, Robert Kennedy, used the phrase as well in several speeches.  In that same speech, JFK  attributed the original quote to Irish playwright George Bernard Shaw.  Using the logic of this conservative accusation, we can assume that anyone who has dreams about a better world is a disciple of Alinsky and yes, a radical Commie Utopian.

The movie’s title begins with Hillary’s America, so when is D’Souza going to show us Hillary’s secrets?  Why, just about now. Hillary Clinton actually wrote a student thesis on Alinsky.  As president of the student club, Hillary invited Alinsky to speak at Wellesley College. The audience does not have to be good at math to realize that Hillary Clinton = Communist.

As the student commencement speaker at her graduation from Wellesley in 1969, Hillary went off script to chide the guest speaker, Republican Senator Edward Brooks, an African American, about his remarks (Transcript of Hillary’s speech). D’Souza dramatizes it for his audience. White girl at Wellesley rebukes black senator, showing no respect for either his position or his race.  Senator sits quietly in chair on dais as Hillary says these disrespectful words.  Bad Hillary.

Here is a piece of Hillary’s remarks: “we feel that for too long our leaders have viewed politics as the art of the possible. And the challenge now is to practice politics as the art of making what appears to be impossible possible.”  Any conservative can see what she is saying.  We feed her words into the conservative de-confabulator and out pops the translation. She is talking about the world as it is and as it should or could be.  Alinskyite Communist thinking of a better world, for sure.

D’Souza left out the Senator’s remarks that prompted Hillary’s response. Senator Brooke adopted what was a mild authoritarian posture typical of the time.  Student protests against the Vietnam war, discrimination and entrenched power structures occurred almost weekly, it seemed.  He said: “Dissent and protest are essential ingredients in the democratic concoction. Without them an open society becomes a contradiction in terms, and representative government becomes as stagnant as despotism. Yet there is a narrow but distinct line between productive dissent and counter-productive disruption.” (Transcript of Brooke’s speech)

Brooke cautioned against protest for the sake of protest, sentiments that sound reasonable to most American ears today.  Other elements of the speech would be typical of today’s moderate Democrat or Republican, animals who may have been driven to extinction in the current era of polarized opinions.  Only a Republican very secure in his seat would dare to give such a speech today.  Brooke endorsed the growth of the many Federal government cabinets recently created to combat housing and job discrimination, poor education and poverty.  Yes, a Republican endorsing bigger government. He was practically a Socialist in the eyes of some conservatives today! What did bad Hillary find wrong with those sentiments?

Hillary’s response is rather tame for the period when there was open antagonism between the rulers and the ruled. D’Souza uses a snippet of a sentence taken out of context to portray Hillary as an uncivil person with little respect for authority.  That’s the message of this segment of the film.  Hillary bad.

These days ain’t those days.  There, I said that and you can quote me.

Rulers had rigid rules that gave most of society’s power to men, not women.  Hillary spoke for many who wanted a change.

The rulers said war was necessary and that the ruled were supposed to go fight the war to stop Communism.  The ruled were ordered to fight but were not allowed to vote. The ruled broke things in protest.

At the universities, rulers had clearly defined and time honored curricula choices that reflected the prejudices and preferences of past generations.  The ruled wanted a greater voice in curricula selection.

The rulers had a grading system that seemed arbitrary to the ruled.  What is the difference between a B+ and a B paper?  With few consistent rules to guide the grading process, wouldn’t a pass-fail grading system make more sense?  No, the rulers said.  Rulers make the rules and students follow them.  Is that clear?

Those were the good old days.  College students today are surprised when they hear of these old rules, most of which have been either abandoned or dramatically altered.  The ruled stormed the forts of power and the rulers compromised so that they could continue ruling in whatever capacity they could manage.  Some of the ruled became the rulers.

I do encourage the reader to read the speeches of both Hillary and Brooke.  Hillary’s speech is the shorter, for sure, but both speakers are rather moderate and deliberate, remarkable in an age of sometimes murderous (Kent State) and often bloody (Columbia U. and others in NYC, for example) protests.

Having established that Hillary is a socialist, anarchist Communist, D’Souza then shows the tragedy of her personal life.  For several decades she has been covering up for the sex addiction of her husband and former President Bill Clinton.  Democratic Party = slavery = sexual deviants = Communism = Godlessness = bad.

I was busy writing out D’Souza’s equations when I realized that I was going to miss an appointment.  I had to miss the final 15 minutes of the film but I suspect that D’Souza was going to finish with the tragedy at Benghazi and Hillary’s personal email server while she was Secretary of State. If you want to know how the film turned out, you can rent it on Vudu or spend a couple of hours at your local theater.  I have now seen a Michael Moore film and a Dinesh D’Souza film.  As Johnny Cash sang, I walk the line between either extreme.  I hope I can keep my balance.

//////////////////////////

Notes:

“We urge Congress to consider the most effective means to end Iynching in this country which continues to be a terrible blot on our American civilization.”  Republican presidential platform, 1920. In the House, Republicans held a 50 seat majority, 240 seats to 192 Democratic seats.  In the Senate, Republicans had won a 49 to 47 majority in the 1918 elections.  Repeated Republican efforts were blocked by Democratic Senators (more here)

The claim that Lincoln founded the Republican party is incorrect.  Here and here.

In Buck v. Bell (1927), the Supreme Court ruled that state sterilization laws were legal.  As further evidence of the DP’s efforts to eradicate the black race, D’Souza notes that it was Oliver Wendell Holmes, a Progressive, who wrote the court’s majority opinion.  D’Souza omits the fact that a Republican President, Theodore Roosevelt, appointed Holmes to the court and a Republican majority Senate approved the appointment.

Turning Toward

July 31, 2016

The Fourth Turning

A favorite historical device of the Western tradition is the timeline, running straight from the past to the future.  Cyclic models of history are less popular and circular models seem too formulaic, even primitive, for historical narrative.   Surely, Neil Howe and William Strauss, authors of the 1997 book “The Fourth Turning,” understood that their model might encounter a cool reception from the academic community.

Published a few years before the millennium and the Y2K scare, the book recounted the historical pattern of generations from 1500 through 2000, before taking on the ambitious task of predicting the pattern of events for the coming twenty years.  While researching a previous book “Generations,” the authors discovered a repeating pattern of responses to events.  They developed a model of four generational archetypes spanning the range of a human lifetime.  Every twenty years or so each generation passes into another phase of life, from childhood to adulthood, to middle age, then the elder years.  The authors called these passages “turnings.”

Every 80 years or so, every fourth generation, begins a period of crisis. The authors had projected this current fourth turning to last from approximately 2004 – 2026, understanding that these turnings are not fixed to a calendar. Although the authors trace the turnings back to 1500, previous crisis fourth turnings that we are familiar with are the American Revolution 1773-94, Civil War 1860-65, Depression and WW2 1929-46.

During a crisis period comes a pre-crisis strain that primes the scene for the main crisis.  Each crisis revolves around the social contract, the relationship between individuals and their government.  The resolution of the crisis occurs during the first turning in which a new version of the social contract is forged.  The leaders of these resolutions are the generation in middle age, approximately 42-62.  [So us Boomer parents better be nice to our kids 🙂 ]

In predicting the current crisis period, the authors pulled no punches.  Chapter Ten of the book is titled “A Fourth Turning Prophecy.” The time frames of these prophecies are approximate because they predict behavioral trends.   It has been almost twenty years since the book was published and it surprised me how well the authors understood the trends and ingredients of the crises that have occurred in the past decade.  Frankly, I hope that the authors are wrong about the coming decade when a generation of crisis intensifies and forces a resolution.

The authors predicted a financial crisis about 2005 and sketched a number of other plausible scenarios typical of a generation of crisis.  “The era will have left the financial world arbitraged and tentacled: Debtors won’t know who holds their notes, homeowners who owns their mortgages, and shareholders who runs their equities – and vice versa.” (p. 274 of the Broadway Books 1998 paperback edition)  Sound familiar?  Remember, this was written twelve years before the 2008 financial crisis.

The authors caution that these scenarios are archetypes, unlikely to happen in detail as written and yet the generalities are both scary and prescient. The hypothetical scenarios include terrorists blowing up an airplane, a government shutdown precipitated by a federal budget stalemate, the spread of a new communicable virus and an increasing aggression by Russia toward its former satellite countries. “All you know in advance is something about the molten ingredients of the climax,” the authors wrote.

Twenty years before the main crisis event, the nature of the crisis is difficult to see, the authors cautioned.  A series of crises weaken the social order and people’s expectations, creating tensions between groups in society.  We could use the analogy of tectonic plates to understand the economic and social frictions that build over time until the earthquake is finally triggered.  While a particular event is the catalyst for the main crisis, it is not the cause of the fracturing of the social contract.

The frictions can be promises made to one group that can not be kept.  Technological change may bring economic changes that favor one portion of a society and disadvantage others.  Political changes may pose constitutional challenges that are resolved with violence.  Long simmering military antagonisms may finally break out into war.  These are only a few frictions in a long list presented by the authors (p. 277).

The authors can be forgiven for a few incorrect predictions – that the government would hike taxes in response to a financial crisis or depression.  Perhaps they were misled by the economically conservative mood of the nation at the time when they wrote the book.  The authors did not anticipate that the Federal government would quadruple the Federal debt over fifteen years in response to 9-11 and the 2008 Financial Crisis.  They did not foresee that the Federal Reserve would add four trillion to its balance sheet to absorb the bad securitizations that contributed to the Financial Crisis.

Twenty years ago, the authors guesstimated the onset of the main crisis in the year 2020 followed by a six year period of resolution.  As I noted earlier, it is the middle aged generation that leads in the formation of solutions to these crises.  In this case, those leaders would be the children of the Boomers, the cohort labelled “Generation X” in sociological and popular literature.

Criticisms, controversy and praise for the generational model presented by the authors can be found at a Wikipedia article, which has been flagged for its lack of neutrality. Should a decade pass with no crisis, we could rest assured that the theory is totally bonkers pseudoscience.  There are a few problems, however, that could precipitate a crisis: 1) a federal debt approaching $20 trillion; 2) terrorist acts in the news each week; 3) many trillions of dollars in Social Security and  public pension promises that 80 million Boomers are beginning to redeem; 4) immigration, tax and other  policy disputes over who is entitled to what and who pays what.  These are some of the groaning sounds of tectonic frictions in our country.

Californians live with the possibility of a “big one,” a monster earthquake unleashed at the San Andreas fault that runs along the mountain spine of the state.  Each person silently hopes that the inevitable doesn’t happen in their lifetime.  Count me among that bunch.