Health Care Costs Rise

April 30, 2011

Opponents of the Affordable Care Act (ACA), derisively referred to as Obamacare, often cite the individual mandate to buy insurance as the chief objection to the act.  Most Americans do not like to be told what to do, whether it is paying taxes or buying insurance.  Proponents of the Act defend the individual mandate by likening it to the requirement to buy auto insurance.  Opponents say that a person can choose not to drive a car, thus making auto insurance an inherently optional choice.   ACA leaves no option.  If you breathe, ACA says you need to have insurance.  So, how did we get to a point where the government tells us we have to buy health insurance?

In 1986, the COBRA act mandated that any emergency room that took Federal money must take care of anyone coming into the emergency room.  The bill originated in a Democratic House, but was passed in the Republican Senate and signed by a Republican president.  Since almost all emergency rooms received either Medicare or Medicaid dollars, it meant that the Federal government would now start telling private hospitals which patients they should treat.

New York City is at the forefront of most reforms.  One of the world capitals of trade and finance, NYC has a large and diverse population crammed into a relatively small space.  Problems in this urban pressure cooker surface earlier than in other areas of the country.  In the 60s, NYC passed a law mandating that any hospital emergency room that received any kind of city money had to treat people whether or not they could pay.  In the late sixties and early seventies I worked in a large privately owned hospital in NYC.  Working part of that time in the emergency room, I saw that not only did hospitals not have a choice in who they could treat but that the patients no longer had a choice either.  Whether in response to possible litigation or by law, an injured person who refused to be taken by ambulance to a hospital was assumed to be under stress and not in their right mind from the injury.  The ambulance drivers were instructed to bring in the patients whether they wanted treatment or not. The emergency room would routinely get injured homeless and drunk patients who had to be coerced into receiving treatment.  Gunshot victims, sometimes anesthetized by alcohol, heroin or other drugs, fought against care, complaining that it was only a flesh wound.  As you can imagine, some of these protesting patients were not a lot of fun to treat.  Patients used the emergency room for runny noses, gassy stomachs and acne flare-ups.  Parents brought their young daughters in upon their first menstruation.  It was particularly challenging to keep the more gruesome gunshot wound, knife stabbing and car accident victims separated from those with less violent complaints and illnesses. 

Today, that emergency room scene plays out daily in hospitals around this country.  The COBRA act provided no federal funding for this mandate of mercy, forcing hospitals to invent creative accounting and pricing policies to offset the cost of charity care.  In a recent publication, an  American Hospital Association survey reported that charity care has increased 20% since 1980.

The real charity care though is not the relatively small 6.1% of total hospital costs that uncompensated care accounts for.  Rather it is the increasing share of patient visits that are covered by Medicare and Medicaid.  As the chart above shows, M & M care accounted for 44% of hospital costs in 1980.  In 2009, it had grown to 55%, with much of that increase coming from Medicaid, the low income insurance program.  Neither Medicare or Medicaid pay the full cost of care.  The chart below shows the growing shortfall in just the last 12 years.

From almost zero in 1997, underpaid hospital costs have grown to over $35B in 2009.  Where do the hospitals get the difference that they lose in treating Medicare and Medicaid patients?  By jacking up reimbursements from those with private insurance.  The chart below shows a 20 year history of the extra that hospitals charge private insurance companies to make up the shortfall in Medicare and Medicaid payments.

This past week, I received the renewal rates for my company’s health insurance program – a 17% increase.  Double digit rate increases have been normal for the past eight years but this year’s increase is the highest yet, surpassing the 13.4% increase a few years ago.  In the face of rapidly rising health insurance premiums, small companies who want to get and keep quality employees face a formidable challenge in providing health insurance to their employees.  Whether one agrees with all the elements of the ACA, small business owners have known for the past decade that something had to be done.

As the chart above shows private insurance companies pay an additional 34% to hospitals to make up for payment shortfalls from Medicare and Medicaid insured patients.  The insurance company passes on that increase to its customers and the resulting cost shifting means ever rising insurance rates.  As the number of Medicare and Medicaid patients continues to grow, the cost shifting will increase in proportion.  Each states sets the Medicaid reimbursement rate for that state.  With many of them experiencing severe budget shortfalls, reimbursement rates will fall, accelerating the cost shift to private insurance patients.

During the upcoming 2012 election campaigns, we are unlikely to hear about the complexities of cost shifting. Politicians have to convey their summary of the problem in two sentences or less.  Is that the fault of politicians or the voters? Republicans will say rising insurance rates are because of Obamacare.  Was it Obamacare that caused the double digit increases during the Bush years?  Democrats will say that the ACA is the cure for the double digit increases of the Bush years.  That’s what I like about election campaign rhetoric – everything is so simple and easy to understand.
Government Spending

The dastardly demons of demagoguery are at it again.  You know who I mean – the Republicans and Tea Partiers who swaggered through Washington in the past two weeks, brandishing cutlasses and slashing funds to needy women and children.

Republicans would gain more credibility if they could find even a few dollars to cut in a military budget that exceeds $1T – that’s trillion, as in 12 zeroes. But, they have kick started the debate.

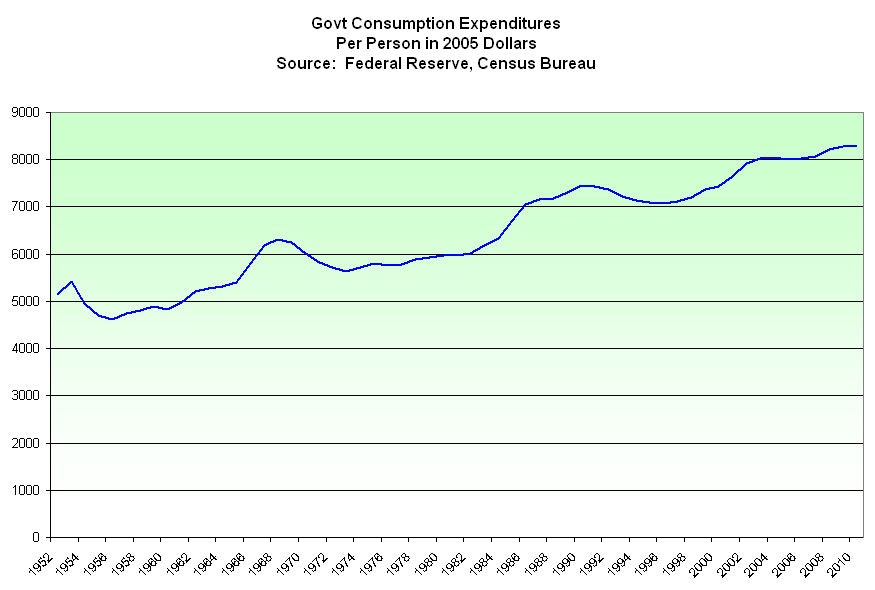
Below is a chart of per person federal, state and local spending in real, inflation-adjusted dollars.  This does not include what are called transfer payments, like social security and unemployment checks the government sends out.  More military spending, more social welfare programs, more health care programs, more regulatory agencies and it all adds up to a 60% per person increase over the past 60 years.

When do we start having the conversation about reducing government spending?  When the increase is 100%?  That has been a question that few politicians wanted to tackle.  In 2010, President Obama appointed a debt and deficit commission which made recommendations in December 2010, after the elections.  Some Democrats in tightly contested 2010 election races did not want to have any budget debates before the election, leaving then speaker Nancy Pelosi without a convincing majority in the House.  The Republicans in the Senate had one word in response to most Democratic House bills – “No”.  Unable to break Republican filibusters in the Senate, any budget resolution passed by the House would probably have gone into the Senate trash bin.  In February, the Obama administration ducked the deficit commission recommendations when it presented the FY 2012 (Starts Sept 2011) budget.

In this game of political chicken, someone finally went first!  On April 5th, Paul Ryan, the Republican House Budget Committee chairman, revealed his committee’s 2012 Budget proposal.  This past week, President Obama presented his long term budget “plan” as a rebuttal to Ryan’s plan.  The NY times has a short comparison of the two plans.  An innocent bystander might ask why the President could not present his administration’s plan when he presented the 2012 budget proposal two months ago.

Military spending has to be the first subject of any reasonable discussion.  Including pension, health care and training programs for ex-military, the $1T in current military spending is $3333 per person, or almost a third of the $9400 (in current dollars) per person government cost.

Structural changes to Medicaid and Medicare have to be the second topic of discussion. In January 2010, the Congressional Budget Office estimated 2010 Medicare and Medicaid costs at $800B and projected yearly increases of 7%, more than double the average 3% inflation rate of the past thirty years.

Some Democratic politicians accuse the Republicans of throwing women, children and the poor under the train and advocate higher taxes on the rich.  But there simply aren’t enough rich people.  In July 2010, the IRS released an analysis of 2008 tax returns.  If the Federal government were to confiscate ALL the adjusted gross income of those making $200K or more, that would total about $2.46 trillion in 2008 dollars, or about $2.6 trillion in 2011 dollars.  That amount is about 2/3 of estimated Federal spending in 2011.

The 2011 budget has a projected deficit of $1.65 trillion (Wikipedia article) How much would we have to tax every rich person to make up this year’s deficit?  In 2008, the IRS reported that there were almost 4.4 million taxpayers making more than $200K.  We would need to charge $375,000 to every one of those taxpayers to make up this year’s deficit.  Obviously, we couldn’t get people making $200K to pay $375K in taxes. 

So let’s pass a law to soak the 319,000 millionaires by taking away all of their deductions and take 90% of their income.  That will give the Federal government $900B in additional revenue but we are still short $750B.  Let’s take away all the deductions for those 574,000 people making more than $500K and tax them at 90%.  That will raise another $351B but we are still short about $400B.  Finally, we take away all the deductions for people making more than $250K and tax them at 50% and we have balanced the budget for this year!

Taxing the rich won’t solve our budget problems. Reducing spending alone will not solve our budget problems.  We need a combination of higher taxes on everyone and reduced spending.  Unless we can come to this two part solution of higher taxes and lower expenses, we will continue to run deficits and ever higher long term debt.  In the next decade, bondholders will demand ever higher interest rates to buy this country’s debt.  Increasing interest payments will only make this country’s spending problems worse.  The time to act is now.

One Percent Club

Recently I received links to a few articles on the top income earners – the “one percenters” in this country.  One is a recent Vanity Fair article, written by the economist Joseph Stiglitz, that provides a thoughtful analysis of the economic and political consequences of income disparity. A few days ago the movie critic, Roger Ebert, penned a more emotional article about the one percenters.

As I noted in a previous blog, an adjusted gross income over $410K gets a person in the one percent club.  This club includes the New York Yankees Alex Rodriguez at $33M, his fellow team mate CC Sabathia at $24M, David Letterman at $24M, country star Tim McGraw at $23M and poker stud Daniel Negreanu at $14M.

Roger Ebert’s sentiments probably reflect a more common gut response to the one percenters.  Ebert chose to note the $21M pay package of Jamie Dimon, CEO of JPMorgan Chase, one of the largest banks in the world.   Chase withstood the financial crisis with no bailout funds other than temporary liquidity funds that were quickly repaid.  Quite the opposite. The government and Federal Reserve actually came to Chase asking for a bailout of another troubled banking giant, Washington Mutual. Had Ebert done a bit more homework in his hunt for a villainous financial robber baron, he would have picked John Thain, the CEO who earned over $80M in the year he steered Merrill Lynch into a collapse that threatened the financial system.

So, we can make life simple and reason that there are two kinds of one percenters: the good and the bad. On the good side are people who do stuff: Alex bangs out baseballs, CC throws baseballs, David throw jokes and Tim belts out tunes.

On the bad side then are the one percenters who don’t do anything that involves banging, belting or throwing.  Since most of us can’t grasp what the CEO of a bank does to earn that much money, it must be nefarious back room wheeling and dealing, not hitting and throwing and singing.

In the recent and ongoing debates about whether to continue tax cuts for the wealthy, we should make it clear to our congressional representatives and tell them that we want only the bad one percenters to pay more taxes.

The one percent club also includes anesthesiologists and all we know about what they do is that they put us to sleep before surgery.  Let’s put them in the good one percenter group.  I want to wake up after surgery.

Effective Tax Rates

The effective or net tax rate is the amount of income tax we pay on our adjusted gross income.  For many of us under 65, our adjusted gross income is our total income.

The Tax Reform Act of 1986 eliminated many tax breaks and lowered marginal tax rates, which lowered the effective tax rate (ETR).  As a result of the act, the ETR for the top 1% of income earners dropped from 33% in 1986 to 26.5% in 1987. 

The IRS regularly publishes studies on various aspects of the tax system.  One of their studies, updated in July 2010, reviewed income and taxes paid for the period 1986 to 2007.

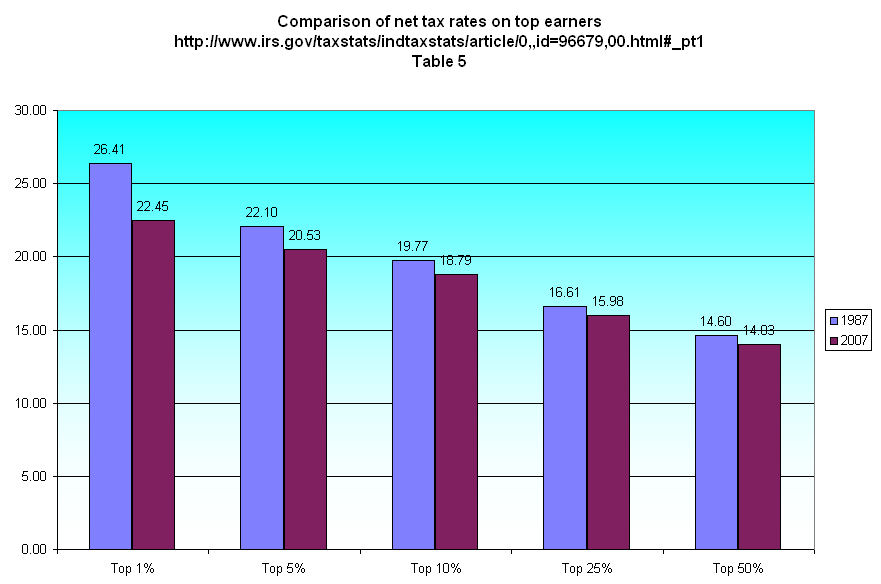
Over the thirty years since 1987, the majority of taxpayers have made a beggars bargain by voting for politicians who promised lower tax rates. During that time, many taxpayers have received a tiny decrease in their ETR while top income earners have seen a 15% decrease.

Below is a chart comparing the ETR for various income brackets in 1987, the year after the reform act, and 2007.

In 2007, what income bracket did you fall into?  The chart below shows the top half of all adjusted gross incomes.  If you made $33K or more in 2007, you were in the top half of income earners in this country.

The highest earners have enjoyed the biggest reductions in their ETR over the past thirty years.

During the past election cycle, there was much debate about increasing the marginal tax rate on the top incomes in this country.  Republicans made significant electoral gains and quashed any attempts to increase taxes, resulting in a compromise this past December that left tax rates unchanged.

Some voters objected in principle to ANY increase in taxes.  Some voters objected in principle to an increase on only a small minority of taxpayers, maintaining that the tax pain should be shared so some degree by all taxpayers.  The minority of voters who wanted the tax burden to fall heaviest on the upper income taxpayers might have been able to win the argument, particularly among moderates, if they had proposed an across the board 5 or 10% increase in income tax rates.  An increase of 10% in a 35% income tax bracket is far more than a 10% increase in a 15% tax bracket.  Instead, Democrats proposing a “soak the rich” tax policy change watched in horror as the electorate shifted Republican in many states.  “Soak the rich” tax proposals seem to violate some sense of fairness in the American voter, even those who are not rich.

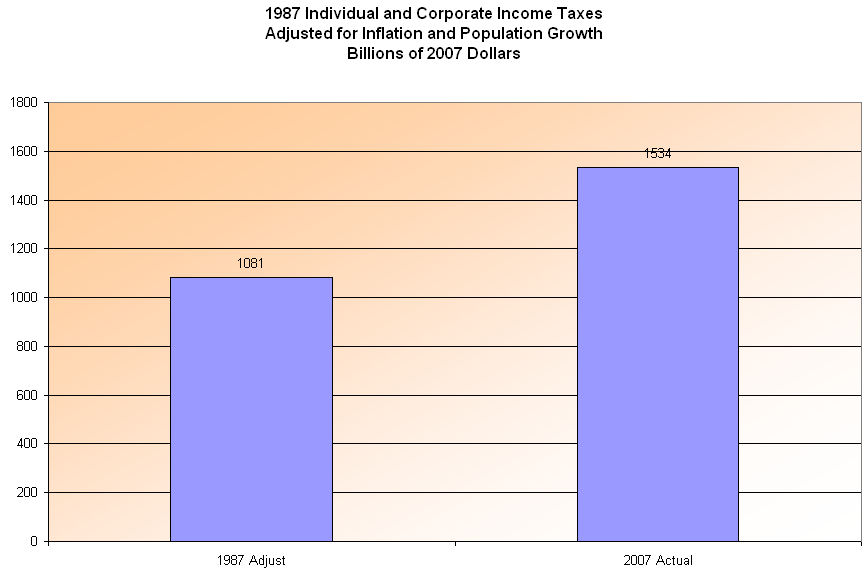
In 1987, the Federal Government collected $392.5B in individual income taxes.  Adjusting for inflation (about 83%) and population growth (about 24%) from 1987 – 2007, that amount is $889B.  What did the Feds actually collect in 2007?  $1,163.5B, an increase of 30% over adjusted 1987 levels.  In 2009 and 2010, income tax collections were about $200B less than 2007 levels, yet still about the same level as 1987.  This country is running huge deficits each year simply because Federal spending has increased far more than inflation and population growth combined. 

Below is a comparison of 1987 individual and corporate income taxes adjusted for inflation and population growth with the actual taxes collected in 2007.

Tax collections in 2007 were far stronger than the 1987 pace BUT the federal government is spending money at a faster rate than 1987. Below is a comparison of adjusted 1987 on-budget Federal spending – which excludes most of Social Security – with the actual amount spent in 2007.

As Republican presidential candidates prepare to announce their candidacy, we can be certain that the debate over higher taxes vs. reduced spending will only heat up further.  Proponents of higher taxes can point to the charts above and make a good case that the top 5% of incomes have enjoyed greater tax reductions than the rest of us over the past thirty years.  Proponents of reduced spending can make a valid case that the federal government has just gotten too big. There is no resolution to the debate.  Some people want the federal government to take a greater role in our lives – some don’t.  The only “solution” is a compromise – cut some Federal spending, including defense, and bump up taxes an equal percentage on most American taxpayers.

Taxes – The Old and The New

The Federal government has a revenue problem.  Both personal and corporate income tax collections are down.  The charts below show individual income taxes for the past 60 years and a smoothed average of those amounts. (Click to enlarge in separate tab)

Below is the same data smoothed with a 4 year moving average to show the overall trend.

Those with high incomes are paying less in taxes than they did.  But the problem is more widespread.  ALL of us are paying less in Federal income tax than we used to. 

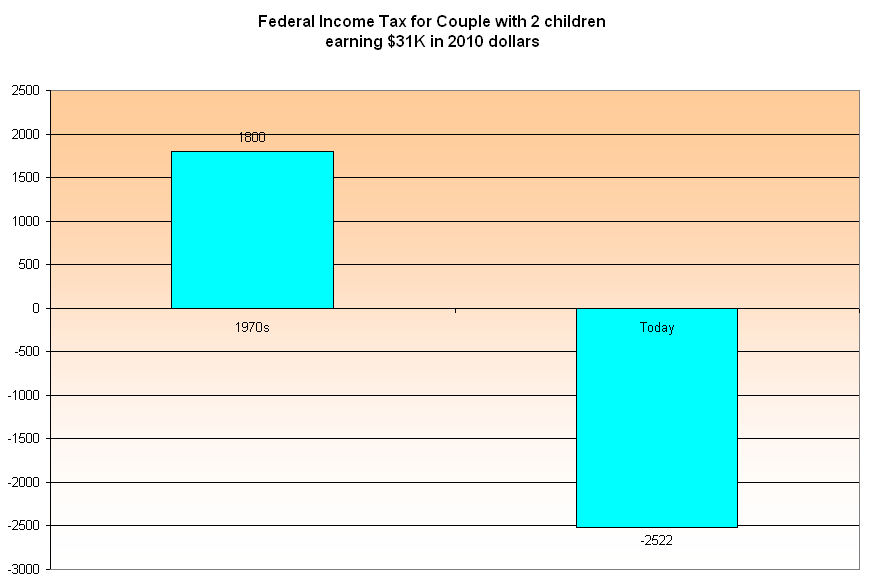
In 1974, a low income couple with two children making $7000 paid $400  in income taxes.  In inflation adjusted dollars, that is $31,000 dollars of income and a tax bill of $1800.  Under current tax law, a couple with two children making $31,000 would get a net credit of $2522 in income taxes.  They would get this credit through the earned income credit program.  For this couple, the difference – the tax savings – between the tax policy of the 1970s and today is $4300.

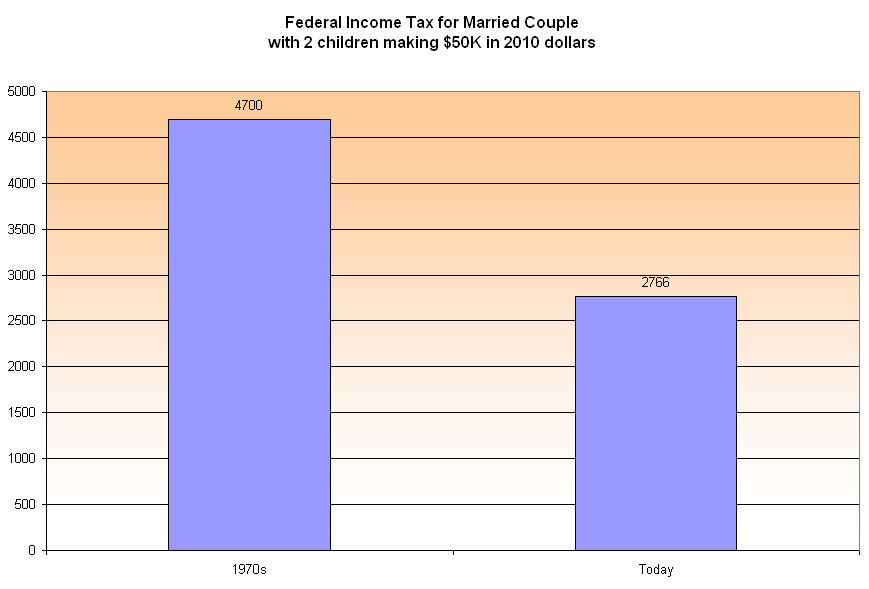
In 1978, a couple with two children making the equivalent of $50,000 in 2010 dollars paid the equivalent of $4700 in income taxes.  Under existing tax policy, they pay $2766, a savings of almost $2000.

In 1978, a single person making $12,000 paid almost $1700 in income tax.  In inflation adjusted dollars, those amounts translate to $40,000 income and a tax bill of $5500.  What would a single person making that same money pay today?  $4600, a savings of $900 when compared to the tax policies of the 1970s.

In the past 30 years, the taxpayers of America wanted lower taxes and they voted in the politicians who would give them lower taxes.  Many of us wanted more environmental and labor regulations, social support programs and we got those too.  Many of us voted for more defense and we got that.  Military bases mean jobs for a lot of voters and voters like jobs.  So who is going to pay for all of this?  “Not me,” we all said.  “Get it from the other guy,” we moaned. 

Reducing the debt of this nation will require changes in both tax revenues and spending.  Impose more taxes on those in ALL income brackets, not just the rich.  There aren’t enough rich people to make up the yearly deficits. For all but the very poorest in our country, there should be a minimum income tax, even if it is only $100, so that everyone has some “skin in the game.”

Eliminate the corporate income tax and raise the tax rate on the profits that they pay out in dividends to shareholders and stock awards to company officers. The accountants and lawyers at the IRS will never be able to compete with the tax accountants and lawyers at large companies.

Consolidate duplicate regulatory government departments which overlap in their oversight responsibilities.  Well meaning and egotistical congresspeople want their own agencies supervised by their committee and the result is a hodge-podge of agencies.

Reduce spending, beginning with Congresspeople themselves.  If tax revenues decrease, then the budget allowance of each Congressperson’s office should be reduced by the same amount.  While the millions of dollars involved are negligible within the scope of the entire Federal budget, it enshrines a principle that if taxpayers are tightening their belts, so should their elected representatives.

Make a dedicated effort to detect fraud and overcharges in defense and entitlement programs and prosecute the perpetrators.

If we continue to put off these decisions, it will only get worse.  Each year, as we have to pay more in interest on the nation’s debt, programs will continue to experience budget cuts, provoking an economic and class warfare that may permanently scar the spirit of the people of this country. We owe it not only to our kids but to ourselves to make some difficult but prudent choices soon.

Big Daddy

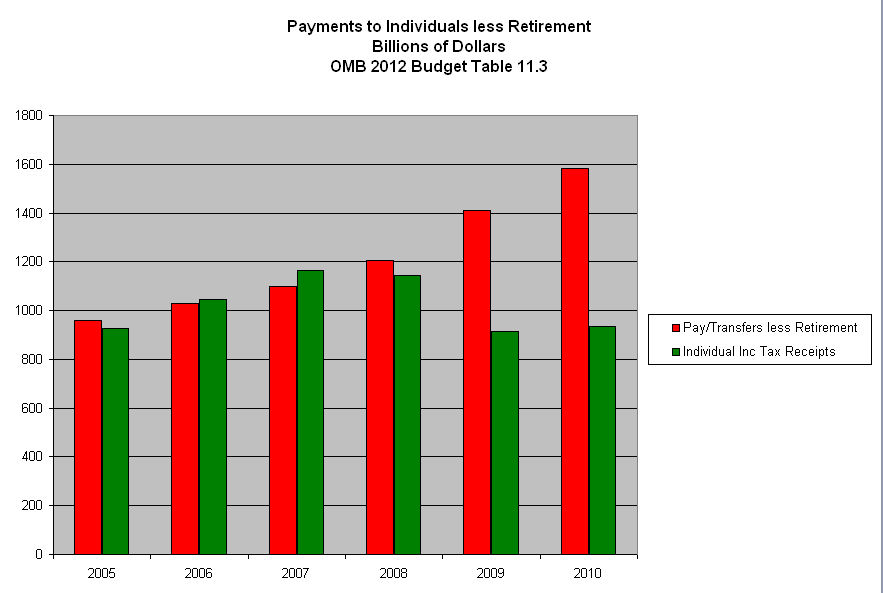
Big Daddy in Washington got big pockets.  He gets money and gives money.  Big Daddy collects income taxes and then pays all that money out to people who need it for something – school, food, housing assistance, disability, training and many other programs.  Big Daddy got a big hole in his pocket and here’s why.  The way it’s supposed to work is that Big Daddy pays out what he collects in individual income taxes – money in, money out.  If you look at the mid decade years in the chart below, you will see the way it’s supposed to work – approximately the same amount of money went out to the needy as what came in from those who weren’t needy. Those that got give to those who don’t – and all that charity goes through Big Daddy’s pockets.

The green bars are individual income tax receipts.  The red bars are the payments of all the Federal social assistance programs not including Social Security, railroad and military retirement.

Instead of sending our income tax to Big Daddy in Washington, each of us could just walk over to our neighbor down the street who is having a hard time for one reason or another and give them our income tax.  But we wouldn’t get to fill out income tax forms which is an exciting way to spend a weekend or two.  The person who needs the money wouldn’t get to fill out long applications for student grants or housing assistance or food stamps.  Long applications and supporting documentation are fun things to do so we wouldn’t want to deprive people of that joy.

The past two years show clearly what the problem is.  Lots of money out and not enough money in.  So what’s Big Daddy gonna do?  The Green People tug at Big Daddy’s pants and say “Hey, Big Daddy, raise taxes on the rich people!”  The Red People kick Big Daddy in the ankle and say “Big Daddy, you got to reduce payments to all these needy folks!”  Big Daddy sure has got a heap of problems.

March of Generations

2010 marked the demographic closing of the “Greatest” generation of the Great Depression and WW2 and the start of the Boomer generation, when the Boomers born in 1946 reach 65.  During the past twenty years, the Greaters, I will call them, and their children, the Boomers, have contributed the most to shaping public policy.  Those over 45 vote the most frequently and in greater concentrations than younger generations.  The overwhelming majority of politicians at the national level are over 45.  Earning power tends to peak in the 45 – 64 age range so it is that generation that contributes the most in taxes as a percentage of the total.  As a demographic, those in the 65+ age consume more federal tax dollars.  Politically and economically these two generations have a dominant influence on the nation.  So how has it been going?

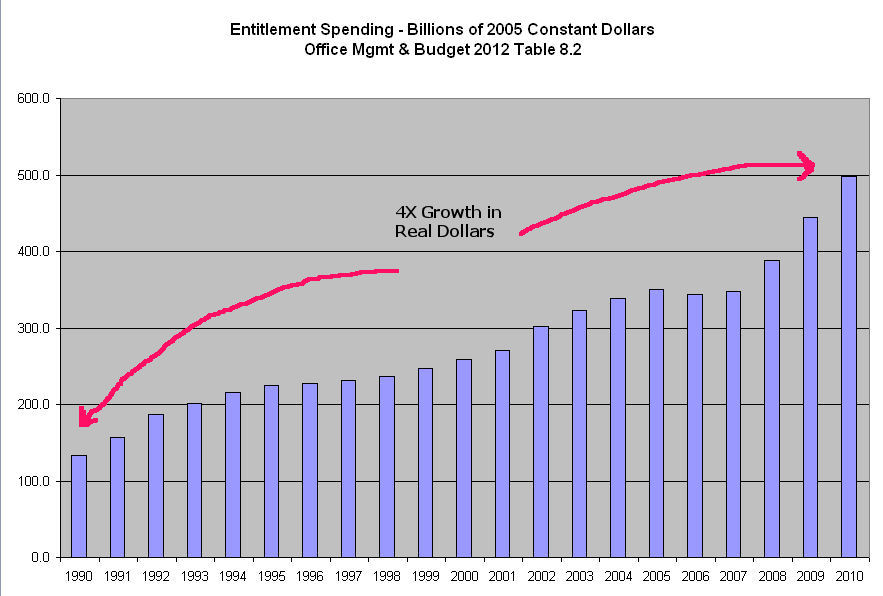
These two generations have been especially kind to the less fortunate.  Below is a chart of federal spending on entitlements that includes Medicaid, food stamps (SNAP), family support assistance (AFDC), temporary assistance to needy families (TANF), welfare contingency fund, child care entitlement to States, child nutrition programs, foster care and adoption assistance, Children’s health insurance, supplemental security income (SSI) and other programs.  These are inflation-adjusted dollars. (Click to enlarge in separate tab)

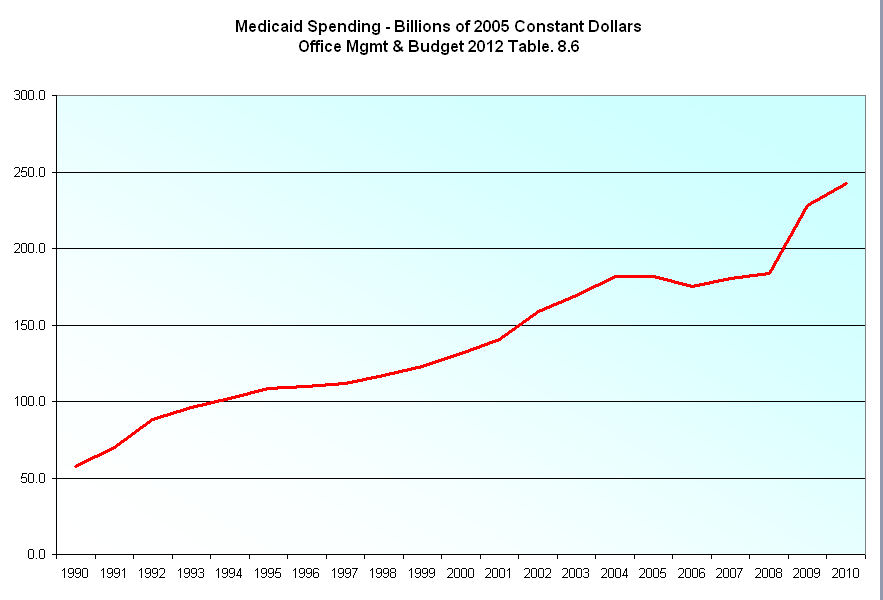
Chiefly responsible for the rise of assistance spending has been Medicaid.  Below is just the federal component of Medicaid spending, in real inflation adjusted dollars, over the past 20 years. 

For most of the past twenty years, states and local communities contributed about 70 cents for each dollar that the Federal government spent. (Source – (CMS) Centers for Medicare and Medicaid Services)  As part of the stimulus program, the states only kicked in 50 cents for each Fed dollar. As these stimulus funds run out this year, many states will be hard pressed to meet accelerating Medicaid costs.

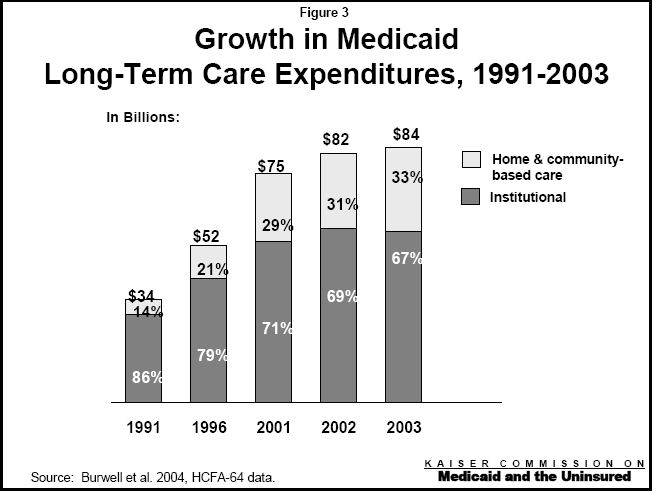
Joblessness has led to increased enrollment in the program. Colorado had a 13% increase in enrollment last year. But an ever increasing cost is long term care for seniors who spend down what resources they have, then enter the Medicaid program to meet either long term home care expenses or nursing home costs. A 2005 Kaiser Family Foundation analysis of long term care spending in 2003 revealed that Medicaid paid $34 billion or 40% of total long term care expenses.  $34 billion was an eighth of total Medicaid spending of $270 billion that year but as the population ages, the long term care component of Medicaid costs will inevitably rise.

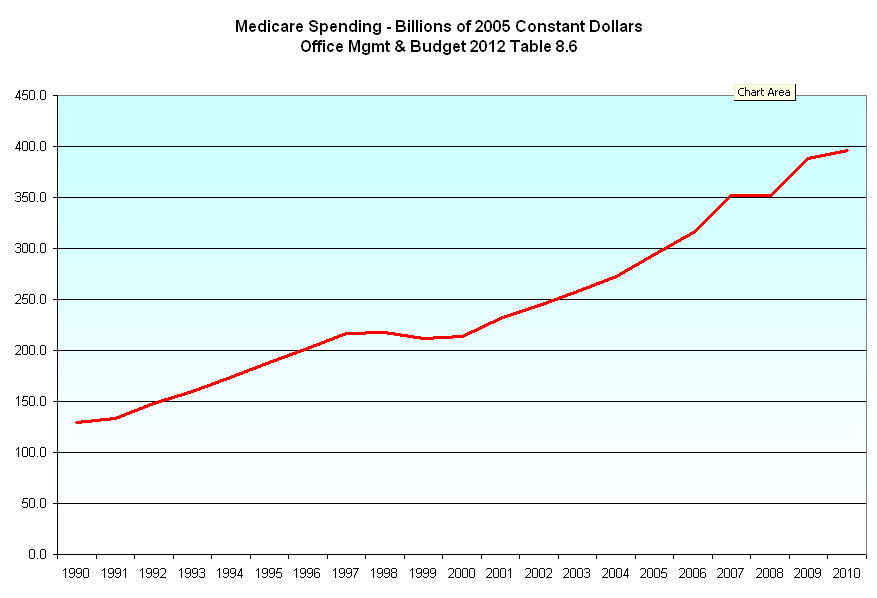
The growing sophistication of medical technology has enabled the Greaters to live longer and better than their parents did.  Body parts wear out but can be replaced or repaired.  A dying moment can be postponed for several days or weeks or months with the use of critical care and life support systems.  Much of that care gets charged to Medicare.  Below is a chart of Medicare spending in inflation-adjusted dollars.

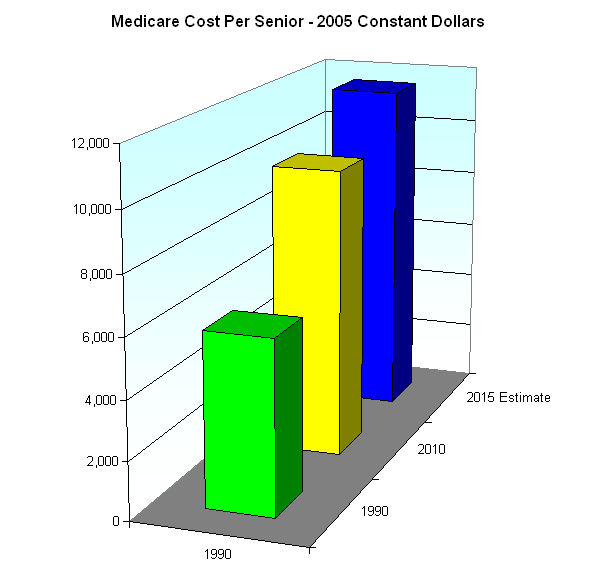
Medicare covers some disabled and others but it is primarily a program for seniors aged 65+.  Let’s look at the total Medicare cost divided by the number of seniors so that we get a per senior cost.  This is not the actual per person cost but the process enables us to make some projections. Over the past 20 years, the per senior cost of Medicare has grown, in inflation adjusted dollars, by 67%, a rise of 2.6% per year over inflation.  Using that growth rate, I estimate a per senior Medicare cost of over $11,000 in 2015.

How are these rising costs being paid?  A Kaiser Family Foundation analysis of 2009 Medicare revenues found that the premiums that seniors pay each month for Medicare B (doctor’s bills) accounted for only 13% of Medicare costs (Page 12).  Payroll taxes made up 38%.  Income taxes pay 44% of the cost.  If Medicare is truly an insurance program and we want to subsidize health care for our seniors, why do we take almost half the cost of this “insurance” program from our income taxes? 

During the past twenty years, the Census Bureau reports that the population of those aged 65+ has increased from 22 million in 1990 to 40 million in 2010, an average growth rate of 3%. In 2015, the US Census Bureau estimates that the senior population will total almost 47 million.  Now that the Boomers are hitting 65, that population growth rate is accelerating to 3.3%. 

Math time:  47 million seniors x $11,583 (my projected average cost per senior in 2005 constant dollars) = $544 billion, over half a trillion dollars.  My methodology gives a 2015 estimated total cost of $70 billion more than the Obama 2012 budget estimate of $473 billion in 2005 constant dollars and hey, I could be wrong.  Perhaps the ratio of disabled and other recipients of Medicare won’t increase as fast as the senior population growth.  Perhaps there will be savings under the new health plan.  Perhaps the government will crack down on the fraud and abuse in the Medicare system. 

So what to do?  
1) Cut down on fraud and abuse.  Make changes to the timeliness of the Medicare payment system so that more claims can be reviewed before being paid.  Spend more money on field agents who can inspect newer medical facilities to ensure that they are legitimate.  Use database technologies to scan for doctors who are billing Medicare for far above what the average physician in their specialty in that geographic area bills Medicare. 
2)  Reward efficiency.  There is much talk of payments based on outcomes, not procedures.  Such a program will be difficult to implement and follow but it promises savings.  
3) Pay up for our values.  If we are going to support the health of our senior and disabled population, then we need to pay for it directly.  Lower the Medicare tax rate and tax all income regardless of its source.  We reach into the general tax revenue kitty to subsidize seniors so that they can have affordable monthly Medicare premiums.  If that reflects our values,  let’s take that cost and add it to the payroll tax rate. 

We can do this.

Budget Balloon

I ran across this article at the Motley Fool over the weekend and it is well worth a look because the author, Morgan Housel, has laid out a table comparing the various expenditures of 2007, the current fiscal year 2011, and the recent budget proposal for the coming year 2012.  The comparison with 2007, before the recession began, is an informative baseline.

Future Fumbles

Every Christmas, the President and his faithful scribe journey to Camp David near Thurmont, MD. There on the top of the mountain they wait for God to give them the 10 year economic forecast, including the projected GDP and unemployment rate for the nation. In February, or January if the President is leaving office, he presents the tablets of wisdom to Congress in the annual budget. The Congressional Budget Office then uses these projections to score various spending bills and programs, divining their future impact on the budget of the nation.

Actually, the economic forecast is painstakenly crafted each January by the President’s economic advisors, who are locked in a dungeon on the 4th sublevel under the White House, where they tear at each other limbs until the victor emerges from the dungeon gloom with his forecast, which he presents to the President.

In January 2001, just as President Clinton was leaving office, he presented what is called the “Legacy” budget to Congress. It included a robust growth of 5.4% in GDP during the early part of the 2000s, tapering to a 5.1% growth at the end of the decade. This rosy projection was far above the 3% that the nation had experienced during the past thirty years. After 9-11, President Bush’s administration revised growth projections to a more reasonable 2.2% growth for 2002, then forecast a slightly more subdued GDP growth than Clinton had envisioned but never below 5%. So how did these prognostications match up with reality? Below is a chart of projections (Source – last table on the page) and the official GDP numbers as determined by the BEA. (Click to enlarge in a separate tab)

Actual GDP numbers were a bit above Bush’s post 9-11 forecast – until 2009 and 2010. Projected 2009 GDP of $15 trillion was almost a trillion more than what we actually produced. 2010’s performance was more than a trillion below Bush’s forecast 8 years earlier. Federal revenues average about 18% of GDP so each trillion below GDP projections represents $180 billion in revenue that is not going to come into the Treasury as planned. Those plans assume unemployment at less than 6%. As it has climbed to above 9%, the shortage of revenue is even more pronounced.

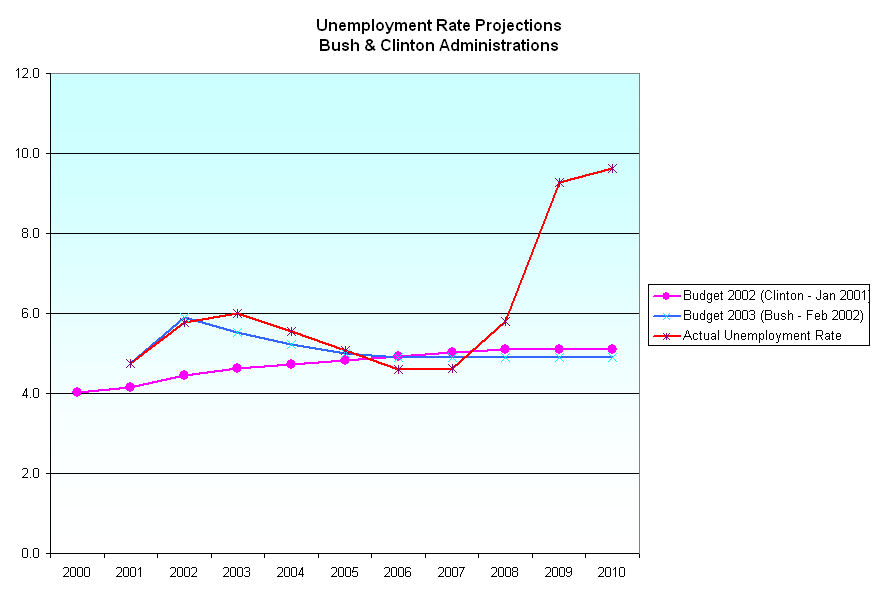
Below is a chart of projected unemployment rates for the past decade and the actual average unemployment rate for each of the past eight years. Clinton’s projections, occurring before 9-11, were rosy. Bush’s post 9-11 projects were fairly accurate. His economic team anticipated a faster rebound after the recession of 2002 but the unemployment rate actually dropped below projections during the heated years when the housing market rose dramatically.

What neither projection could envision was the severe recessionary unemployment of 2008 – 2010. What becomes obvious is that Presidential budget forecasts have not included recessions unless they were ongoing at the time of the forecast. Since recessions occur fairly regularly in an average seven year cycle, it appears that these forecasts are unrealistically optimistic. Since they help determine economic policy, spending on social and defense programs, they should include such a likelihood or we are doomed to be “surprised” at the onset of every recession. Each “surprise” results in a deficit, adding to the total debt of the nation.

Under the current budget process, there is no upside for a President’s economic team to project recessions since it means a projection of less revenues for the government, and thus, less funding for their programs. A more realistic budget process would include at least a mild recession every 7 years. If a President is elected and there has not been a recession in 3 years, then his forecast assumptions should include a recession 4 years in the future. Unrealistic optimism only hurts both the finances and the spirit of our people when recessions occur, revenues fall and programs have to be curtailed or cut.

Mortgage Mosh Pit

In my series of Federal teat suckers, I’ll now look at the housing market.  If you are a homeowner with a 30 year mortgage, it might surprise you to find that you are on the home stamp program, a program that may pay you each month about the same as the average food stamp recipient.

President Obama has recently spoken about a 5 – 7 year transition of the mortgage market from federal quasi-governmental agencies like Fannie Mae and Freddie Mac to the private market.  The problem is:  private market lenders do not want to loan money to homeowners for thirty years.  A 30 year mortgage has no prepayment penalty so that the homeowner can pay off the loan at any time and refinance when rates are lower.  In the private market, lenders – and bondholders – like to be paid more interest when they tie up their money for longer periods of time and 30 years is a very long time. A history of the 30 year mortgage.

Let’s compare Joe homeowner to one of the largest and most dependable companies in the world – Johnson and Johnson (J&J).  For more than a 100 years, this company has regularly paid dividends to their stockholders and paid off their bonds.  In August 2010, the company sold 30 year bonds at 4.5% (Source).  Joe homeowner could get a 30 year mortgage for about 4.4% at that time.  What would you choose if you had the money?  Loan it to J&J or loan it to Joe homeowner for his mortgage?  In a realistic private mortgage market, Joe homeowner, with a good credit rating, would need to pay 2 – 3% above what Johnson and Johnson is paying simply because Joe is a riskier bet than J&J.  But that higher interest rate would price a lot of potential homeowners out of the market. 

The monthly mortage payment (PI) on a $250,000 30 year loan at 5% interest is $1342.  At 7%, the monthly payment is $1663, more than $300 higher.  At 8%, the monthly payment is $1834, a $500 free monthly premium to the homeowner.  So why do banks and mortgage companies loan money on mortgages?  Because the Federal government backs 90% of the mortgages in this country.  The government and its quasi-government mortgage agencies effectively loan the credit rating of the richest country on the planet, the United States, to little Joe homeowner, enabling him to save hundreds of dollars each month on his house. 

In Colorado in 2007, a low income family of 3 received a little over $400 a month in food stamps (Source).   Food does not build equity –  homes do.  The government’s home stamp program pays Joe about as much as the food stamp family and lets him keep any home appreciation – or lately, depreciation.  In addition to the home stamp program, the federal government has a stamp tax program that enables Joe to write off most of his mortgage payment for the first ten years since it mostly interest.  Not only does Joe get $300+ a month in savings on his mortgage but gets an additional $150+ a month in reduced income taxes. 

Until the meltdown in the housing market, the thinking was that real estate values always went up so the government was happy to loan its credit rating to homeowners at little or no cost.  Happy teat-sucking homeowners voted for the politicians who continued these home welfare programs. Then, in 2007, the unthinkable happened.  First home prices stopped rising, then started to decline in some markets.  Then the banking crisis of 2008 hit and price declines accelerated, leaving many recent homeowners “underwater”, owing more money on their house than it was worth.  Job losses and continuing price declines led many homeowners to walk away from their homes.  As of mid 2010, Fannie Mae and Freddie Mac had “borrowed” $148 billion from the Treasury (Source) to make up for the losses.  Mega-banks have written down billons and some estimate that the default total will approach $1 trillion.

In a recent Bloomberg article, “About $600 billion of the [Option ARM – Adjustable Rate Mortgage] loans were made from 2005 through 2007, according to industry newsletter Inside Mortgage Finance. Of those packaged into bonds, some 20 percent have been liquidated at losses to investors, and almost half of the remaining ones are at least 30 days delinquent, in foreclosure or have been seized by lenders, according to data from JPMorgan.” “A model developed by JPMorgan Chase & Co. analysts predicts that 70 percent of remaining option-ARM loans that were bundled into bonds will eventually default.” 

The federal government will continue to be pumping in money to the home stamp program for years.  The $148 billion already pumped in is just a down-payment on this program.  In his 2012 Budget, Obama wants to spend $85 billion on the Food Stamp program called SNAP, an annualized increase of 7.5% over 2010 spending.  If only we could hold the increases in the cost of the home stamp program to those levels.