Hell House

If you rent you probably won’t be interested in this post.  If you own a house, even if it’s paid for, this AP article on false foreclosures by some of the biggest banks in America may surprise and anger you.  If your house is paid for and you receive a foreclosure notice, you might think that it is a simple paperwork mistake that can be cleared up with a few phone calls to the mortgage company filing the foreclosure.  You conclude that they have the wrong address on their records or a name that is similar to yours – mistakes that can be easily rectified.  You may find that you have just entered the twilight zone.

As you read the article, pay attention to the dates when these incidents occurred.  In one case, it has been fourteen months since the mistake was brought to the mortgage company’s attention and they are still “resolving” what should be a simple paperwork mistake that should take a few days.

Oh, and if you are out of a job, some law firms have several positions open as Vice-President for Foreclosures.   No experience necessary.

Unemployment Initial Claims

Every Thursday the Bureau of Labor Statistics (BLS) compiles the initial claims for unemployment in each state.  It publishes both the raw figures and a “seasonally adjusted” (SA) number which accounts for anomalies like higher initial claims after the Christmas season is over and department stores lay off employees.  To smooth out the weekly numbers, it uses a 4 week moving average to get a truer trend of the number of people filing initial claims for UI.

Below is a 5 year history of these initial claims.  In the past few months, the number of initial claims has resumed its decline but a signal that the labor market is on a solid recovery path occurs when the 4 week average drops below 400,000.  As you can see in the graph, initial claims hovered around the 300,000 mark during the mid decade when the economy was more robust. (Click to enlarge in separate tab)

We often hear and read of comparisons of current unemployment with that of the 1982 – 83 recession.  A picture is a worth a 1000 words so I took a 3 year slice of the graph above and overlaid it on a graph of initial claims during the early 80s.

They look similar except that the current recession lasted longer than the 1982-83 recession.  In the past few years and in  the early 80s, intial claims climbed dramatically, then fell.  The comparison graph shows the important difference.  Unlike the early 80s, when initial claims continued to fall as the economy recovered, we have been “stuck” this year in a very slow decline of initial claims.

To understand the true severity of this downturn, however, we must really “zoom out” and look at total civilian employment, which includes government civilian workers as well. 

Unlike the recession of the early 1980s, the current downturn has seen a drastic decrease in total employment.  Although not technically a depression, we can say that this “past” recession was (and is) the mother of all recessions so far.

The graphs above are courtesy of the research division at the St. Louis branch of the Federal Reserve and are available quite easily to the general public.

The Money Pot

On Dec. 1st, the bipartisan National Commission on Fiscal Responsibility and Reform (Debt Commission) will hold its sixth meeting to hammer out a series of proposals to reduce both the deficit and debt of this country.  Deficit refers to the current year’s budget imbalance, while debt is the sum of each year’s deficit.  You can watch previous meetings here.

Earlier in November the two co-chairs presented a draft proposal which distributes the pain of both budget cuts and higher taxes in an equitable fashion.  Of course, any constituency who suffers from the cuts or has to pay the higher taxes will not like a particular proposal – a NIMBY syndrome that has infected this country.

Why bother planning for the future?  Why not just wait till things get really bad and we have a Treasury Bond crisis, where other countries start selling their holdings of this country’s debt and the government has to pay high interest rates just to get anyone to buy the debt?  Ireland and Greece have tried that method and it has gotten ugly as each of those governments has had to make severe reductions in social security pensions and other benefits.  By planning ahead, we can make more gradual reductions but regardless of what we do, we will be reducing benefits and raising taxes.  Elected politicians of both parties have been making promises, and “bringing home the bacon” to their constituents for several decades.  They have done this by spending the social security taxes – essentially making it a flat tax for the general fund – that the large numbers of “boomers” have been paying in.  The boomers are nearing retirement age.

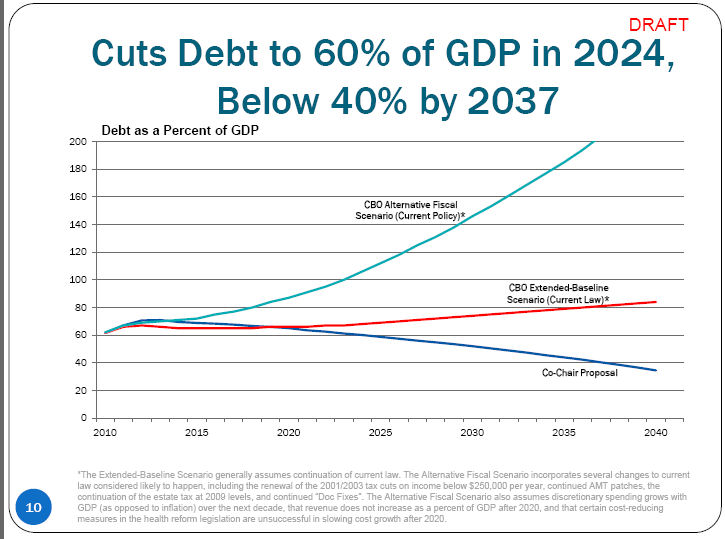
Here is the Congressional Budget Office (CBO) projection of this country’s debt and the effect of the Debt Commission’s proposals on the debt. (Click to enlarge in separate tab)

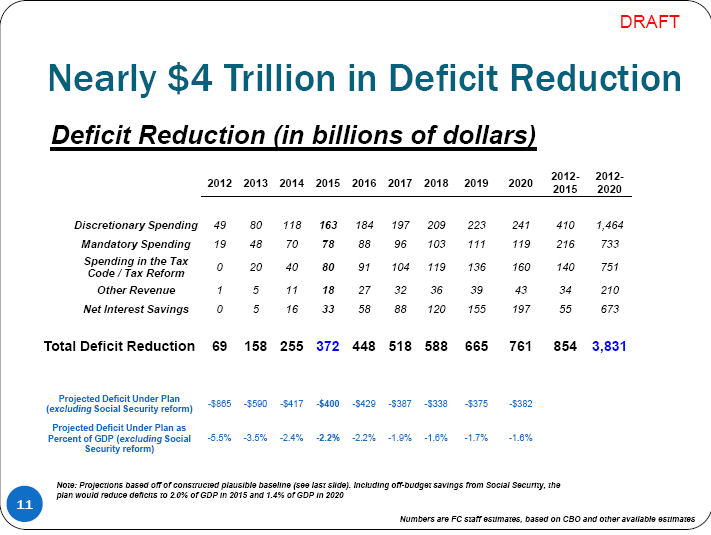
Here is a summary of the proposals, excluding any Social Security reforms.

As people are living longer, it makes sense to consider raising the full retirement age.  But this recent report by the Government Accountability Office (GAO) shows that such a seemingly simple solution has consequences that I had not considered.  They found that a quarter of the pre-retirement aged population had some work limiting condition and that two thirds of them work a physically demanding job.  The GAO thus anticipates a rise in disability, unemployment, food stamp, Medicaid and other benefit claims as this older population is unable to find work that they can reasonably perform.  The percentage of work restricted workers would only grow as we raise the retirement age.  The more sensible and fair solution is to reduce benefits and eliminate the early retirement option introduced in the 1960s.

When the Social Security system was enacted in the mid thirties, life expectancy for a 60 year old worker was 72.  (Bureau of Labor Statistics Monthly Labor Review, pg. 4)  In 2006, the Census Bureau estimated life expectancy for a 60 year old at 82, an additional ten years of life – and retirement benefits.

It is going to take character for many politicians to take on Social Security reform but it must be done if we are to get our financial house in order.  The last time the system was reformed was in 1983, when Democrats held a sizeable majority in the House and Republicans controlled the Senate.  The full retirement age was raised to 67 on a sliding scale and the payroll tax was increased.  Since then we have seen that increasing the payroll tax is but a flat tax, an excuse for our elected representatives to spend ever more money that they don’t have.  Any increase in payroll taxes would have to be accompanied by a complete divorce of the Social Security trust fund and the general revenue fund of this country. 

To hide the cost of the Vietnam war, President Johnson in the late sixties instituted the “unified budget” so the Federal government could take in payroll tax revenues, put them in the general fund, issue paper IOUs and spend the money on the war without arousing public anger.  Ever since, politicians have been hiding the size of real budget deficits.  Even when this country last had a “surplus” in the Clinton years, it was only a surplus because of the huge Social Security surplus.  The real budget ran a deficit.

Will we grow up, wake up and take some responsibility or will we continue to keep thrusting our hands into the Federal pot of money, trying to get as much as we can?  For too many years we have behaved as shoppers did last Friday morning at a Wal-Mart in Honolulu, pushing and shoving to get the best deal, then trying to take deals away from other people when there were no more to be had.

Foreclosure or Not so sure?

Anyone about to put a contract on a house today, particularly those in foreclosure, should check with a title company to see if there is any problem getting title insurance on the proposed property.  During the process of packaging and repackaging mortgages into securities called mortgage backed securities (MBS), some banks and mortgage servicers may have lost the paperwork that proves that they have a claim on the property.  

In a recent NY Times article veteran business reporter Gretchen Morgenson relates the recent legal challenges to some bank foreclosures in bankruptcy courts.  In some cases the trustee judges who oversee bankruptcies have concurred that the bank trying to foreclose does not have a proper “chain of title.”

Some in the banking industry dismiss these claims as isolated instances but there are whispers that the “chain of title” issue could grow enormously if courts reverse their long standing partiality toward banks and use the same burden of proof standard that they have long taken with homeowners.

QE2

No, it’s not the Queen Elizabeth, either the person or the ship.  It’s Quantitative Easing, a label for the Federal Reserve’s program to print money.  Matt sent me a link to a funny – and ironically sad – video that explains this phenomenon.

Asset Bubbles

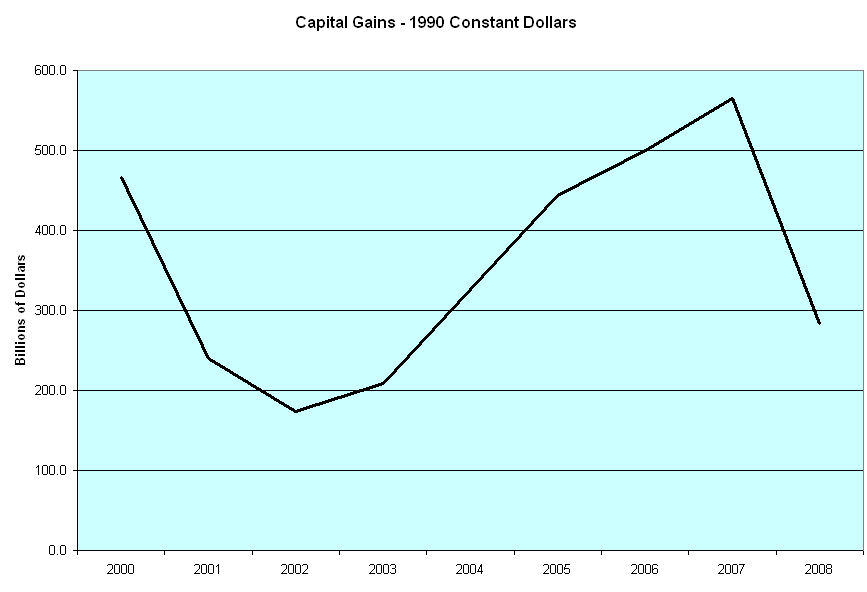
Earlier today, I examined the twin problem of spending and revenue.  What about that “hump” in revenue for the years 2004 to 2008?  Was it the Bush tax cuts?  Politicians drinking the Republican juice often repeat the mantra that tax cuts produce more revenue.  If only it were true.  The revenue hump consists chiefly of the taxes from capital gains that occurs during any asset bubble.  We had a similar spike in capital gains taxes during the stock market bubble of the late nineties.  Below is a chart of IRS data of capital gains reported during the past decade. 

As the Federal Reserve continues its stimulus attempts to revive demand by pumping money into bonds and lowering the value of the dollar, it drives up asset prices like stocks.  When investors sell those assets which are in non-tax sheltered accounts, the sale often generates a capital gain which generates revenue for the Treasury.

Voters have conflicting views of the Obama stimulus program initiated in the spring of 2009.  However, it is the Federal Reserve that has pumped in double the total amount (some of it not spent yet) of Obama’s stimulus program and most of that amount was put in before Obama took office.  Here’s a quick chart of the balance sheet of the Federal Reserve.  Click on the “All” tab on the second chart.  Good thing that the Federal Reserve members do not have to run for Congress.

Twin Horns of an Angry Bull

On Fox News Sunday today, Eric Cantor, the current Republican whip and projected majority leader in the next Congress, stated that “we do not have a revenue problem. We have a spending problem.”

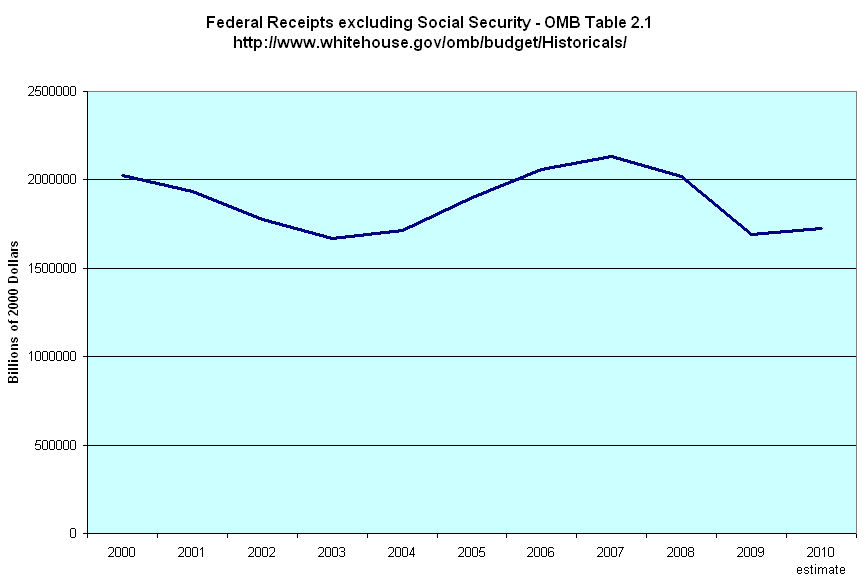
Below is a 10 year chart of Federal Revenues, excluding Social Security taxes (Source). Using CPI adjustment factors from the Bureau of Labor Statistics, I have shown revenues in constant 2000 dollars, or real dollars. Mr. Cantor does not think this is a “revenue problem.” I would not want Mr. Cantor as my accountant. (Click to enlarge in separate tab)

The real picture is that we have BOTH a revenue problem and a spending problem.

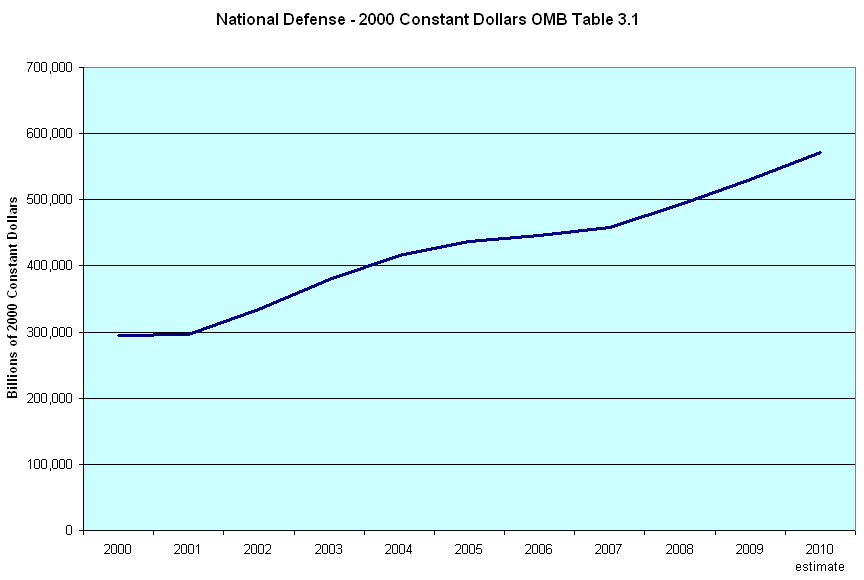
Below is a chart of defense spending in the past 10 years. In real dollars, it has almost doubled.

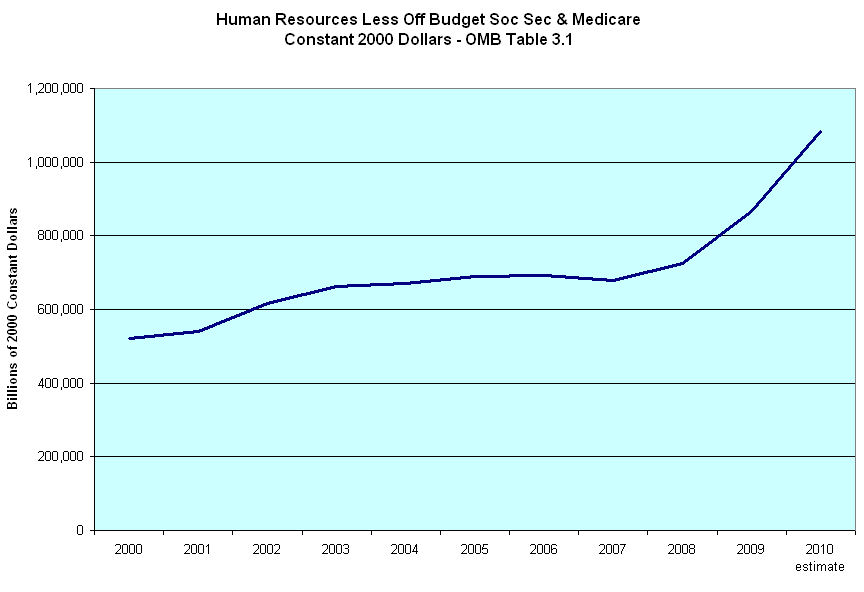
Next is a chart of human resource spending. I have excluded most of Social Security and Medicare. It has more than doubled in the past ten years.

Let’s imagine that you and your family were sitting at the kitchen table looking at similar charts of your finances. Your family income is about the same as it was 8 years ago yet your chief expenses have doubled. It’s obvious that your family will have to cut spending. It is also clear that you are going to have to find a way to bring in more money. Now imagine the budget fight when you suggest that you are going to cancel the data plan for your teenage daughter’s cell phone. How will you feel when your spouse suggests selling the newer model car you drive to work and buying an older compact car? What is your spouse’s reaction when you suggest that he or she deliver pizzas at night after work? These are tough discussions at the kitchen table or in the halls of Congress. 

Behind The Mortgage Curtain

For those of you who would like a peek into the mortgage paperwork mess that the news media has called “robo-signing”, check out a seven page article in this week’s Bloomberg Business Week.  In a well written narrative, three reporters provide both a macro view of the mortgage and foreclosure machinery situation as well as some stories of individuals who have faced the madness.

Regulation Riddle

I’ll continue my look at favorite myths of both the left and right. This week it’s the right’s turn.

A familiar myth of conservatives is that over-regulation led to the decline of manufacturing in the U.S. Is this true? While labor and environmental regulations in a well developed country like the U.S. may play some part in the total cost of a manufactured good, they are not the only costs. Below is a chart from the Bureau of Labor Statistics showing a comparison of labor costs in the U.S., China, Mexico and a few other areas.(Click to see larger image in separate tab)

As we can see, Chinese manufacturing companies have a huge advantage in this area. There are few labor regulations and those regulations which are in place are loosely enforced. The U.S. would have to abolish almost all of its labor regulations regarding minimum wage, overtime, Social Security, Unemployment insurance and Workmen’s Compensation and they still would not be competitive with China. Chinese manufacturing plants enjoy a host of other competitive advantages, according to Manufacturing News: many do not have to pay for the land their factories are built on; many companies do not pay income taxes, property taxes or value-added taxes. In rural areas, manufacturing plants pay only enough to compete with the small, if any, compensation that an overworked person can make in subsistence farming. Parts of Mexico enjoy the same advantages. If minimum wage laws were abolished in the U.S., would you take an assembly job for $2.60? If so, then we could stay competitive with Mexico and China.

How much manufacturing have we lost over the past two decades?  According to the Small Business Administration (SBA), there were almost 28 million private businesses in the U.S. in 2007. 22 million were what are called non-employer firms, i.e. businesses that report no employees.  These would include people who work for themselves as sole proprietors or Subchapter S corporations. In 1988, 6.5% of private employer businesses were classified as manufacturing and they accounted for  22% of private employment.  In 2007, only 4.7% of businesses were classified as manufacturing, accounting for 11% of private employment.  If we had the same percentage of employment in manufacturing that we did in 1988, we would have approximately 13 million more people employed.  The Bureau of Labor Statistics (BLS) reports  that the number of unemployed was 14.8 million in September.

There is no magic formula that will enable us to compete in manufacturing and assembly industries which can produce with low cost, marginally educated labor.  The edge we have and must maximize over newly industrializing nations must be a more educated workforce, one which can command the higher precision and more complicated manufacturing industries.  Improving educational standards is a multi-decade commitment of dollars and community.

So why do conservatives consistently trumpet regulations as the chief cause of the decline of manufacturing jobs in this country? Because it gives them a justification for policies to reduce the existing labor and environmental regulations. Conservatives know that, if they advocated abolishment of many or all of these regulations in order to be competitive, most of the voters would turn away from them in disgust. So they promise that some reasonable reduction in regulations will make a big difference, hoping that the voters will buy the argument on its plausibility without checking the facts.