October 26, 2014
Shortly after Monday morning’s sunrise, George sat on the back deck, coffee in hand. Some brilliant, utterly mad painter rushed around the neighborhood, dabbing the trees with what seemed like the entire palette of warm colors. Armies of invisible elves set up accent lights in the branches, highlighting the hues of rust-orange-yellow-gold. As George absorbed the movie magic moment, a van from the local cable company pulled up on the grass alleyway behind the backyard fence. “Starting early,” George thought as he glanced at this watch. 7:30.
He opened the backyard gate to the alley, meaning to ask the service guy if repairs on the pole would interrupt his and Mabel’s service this morning. A guy who looked too trim, too neat, and too fit to be a repairman opened the passenger door of the van and called out to him, “Sir, stay inside the yard.” George took a step backward and looked up above. Was there a loose wire or something dangerous? Cable wire carried low voltage so what could be the problem? He glanced back at the man and the van.
From the rear of the van, two men hopped out. Like the guy in front, they were both dressed in black windbreakers over blue polo shirts, black slacks. It was like a SWAT team of rugged fashion models. One of the men came to the rear gate. George stepped back another step. The man scanned the yard to the left and right of George, looked past George at the rear of the house. George noticed that the other two men scanned the alley, the nearby houses. The man at the gate glanced at a phone in the palm of his hand, then looked at George. “George Liscomb?” he asked in the commanding tone of one who routinely asks questions and expects answers. George nodded. “Is there a Mabel Liscomb living here?” George nodded again. “Is she here?” Another nod. “Your wife?” One more nod. “Any other residents inside the house?” George shook his head. The man turned his head sideways, keeping one eye on George. “Bravo,” he called to the two other men.
From the side door another man emerged, dressed much like the others. George felt a numbness inside like he was on a movie set. “Move back a few feet, please.” Finally a slim figure emerged from the side of the van. The ears were the dead giveaway. George forgot that he was still holding his coffee cup as he instinctively jerked his hand to his face. The coffee cup clipped his lower jaw. “Ouhhhhh,” George barked. The sudden grunt drew everyone’s gaze. “You OK?” President Obama called out to him. The lukewarm coffee had spilled on George’s shirt but he was hardly mindful. “Uh, yeh,” George replied.
Like four points of a compass, the four men surrounded the President as the group seemed to flow through the backyard gate. The front man stood aside and the President held out his hand to George. “Great morning here in Denver, isn’t it,” the President said, an upbeat easygoing smile on his face. George paused briefly to figure out the coffee cup thing. He put the coffee cup in his left hand then held out his right hand to shake the President’s hand. What does one say to the President, George wondered. “Good morning, President.” Ok, that worked. “George, is it?” the President asked? “Yeh,” George replied in a monotone. “I was wondering if Mabel – that’s your wife? – is she here? Is she available?” “Uh, yeh,” George replied, “she’s in the living room.” “May we go in?” the President asked politely. “Uh, sure.” George had barely drunk his first coffee before spilling it. Maybe that’s why his brain seemed to be stuck in monosyllabic mode.
The front man strode to the house. “Maybe George should go with you and we’ll wait a moment on the deck,” the President called out. George joined the man, who opened the rear door and glanced inside before allowing George to go through the doorway. “Hey, Mabel,” George called out. “Are you decent? We’ve got company.” He could hear her get up from her easy chair. “Be right there,” she called back. She appeared at the far end of the kitchen, saw the man next to George and asked, “What’s the matter, dear?” “You’re not going to believe this,” George replied. Already the man was moving toward Mabel. George forewarned her. “This guy needs to ask you a few questions.”
The man went through the same procedure with Mabel. She answered curtly as though she were about to throw this impudent intruder out of her house. “You have a holstered weapon. Are you with the police?” she asked after answering the first two questions. From a few incidents at the high school, she recognized the bulge at the man’s side. “Secret Service, ma’am,” the man answered. “Secret what?” Mabel asked and the man opened his windbreaker enough to see the ID badge hanging from his neck. She looked past the man and spoke to George, “What the hell is going on, George?” He could tell she was upset. “It’s OK, just answer the questions,” George called back to her. No, there was no one in the house. Yes, she was Mabel Liscomb. She leveled her gaze directly at the man when he asked her birthdate. She responded quickly but in a slightly menacing tone. “You have the audacity to ask me to identify myself in my own home!” Then the man’s voice softened as though he were an actual human being. “Sorry, ma’am. Have to do my job.” He stepped back to where George stood at the rear door. The man opened the screen door and nodded, “It’s allright.”
George joined Mabel in the kitchen as the group on the deck flowed through the rear doorway, keeping the President protected. “Mrs. Liscomb,” the President greeted her with a warm smile, “good to meet you. You wrote me a letter a few months back, didn’t you.” Mabel stuttered. Had he ever hear Mabel stutter, George wondered. “I-I-I-I-did I? I can’t muh-member,” Mabel answered. “You had some good ideas that I’d like to talk to you about, if you have time?” Mabel nodded. George could see that she was recovering quickly from her shock. She was good at that. The habits of a high school principal asserted themselves and Mabel told the President, “I’m flattered that you are interested, of course. Why couldn’t your staff make an appointment?” Geez, George thought, she’s using the command voice with the damn President of the U.S. He noticed that each member of the security detail had moved to a window. George glanced to his right and saw that one had gone into the living room. The fourth guy – had he gone up the stairs to check the bedrooms?
“I was supposed to be golfing with your Senator Udall but he had to cancel,” the President explained. “I offered to appear at a fundraiser with Diana DeGette but her staff said she’d have to get back to us. I don’t seem to be too popular for this election.” Mabel made a brushing gesture. “Don’t worry about it. Same thing happened to Eisenhower ,Reagan and Bush at the midterm of their second terms,” Mabel told him. “With a recession still going on, Mamie Eisenhower was a lot more popular on the political circuit leading up to the ’58 mid-terms.” “Oh, Michelle is on everyone’s dance ticket,” the President replied. “Me, not so much. The quarterback takes the blame when things go wrong. When things go right, it’s the offensive line that gets the credit. Just part of the game, I suppose.”
“Well, come on in and sit down,” Mabel turned toward the living room. In a brief exchange, Mabel and the President had become buddies of a sort. George still wasn’t sure how it happened but each of them had recognized something in the other that they both had in common. Mabel sat down in her favorite chair, then motioned the President to sit on the couch nearby. She turned to George and said, “Do you want to make some coffee? I think I took the last of the first pot.” George nodded. “Yeh, I haven’t even had my first cup.”
The President was different in person. When interviewed on 60 Minutes, he had showed a casual aloofness that George didn’t like. The folded legs, the studied composure didn’t ring true for George. Now, here in this living room, he sat, legs unfolded, leaning slightly forward in an attentive pose, earnestly having a conversation with Mabel.
For the next hour Mabel discussed education policies with the President. She didn’t like the implementation of educational standards. Yes, she understood the desire for uniformity. No federal department can understand local educational needs. Too much politics in education already. Washington makes it worse. “How did you come to read my letter?” she asked. “Kind of a mistake,” the President replied. “It should have gone to Arne’s people but it got in my pile by mistake. I left it on the table and Michelle saw it. She told me, ‘you need to hear this. This woman’s been there her whole life. She understands. You’re not hearing this in Washington.’ And, to tell you the truth, it’s just been sitting in the policy pile for months. The first thing I found out as President – probably every President faces this quickly – is that there is never enough time to get to everything on his plate.”
George stayed out of the living room for much of the time, preferring to give Mabel the opportunity to discuss her ideas with the President. He actually served coffee to the President. The kids wouldn’t believe it when they told them. There was a woman out on the deck, talking into the air. “Do you want some coffee,” George asked. Had she been there all along? “No, thanks. You’re Mr. Liscomb?” she asked. “George,” George nodded. “Sherry, personal assistant,” she shook his hand. George started to invite her in but she held up her hand and started talking to the air again.
After too short a time, the assistant came in, excused herself, leaned over and whispered something in the President’s ear. The President stood up. “I’ll have to go. It was wonderful meeting you and talking with you, Mrs. Liscomb,” he said and bowed slightly. Mabel rose up from her chair, “A great pleasure, Mr. President, and thank you for your insights,” Mabel responded and – you gotta be kidding me, George thought – did a slight curtsy. The President laughed. George shook hands with the President, then they were gone. “Holy mackeral,” George said as he sat down on the couch. “I’m sitting in the same seat as the President of the United States. It’s still warm.” Mabel gave him a look. “Oh, damn!” George remembered. “We forgot to take a picture!” They both laughed. George ran out on the back deck, hoping that they had not driven away yet but the van was gone. The story of a lifetime and no picture to prove it.
Then George remembered that he had hit the buy button the past Friday. He sat down at the computer. The market had opened up that morning slightly lower but several earnings reports were positive. Apple and IBM were scheduled to announce earnings after the close. Later that day, Apple’s earnings and sales were above consensus estimates. To offset Apple’s upbeat numbers, IBM announced a chilling quarterly report. For the 10th consecutive quarter, revenue at the technology giant had declined. The death blow: earnings for 2014 were projected to be less than 2013’s earnings, something that hadn’t happened since 2002. This stalwart of so many institutional portfolios was continuing to stumble. If September’s Existing Home Sales, due to be released the following morning, declined any further, Tuesday could be a seriously down day.
George woke up again before sunrise on Tuesday. Mabel was already awake as usual. Thankfully, sales of existing homes showed a bounce back in September to an annual pace of close to 5.2 million homes, the benchmark for a healthy churn.

George checked earnings stats at Zacks. Before the opening bell, the staffing giant Manpower, announced better than expected earnings. Although sales declined in some areas, McDonald’s earnings were 10% more than expectations. Aircraft giant Northrup Grumman reported better than expected earnings as well. Yahoo reported earnings that were more than double the consensus. Most of the extra profits came from the sale of shares that it owned in Alibaba’s IPO. The market opened up sharply, closing the day with a 2% gain. Their son, Robbie, called that evening and they told him all about the visit from the President. “How many pics did you get? You should put them up on Facebook,” he told them. “We forgot,” George informed Robbie. “Daaaad,” came the exasperated reply. “Well, we’re old people. We’re not used to recording every event in our lives, I guess.”
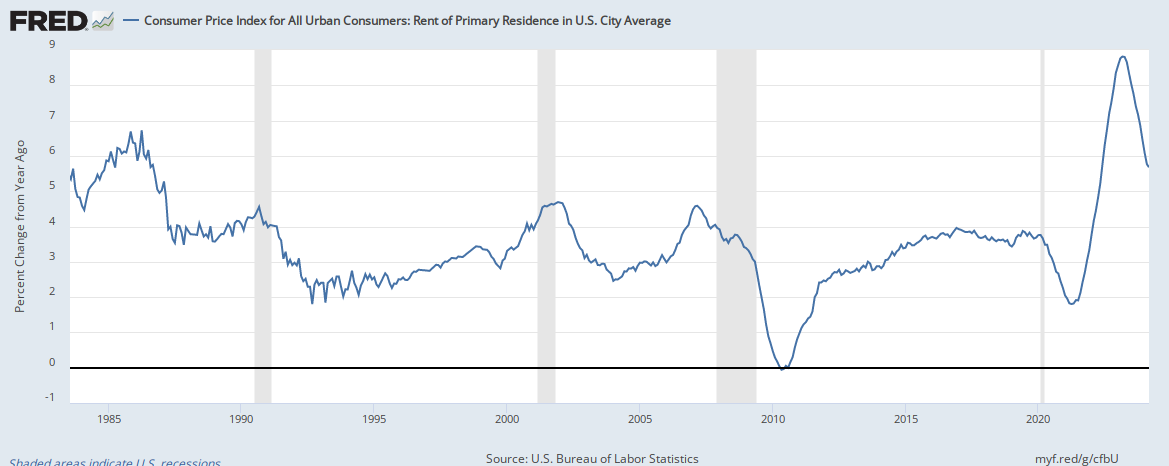
On Wednesday, the Bureau of Labor Statistics announced that inflation had grown 1.7% in the past year, in line with expectations. The Federal government closes its fiscal year at the end of each September. Each October, the Social Security Administration sets the inflation adjustment to Social Security checks for the coming calendar year. A 1.7% increase meant an average $20 increase in monthly benefits. For too many seniors depending on Social Security as their primary source of income, the low annual increases in payments did not keep up with increases in drug and food costs. Retired folks on the lower rungs of the economic ladder then had to apply for food stamps to make up for the low yearly increases in benefits.
Dow Chemical surprised to the upside as did industrial manufacturers Graco and General Dynamics. The positive mood on Wall Street was interrupted by the news of an attack on the Canadian Parliament. George was cleaning leaves out of the front gutter when Mabel opened the door to tell him the news. The market reacted negatively to the news but did not give up all of Tuesday’s gains, a positive sign.
On Thursday, the BLS reported that new claims for unemployment had risen slightly the previous week but that the four week average had fallen to the lowest level in 14 years. Positive earnings reports from 3M and Caterpillar, both of whom had a large international customer base, propelled the market higher, trading above the range of Tuesday’s rally.
On Friday, September’s new home sales of 467,000 were the best of the recovery. August’s robust sales figures were reduced by almost 50,000 to a revised 466,000, giving George a WTF frown. A 10% revision? The drug manufacturer Bristol Meyers and consumer giant Colgate reported higher than expected earnings. Ford surprised with significantly higher than expected earnings but the details in the report were not encouraging. Revenues in both North and South America had declined and Ford expected flat earnings growth for the full year. The market gained almost 1%. In the past seven trading days, it had gained back all the ground lost the six days prior, closing near the level of October 8th.
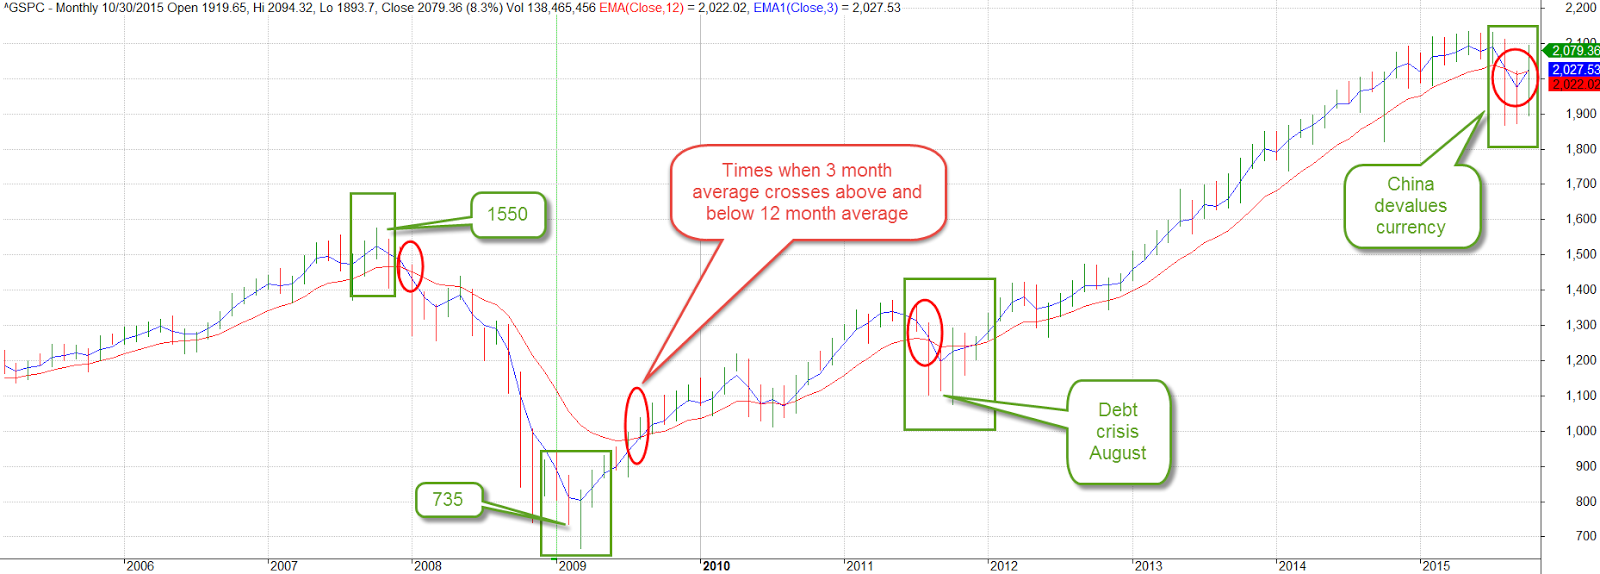
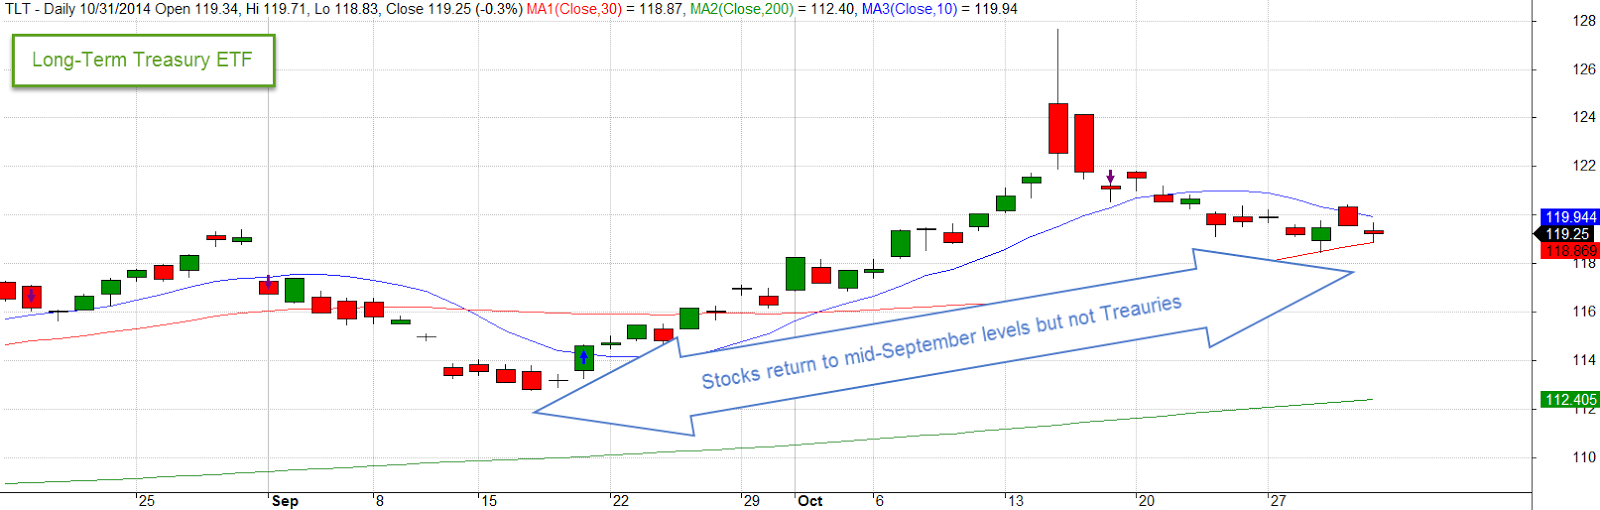
For 2-1/2 years, each decline had been followed by a sharp upturn. “Buying on the dip” had become a often used phrase. Anticipating a bounce with each dip, investors had been coming back into the market after a short decline. Since mid-September, investors who had bought in on the bounce had been disappointed when the market continued to decline.

Despite all the positive earnings reports, George was still concerned that stock valuations were just a bit on the high side. Earnings gains, as well as the growth in profit margins, were becoming slower. There had been two brief fallbacks in 2013, and already three fallbacks and a correction of more than 5% in 2014. Frequent small fallbacks were healthy for the market, shaking out excess optimism. The last real correction – a 10% decline in price – had last occurred in May 2012. The market of the mid-2000s had gone for several years without a 10% correction and that did not end well. George worried that the Feds low interest policy, kept in place for almost six years, gave investors too few choices and herded them into the riskier stock market. Gotta stay watchful, he thought.


