The Hunt, Part 2

July 22, 2018

by Steve Stofka

Last week, I showed the inputs to the credit constrained economy as a percent of GDP. I’ll put that up again here.

CreditGrowthFedSpendPctGDP

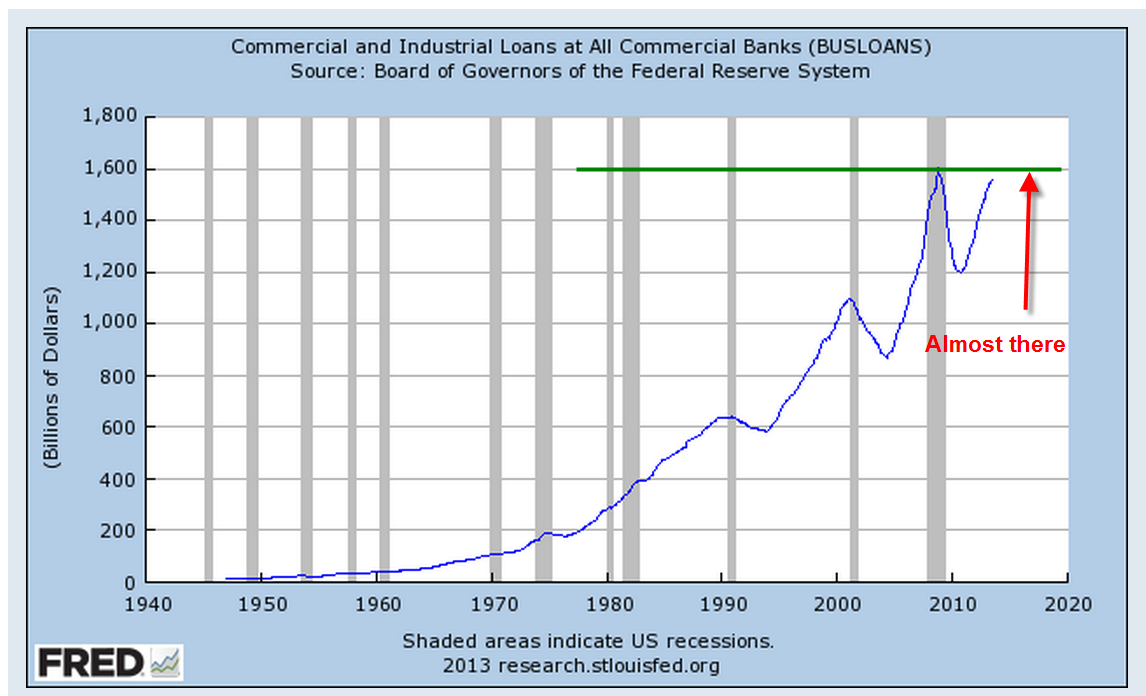
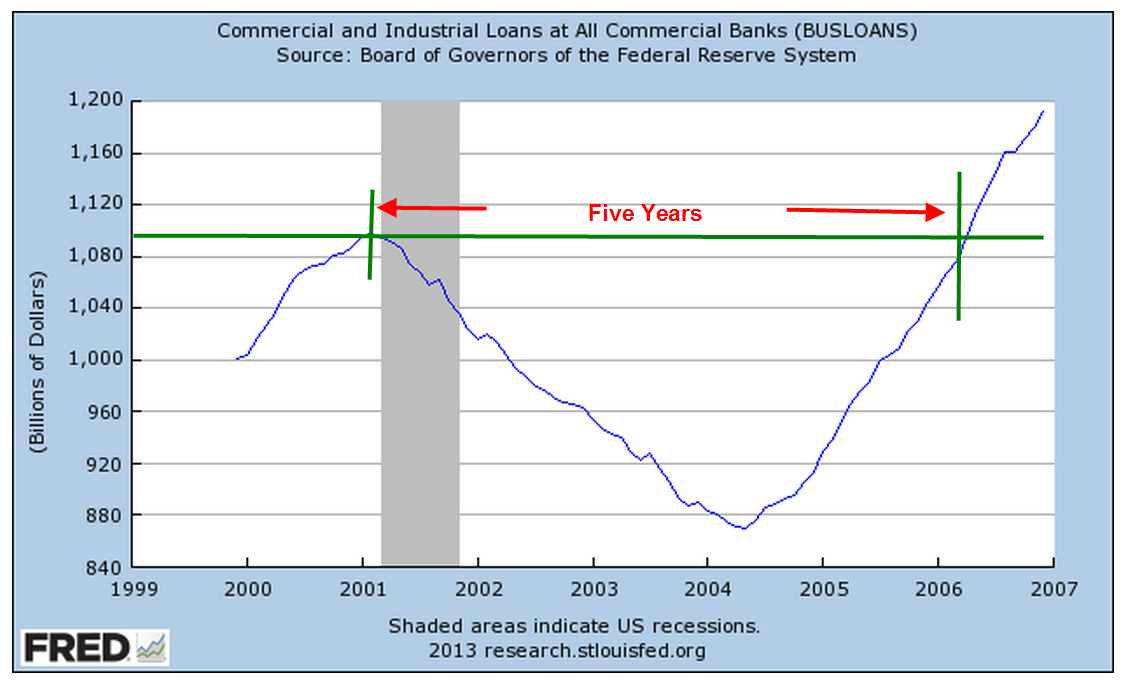
This week I’ll add in the drains but first let me review one of the inputs, bank loans. Focus your attention on that period just after 9/11, the left gray recession bar,  and the end of 2006, just to the left of the red box outlining the Great Recession on the right.  For those five years after 9/11, the banks doubled their loans to state and local governments, a surge of $1.4 trillion. The banks increased their household and mortgage lending by $5.3 trillion, or 67%. Why did banks act so foolishly? Former Fed chairman Alan Greenspan couldn’t answer that. We have a partial clue.

For 4-1/2 years after 9/11 and the dot-com bust, there was no growth in credit to businesses, a phenomenon unseen before in the data history since WW2. The banks reached out to households, as well as state and local governments because they needed the $1 trillion in loan business missing on the corporate side (#1 below).

There are four drains in the economic engine – Federal taxes, payments on loans, bad debts and the change in bank capital. State and local government taxes are not a drain because those government entities can not create credit. The change in bank capital reflects the changes in the banks’ loan leverage and their confidence in the economy. During the 1990s and 2010s the sum of the inputs and the drains remained within a tight range of about 1/7th of GDP.

InputLessDrains

The results of bad policy during the 2000s are shown clearly in the graph. In addition to the surge in bank loans, the Federal government went on a spending spree after 9/11. There was too much input and not enough drain. The reduction in taxes in 2001 and 2003 exacerbated the problem. There was less being drained out. Asset prices absorb policy mistakes until they don’t – a life lesson for all investors.

Let’s add in a second line to the graph – inflation. The rise and fall of inflation approximates the flows of this economic engine model with a lag time of several months. I’ve shown the peaks and troughs in each series.

InputLessDrainsVsPCE

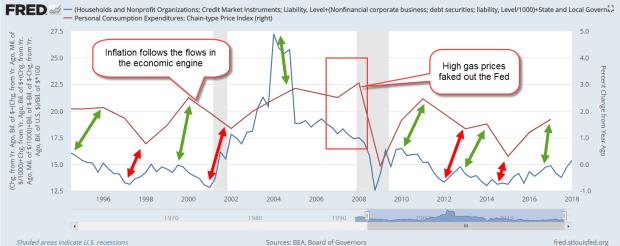
Look at that critical period from 2006 through 2007. The Fed kept raising rates in response to rising inflation (the red line), driven primarily by increases in the price of oil.  The Fed Funds rate peaked out at 5-1/4% in the summer of 2006 and stayed at that level for a year. The Fed misread the longer term inflation trend and contributed to the onset of the recession in late 2007. The net flows in the engine model (blue line) indicated that the long term trend of inflation was down, not up.

Where will inflation go next? Using last week’s theme, follow the hounds! Who are the hounds? The banks. The inflow of credit from the banks is the primary driver of inflation. Why has inflation in the past decade been low? Because credit growth has been low. Where will inflation go next? A gentle increase – see the slight incline of the blue line at the right of the graph. Contributing to that increase were last year’s tax cuts. Less money is being drained out of the engine.

Too much flow into the economic engine or an improper setting of interest rates – these mistakes are absorbed by assets, which are the reservoirs of the engine. Stocks, bonds and homes are the most commonly held assets and most likely to be mispriced. During the early to mid 2000s, the mistakes in input were so drastic that the financial crisis seems inevitable when we look in the rear view mirror. During the past eight years, the inputs and drains have remained steady, but interest rates have been set at an inappropriate level. Again, we can anticipate that asset prices have been absorbing the mistakes in policy.


//////////////////////////

1. In the last quarter of 2001, loans to non-financial corporate business totaled $2.9 trillion and had averaged 6%+ growth for the past decade. Anticipating that same growth would have implied a credit balance of $3.9 trillion by the end of 2006. The actual balance was $3.1 trillion.

Credit Patterns

July 28, 2013

Economic growth is hampered when credit growth declines.  In 2008, we experienced a sharp decline in confidence and lending that has only now reached the levels before the decline.

When we look at the big picture, we can see that we are now at more sustainable growth trends.

The amount of outstanding commercial and industrial loans is almost at the level last seen in 2008.

A smiliar slow recovery in business loans occurred during the 2001 recession.

Although housing evaluations have been rising, the amount of revolving equity lines of credit (HELOC) continues to decline.  The total outstanding is still high but approaching a more reasonable trendline of growth.

Recently rising bond yields have contributed to banks’  operating profit margins but the corresponding value of banks’ bond portfolios has fallen quite dramatically.

This decline in asset value affects bank capital ratios, which makes them less likely to increase their lending. which will be an impediment to economic growth.

This Wednesday the first estimate of 2nd quarter GDP will be released.  Real GDP growth is expected to be about 1.1%, less than the meager 1.8% growth of the 1st quarter.  Slowing growth may revive interest in bonds.  The recent sell off in bonds has probably been an over reaction incited by fears that the Federal Reserve will reduce its bond buying program dubbed “Quantitative Easing.”  While there are positive signs in the economy, they do not indicate any impending robust growth.

In addition to Wednesday’s release of GDP figures, the payroll firm ADP will show their monthly report of private employment growth, guesstimated to be slightly below the 188,000 gain predicted for June.  The BLS monthly labor report follows on Friday and will be watched closely.  Unemployment has been stuck in the mid-7% range since March and reductions in unemployment have been largely due to people either leaving the work force or taking part time jobs because they could not find full time work.

The Federal Reserve has said that its target for withdrawing its quantitative easing program is an unemployment target of 6.5%, with a caveat that inflation remains tame. A slow economy will naturally reduce inflationary pressures and improvements in the labor market are slowing as well.  In short, the Fed is likely to continue its monetary support for another year at least.

For a month now, the stock market has risen steadily in small increments, making up the losses that began in the third week of May.  Volume typically declines during summer months but this year’s volume of trading in SPY, the ETF that tracks the SP500 index, is 20% lower than this same time last year.  This week, we may see a market hesitation before the release of both the GDP and labor reports.

Small Business Lending

In a 5/5/09 WSJ article, Raymund Flandez focuses on the market for small business loans.

In February, 35% of new SBA loans of the most popular type were sold on the secondary market, up from 24% the previous month. Before the crisis in September 2008, 45% of these loans were sold on the secondary market.

At GovGex.com, where these loans are bundled and sold, bids for these loans have more than doubled since mid-March, when the Obama administration made a pledge to use $15B of taxpayer money to free up the secondary market in these loans. The government is guaranteeing as much as 90% of some loans. Before that pledge, the market for these loans had all but dried up, with volume totalling on $7.8M. Since then, volume has rocketed to over $67M.

Loan applications have more than tripled at Small Business Loan Exchange, an online marketplace which matches up borrowers with lenders.

Government Loan Solutions follows the SBA market closely and reports that the delinquency on the most popular SBA loan was 6.18%, the second highest rate in 10 years.

Mark To Market Debate

The tribe needs meat. The antelope, gazelle and wildebeest have already passed through your area on their annual migration so the easier game is gone. Off in the distance you and your buddies see a lone bull elephant, whose meat would feed the tribe abundantly well. The problem is that all you have for weapons are some sharpened sticks, some rocks, and some rock flakes tied to sticks. Big problem, and a big payoff if you can solve it.

Mark to market accounting is like that.

At a recent Future of Finance Initiative seminar sponsored by the WSJ, Stephen Schwarzman, head of the investment firm Blackstone Group, said “If [a bank] made a loan in the old world . . And you didn’t think it was impaired, you kept it on your books at par. Now, if loans are trading at $70 [per $100 and] you make that loan, you lose $30 just for making the loan.”

He concluded, “Even though there is a lot to be said for complete mark-to-market in a system that can take it, I don’t believe that the financial system, as currently organized with its current rules, can really take the full hit of it.”

Robert Shiller, professor of Economics at Yale U., countered with “The first thing is to make sure that we preserve the integrity of our accounting. People know that this country stands for high integrity, and so anything that looks like we’re allowing people to doctor the books, I think we shouldn’t do that.”