January 12, 2025
by Stephen Stofka
This is ninth in a series of debates on various issues. The debates are voiced by Abel, a Wilsonian with a faith that government can ameliorate social and economic injustices to improve society’s welfare, and Cain, who believes that individual autonomy, the free market and the price system promote the greatest good.
After a few pleasantries, Abel began, “Last week, we finished talking about the government’s role in the social contract. The scope of that role is the key difference between your group and mine.”
Cain nodded. “Your group thinks of the federal government as an insurance company. Our group tries to keep your group in check. It’s not easy.”
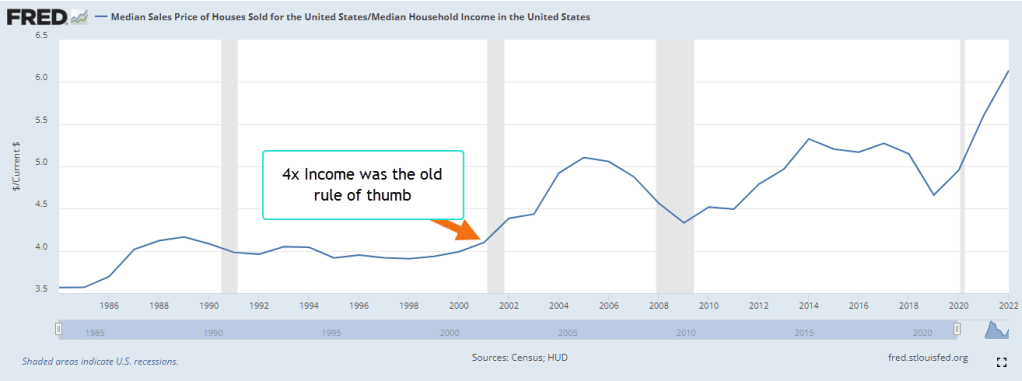
Abel replied, “Your group may believe in a more limited role for government as a general principle, but you advocate policies that contradict that principle. Take housing as an example. It is a private good that is heavily subsidized by the federal government.”
Cain tilted his head in an equivocating manner. “Let me stop you there. Are you asking whether our group supports federal underwriting of thirty-year mortgages? In principle, we shouldn’t. The federal government should have a minimal role in the exchange of private goods. As a practical matter, the entire housing market would collapse if the federal government did not underwrite most mortgages in the U.S.”
Abel interrupted, “But your group doesn’t support the federal government’s student loan program.”
Cain nodded, “That’s right. An education is a different type of good than a house. An education can’t be separated or alienated from a person. A house can. I would prefer that the federal government not be involved in the mortgage market, but few states have the resources to underwrite mortgages. Private banks prefer not to underwrite 30-year mortgages at low interest rates. Only the U.S. and tiny Denmark have 30-year mortgages at fixed interest rates (source).”
Abel said, “But the higher education market would collapse without federal student loans, grants and subsidies. That same practical reasoning supports the federal involvement in underwriting higher education loans.”
Cain shook his head. “Housing has a concrete public aspect to it. Education doesn’t. The Constitution specifies a role for the federal government. It is to provide for the ‘general welfare,’ not private welfare. An education is inseparable from a person’s private welfare.”
Abel objected, “But private welfare contributes to the general welfare. This is a sticking point between our two groups. Your group regards the general welfare as only those goods or services that are available to all. The sum of individual welfare is the general welfare.”
Cain replied, “Look, everyone who wants a subsidy claims that their private welfare will contribute to the public good. Car manufacturers want protective tariffs and subsidized loans, claiming that it will help preserve jobs. Ranchers want below market rates on grazing land for their catttle, claiming that they will be motivated to act as good stewards of that land and help preserve it. College students want subsidized loans and grants on the premise that their improved skills will contribute to a better society, a more productive work force.”
Abel argued, “But your group is more likely to support subsidies for ranchers and farmers.”
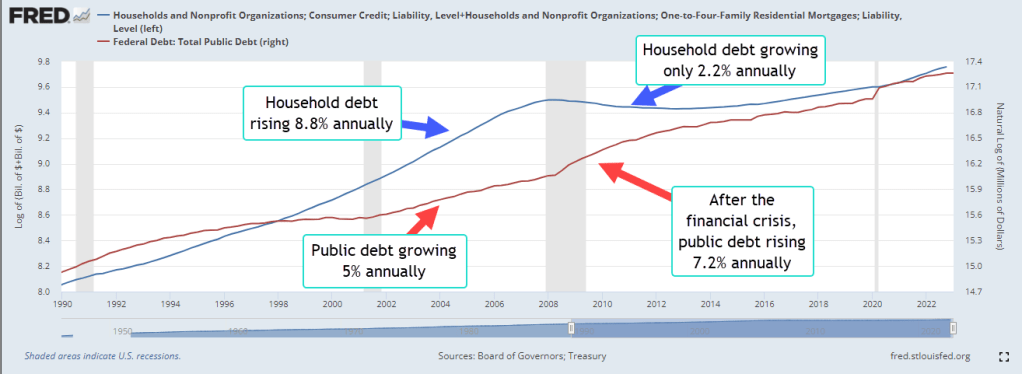
Cain shrugged. “The subsidy for grazing fees is about $100 million, according to one estimate. Americans have $7.5 trillion in federally backed mortgages at an interest rate that is at least 5% below market. That’s an indirect annual subsidy to homeowners of $350 billion, with a ‘b.’ Subsidies to farmers and ranchers are like drops in the bucket compared to the subsidies to homeowners. Divide that $350 billion by approximately 50 million federally backed mortgages and each mortgage holder gets an average annual subsidy of $7000. The federal government looks like it has deep pockets. Everyone wants to stick their hand in those pockets. It’s the road to ruin.”
Abel argued, “But the federal government has a long history of handing out subsidies. In the 19th century, they gave out vast tracts of western lands to the railroads for pennies an acre. After the tracks were built the railroads sold the land to developers for many times what the railroads paid. Then the developers sold the land for many times that to homesteaders. Subsidies are a tool of government.”
Cain interrupted, “Tools to achieve what? Policy goals. Who sets those policy goals? The politicians in Washington. What is their policy goal? To get re-elected. How do they get re-elected? By gettting subsidies of some sort for their constituents. What is the sum of those individual efforts by elected officials? A government whose main purpose is giving out subsidies. There has to be some principle in place to limit that kind of largesse.”
Abel asked, “So what? End all subsidies? That is not going to happen. America binds all these regional interests together by handing out subsidies to homeowners, students, farmers, ranchers, people of every business type. In an earlier era, Senate leaders inserted earmarks for those senators who held crucial votes. Former OMB director George Shultz quipped, ‘the budget process was a fight of the parts against the whole and the parts always won.’ (Behn 1977, 109).”
Cain interrupted, “That practice promoted increased spending and deficits. When the government borrows money, that increases the money supply and inflation. Then the Federal Reserve has to fight inflation by adjusting interest rates. Higher interest rates causes a drop in investment which can raise unemployment. There’s just a whole cascade of economic effects.”
Abel argued, “In 2006, John Boehner, the former Speaker of the House, ended all earmarks in the House. Have deficits decreased? No, they have gotten worse. So has the polarization in the Congress and in the country. The public is like a pack of hungry dogs. Give each of them a little bit of meat and they won’t tear each other apart.”
Cain shook his head. “Tell the voters on the campaign trail that they are a bunch of dogs. The problem with your group is a lack of respect for the public and way too much respect for politicians and experts.”
Abel conceded, “Ok, maybe the hungry dogs imagery wasn’t the best, but look at the defense industry. It wields a lot of influence on Capitol Hill and your group is a big supporter of defense contractors. Defense is one of the few legitimate constitutional duties of the federal government, you say. Each individual representative in Congress votes for more defense spending if it will mean more federal tax dollars coming into their state. Each representative competes for defense dollars even if it is wasteful. It’s pork barrel politics.”
Cain said, “The saying goes, ‘something that can’t last forever won’t.’ The country can’t keep running deficits and borrowing money from the private sector. The interest on that debt keeps getting larger every year. It’s unsustainable. Deficit spending is a security issue. If and when a large war breaks out, the country will not be able to muster a strong response.”
Abel nodded. “Our group agrees that deficit spending is a problem. Your group thinks that earmarks are a big part of the problem. We don’t. Pork barrel politics joins people together. All the different constituencies in the country gather together to pull one of two ends of the rope. What we need is higher taxes on upper income households to afford those earmarks.”
Cain shook his head. “Higher taxes reduces investment.”
Abel interrupted, “So your group says. During the 1990s, both taxes and investment increased. In fact, investment increased at the highest pace since World War 2, and we had budget surpluses by the time Clinton left office at the end of the decade. Higher taxes do not reduce investment.”
Cain argued, “Look, the birth of the internet and the computer age was a special case. That exception does not support your case.”
Abel smiled. “Taxes and the effect of taxes is a whole other discussion. See you next time.”
Cain nodded and turned to leave. “Until then.”
///////////////////
Photo by Anna Samoylova on Unsplash
A 2010 analysis by the Congressional Research Service found that few developed countries offer 30-year mortgages at fixed interest rates. https://crsreports.congress.gov/product/pdf/R/R41432/3
An analysis by the Center on Biological Diversity estimated an annual subsidy of $100 million to ranchers in below market rates for grazing fees. https://www.biologicaldiversity.org/programs/public_lands/grazing/pdfs/CostsAndConsequences_01-2015.pdf
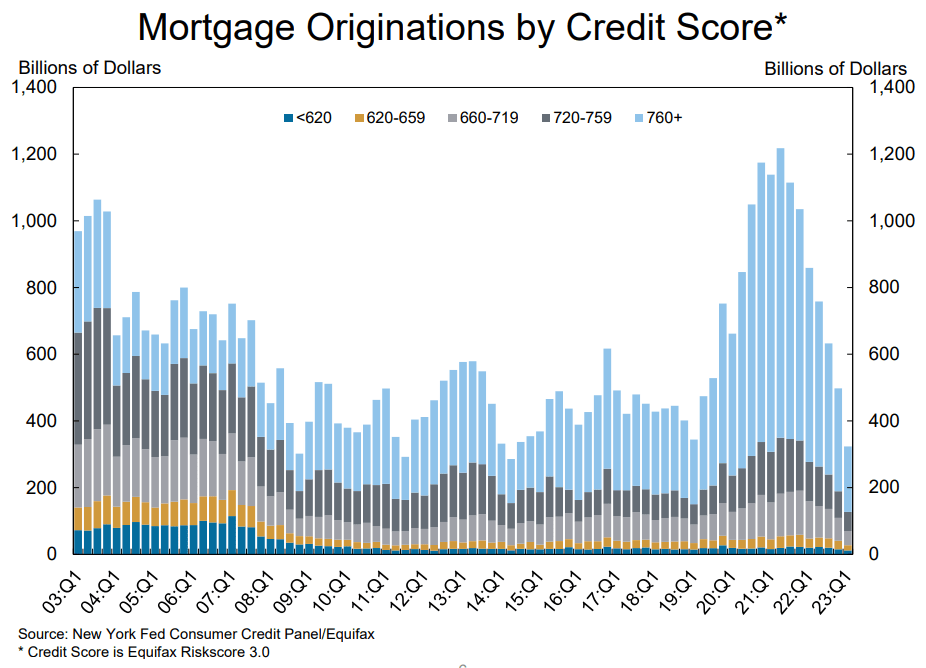
Federally backed mortgages rose from $707 billion in 2009 to $5 trillion in 2010 and have risen steadily since then. https://fred.stlouisfed.org/series/BOGZ1FL403065005Q
Behn, Richard. 1977. “The False Dawn of the Sunset Laws.” The Public Interest (Fall): 103-118. doi: https://www.nationalaffairs.com/public_interest/detail/the-false-dawn-of-the-sunset-laws.
The Federal deficit as a percent of GDP https://fred.stlouisfed.org/series/FYFSDFYGDP
Tevlin, S., & Whelan, K. (2000). Explaining the investment boom of the 1990s. SSRN Electronic Journal. https://doi.org/10.2139/ssrn.221415 In the seven-year period 1992-1998, investment growth averaged a record-breaking 11.2%. A copy of the paper can be found at https://www.federalreserve.gov/pubs/feds/2000/200011/200011pap.pdf