October 22, 2023
by Stephen Stofka
This week’s letter is about income and wealth distribution. I’ll take a look at a recent report on those topics through the lens of a perspective first proposed 70 years ago by a Nobel economist.
This past Wednesday the Federal Reserve released the triennial 2022 Survey of Consumer Finances, or SCF. Gains in household wealth (assets less liabilities) were much more widely distributed than gains in annual income. Real median household net worth increased 37% while its cousin, the mean or average, increased only 23%. Remember that these are percentage gains and percentages depend on the base, or divisor.

A $1 million net worth household with a gain of $200,000 in net worth experiences a 20% increase. A household starting from half that net worth, or $500,000, might have a gain of $150,000 which represents a 30% gain. The second household has experienced a smaller monetary gain but a higher percent gain.
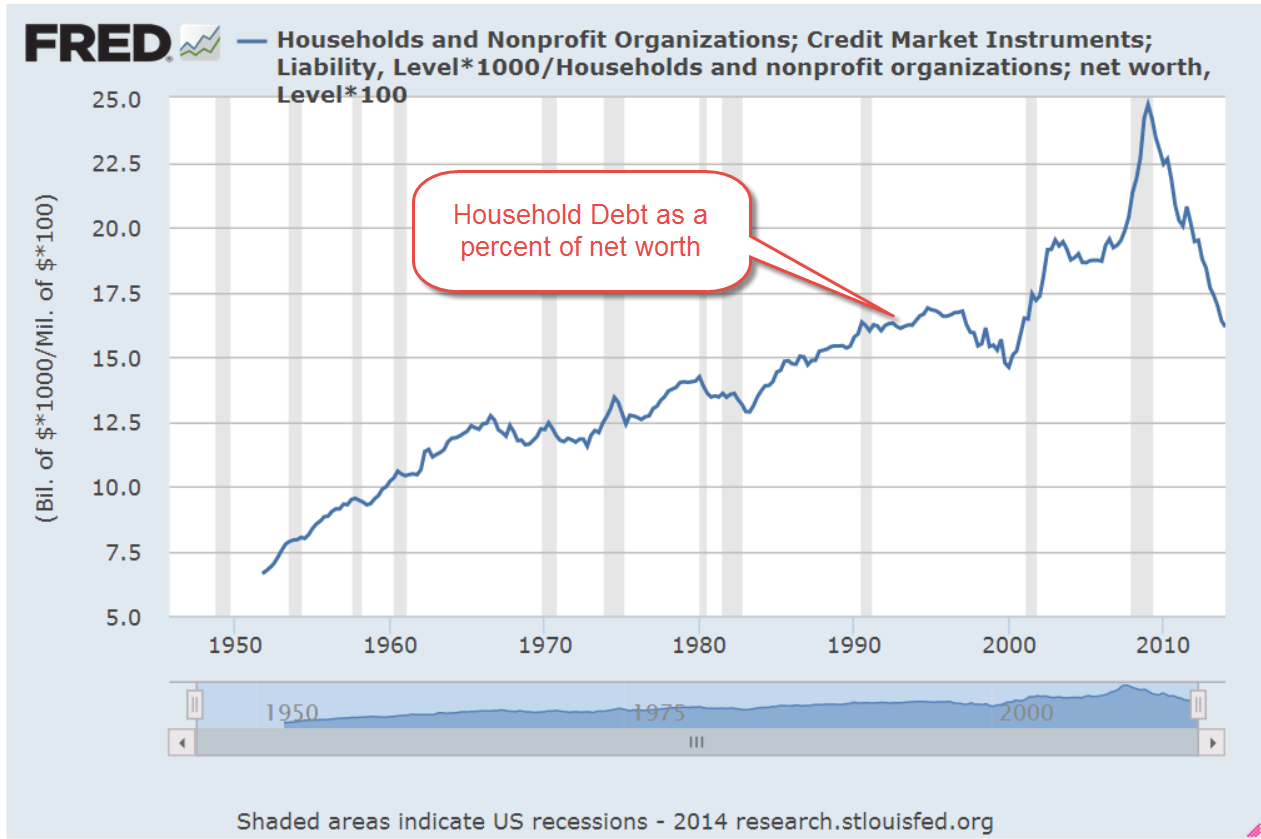
This recent Fed survey found that the median increase was higher than the mean increase, indicating that the increases in wealth were widely distributed. Government support programs during the pandemic helped households reduce their debt levels. Double digit increases in home prices raised the primary asset that is the cornerstone of household wealth. Median net housing values (appraisal value less outstanding mortgage) rose by 45% in the three years between surveys the report found. Gains in income, however, did not exhibit the same equanimity.
I’ll be mentioning top half and bottom half of households a lot in the next sections so I will just refer to them as the Uppers and Lowers. Income gains were not widely distributed. Real median household incomes rose by 1% in each of the three years, but real mean incomes rose by 5% annually. The income gains went to the Uppers and a college degree was a consistent characteristic of the Uppers. Our specialized workplace puts a premium on education. During the period 2019-2022, the retirement account balances of the Uppers rose while those of the Lowers fell.
Half of Upper households owned their own business but only 1 in 7 of Lower households did so. Let’s visit a paper written by Milton Friedman (1953) called Choice, Chance, and the Personal Distribution of Income. Remember those two words: choice and chance. Friedman remarked “every enterprise in our society is in part an arrangement to change the probability distribution of wealth” (p. 281). Large or small, a business owner takes risks to increase the chance of reaping more income. If an employer cannot sell what their employees produce, the employer’s profit is reduced or disappears entirely. Eventually that business goes out of business.
In his own imaginative way Friedman examined the relationship between employer and employee. An employer makes a profit from the work of an employee in return for the promise of a wage. To the employee, a wage reduces income uncertainty. Friedman reasoned that the calculation of a wage must include an implied premium like that of an insurance policy. Included in an employer’s profit is the price of an insurance policy that the employer sells the employee who desires income certainty.
Friedman pointed out that there is an element of preference in an employee’s decision to work for an employer. He challenged the simplicity of the conventional narrative that the Lowers had, by chance, lacked access to inherited wealth and natural endowments. Friedman constructed a more complex mechanism of income distribution that involved the choices that people made to reduce risk. Yes, those choices might be bounded by the resources available to a person. Their circumstances might induce a preference for certainty but it would be a mistake to disregard the choices that people made as they sought safety in their lives. Imagine a single woman who is the sole provider for two children. For the sake of her children, she needs the certainty of a wage income and is more likely to choose a steady paycheck from an employer rather than start up a business.
On a macro scale, Friedman pointed out that a society makes choices that make it more or less likely that individuals will prefer certainty. If more individuals choose the certainty of wages and there are fewer employers to provide that certainty, employees will be paying higher insurance premiums, i.e. lower wages, to employers in return for that certainty. That is a prediction conforming to the law of supply and demand. Inevitably that will lead to growing income inequality. To make that distribution more equal, a government will have to adopt redistributionist policies that tax employers, essentially stripping away part of the insurance premium and returning it to employees.
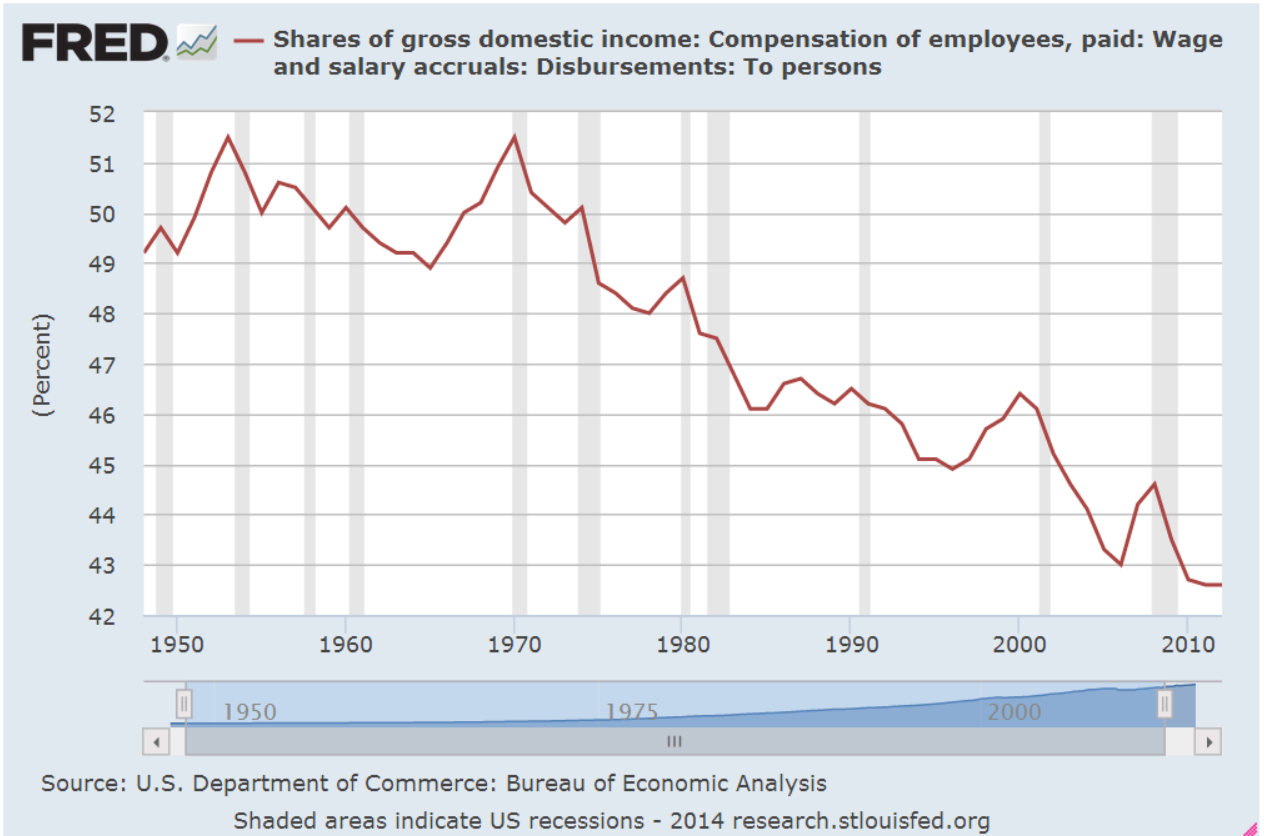
Changing mores and welfare policies in the 1960s supported individual independence but inadvertently promoted the growth of a vulnerable demographic. These were single head of households, mostly women, who would be less tolerant of uncertainty. While our society championed the new emphasis on personal freedom, many individuals were becoming less free in their economic circumstances and choosing the certainty of wages rather than risk the unpredictability of business profits. Since the late 1960s, income inequality has grown steadily.
If Friedman’s perspective had some predictive power, economic crisis and redistributive government policies should induce more people to desire certainty. That reach for safety should lead to a decrease in small business startups, enabling employers to pay lower wages to employees seeking income certainty. Does the data support Friedman’s hypothesis? I will look at historical SBA data for businesses with fewer than 20 employees to keep the analysis consistent (see Note). I will call them Smallees, or little small businesses. I will compare the ratio of such businesses to the number of employees in the country.
In 1988, there were 4.4 million Smallees and 105.4 million employees, a ratio of 4.2 Smallees per 100 employees. In 2006, there were 5.4 million businesses and 136.4 million employees, resulting in a ratio of 4 businesses per 100 employees. Then came the financial crisis and a slow recovery. In 2019, the year before the pandemic, there were the same 5.4 million Smallees and an employee count of 150.8 million, a ratio of only 3.6 small businesses of this size per 100 employees. Perhaps Friedman had an insight into human behavior after all.
Friedman’s talent was his ability to communicate a change of perspective to his colleagues, his readers and the audiences of his popular lectures. He consistently focused on choices that people make in their personal lives and within the institutions where they work. Friedman concluded that “the foregoing analysis is exceedingly tentative and preliminary” (p. 289) and noted the faults in the simplified model he had presented. The implications of his thought experiment could have undermined a central assumption in neoclassical economics: that workers are paid the marginal product of their labor. More on that next week.
///////////////////
Photo by Alexander Schimmeck on Unsplash
Keywords: income, choice, chance, small business, income distribution, income inequality
SBA Note: The SBA’s definition of a small business varies with business revenue and number of employees. A micro business is generally one to four employees. Businesses with more than 100 employees is considered a medium business. A small business is in between. The agency used to track businesses with 20 – 49 employees and those with 50 – 49 employees as two distinct groups but now groups them together.
Friedman, M. (1953). Choice, chance, and the personal distribution of income. Journal of Political Economy, 61(4), 277–290. https://doi.org/10.1086/257390