July 13, 2014
Small Business
Optimism has been on the rise among small business owners surveyed monthly by the National Federal of Independent Businesses (NFIB). Anticipating a growing confidence, consensus estimates were for a reading of 97 to 98, topping May’s reading of 96.8. Tuesday’s disappointing report of 95 dampened spirits. The fallback was primarily in expectations for an improving economy. Mitigating that reversal of sentiment was a mildly positive uptick in hiring plans. The majority of job growth comes from small and medium sized companies.
*******************************
Job Openings and Labor Turnover Survey (JOLTS)
Speaking of job growth…There is a one month lag in the JOLTS report from the Bureau of Labor Statistics so this week’s report summarized May’s data. The number of job openings continues to climb as does the number of people who feel confident enough to voluntarily quit their job. Job openings have surpassed 2007 levels. If I were President, I would greet everyone with a hand shake and “Hi, job openings have surpassed 2007 levels. Nice to meet you.”
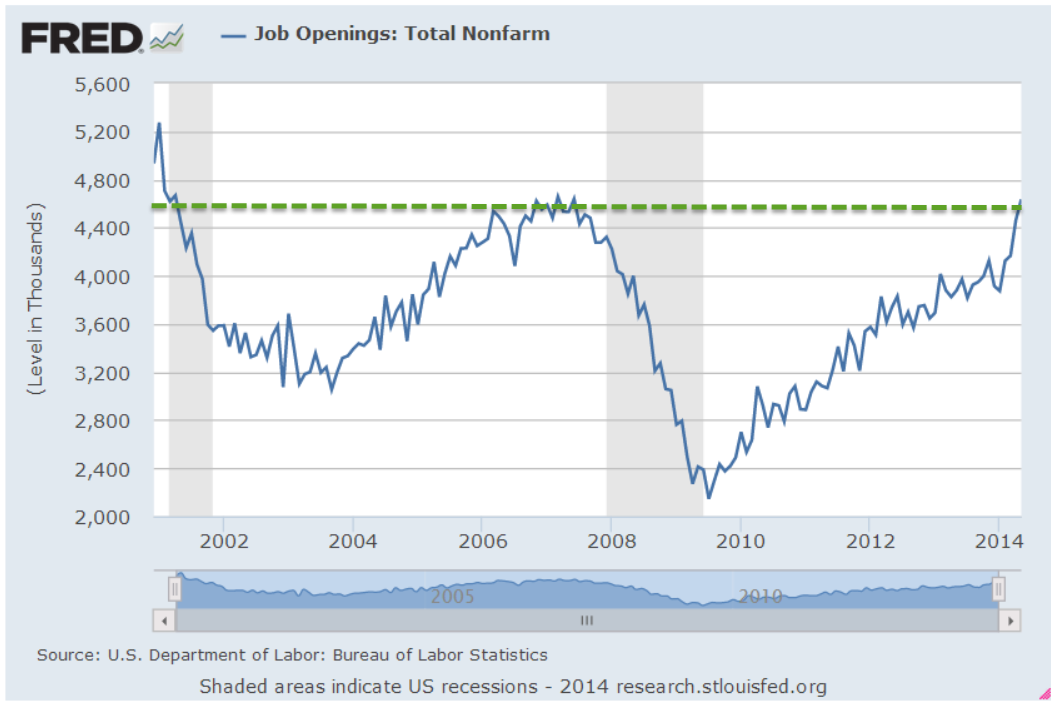
Still, the number of voluntary quits is barely above the low point of the early 2000s downturn. Let’s not mention that.

We can look at the number of job quits to unemployment, or the ratio of voluntary to involuntary unemployment. This metric reveals a certain level of confidence among workers as well as the availability of jobs. That confidence among workers is relatively low. The early 2000s look like a nirvana compared to the sentiment now. The country looks positively depressed using this metric.
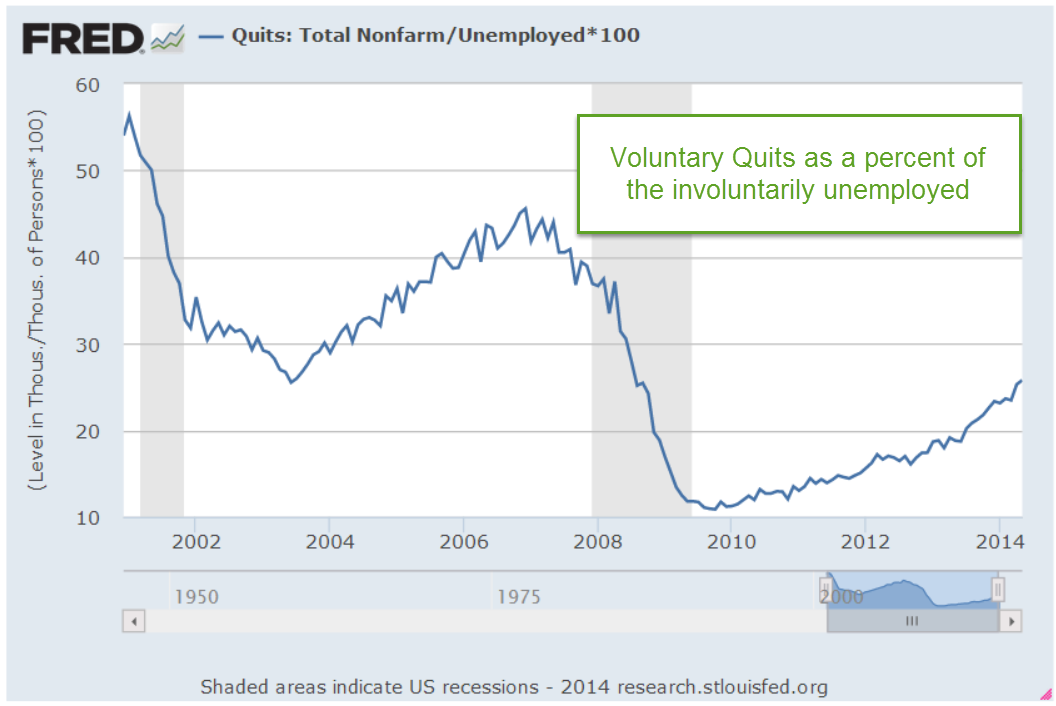
If I were President, if I were a Congressman or Senator, I would post this chart on the wall in my office and on the chambers of Congress where it would remind myself and every other person in that chamber that part of my job is to help that confidence level rise. Instead, most of our elected representatives are voicing or crafting a position on immigration ahead of the midterm elections. Washington is the site of the largest Punch and Judy show on earth. Like the little train, I will keep repeating to myself “I think I can, I think I can…stay optimistic.”
*******************************
Government Programs
Most social benefit programs are on autopilot, leaving Congress with little discretion in determining the amount of money that flows out of the U.S. Treasury. These programs include Social Security, Temporary Assistance to Needy Families, Food Stamps, Unemployment Benefits, etc. Enacted over the past eighty years, the ghosts of Congresses past are ever present in the many Federal agencies that administer these programs.
During the recent recession, payments under social programs shot up, consuming more than 70% of all revenues to the government. Political acrimony in this country switched into high gear as the U.S. government became the largest insurance agency in the world. As the economy improved, spending fell below the 60% threshold but has hovered around that level.
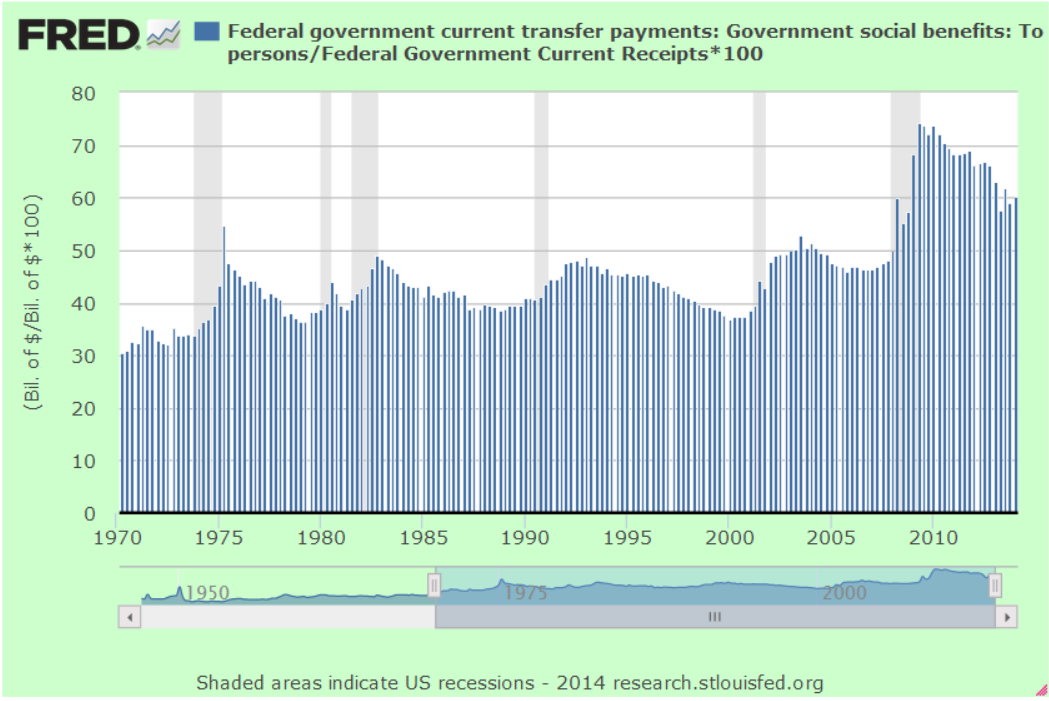
That percentage will surely rise as the boomer generation retires, taking an ever increasing share of revenues to pay out Social Security, Medicare and Medicaid benefits. As the percentage rises again toward the levels of the recession, we can expect that social benefit spending will take center stage in the 2016 Presidential election.
*******************************
Indicators
Back in ye olden days, soothsayers used chicken bones and tea leaves to foretell the future. We now have powerful computers, sophisticated algorithms and statistical techniques to look through the foggy glass of our crystal ball. Less sophisticated algorithms are called rules of thumb. In the board game Monopoly, a good rule of thumb is that it is wiser to build hotels on St. James, Tennessee and New York Ave than on the marquee properties Park Place and Boardwalk.
I heard a guy mention a negative correlation between early summer oil prices and stock market direction for the rest of the year. In other words, if one goes up the other goes down. I have a healthy skepticism of indicators but this one intrigued me since it made sense. Oil is essentially a tax on our pocketbooks, on the economy. If oil goes up, it is going to drive up supplier prices, hurt the profits of many companies, reduce discretionary income and drag down economic growth. The market will react to that upward or downward pressure in the next few quarters. But a correlation between six weeks of trading in summer and the market’s direction the rest of the year? Is that backed up by data, I wondered, or is that just an old saw? I used the SP500 (SPY) as a proxy for the stock market, the U.S. Oil Fund (USO) as a proxy for the oil market and threw in Long Term Treasuries (TLT) into the mix. I’ll explain why the treasuries in a minute.
A chart of recent history shows that there is some truth to that rule of thumb. When oil (gray bars) has dropped in price in the first six weeks of summer trading, the stock market has gained (yellow bars) during the rest of the year in five out of the past seven years. A flip of a coin will come up heads 50% of the time, tails 50% of the time. An investor who can beat those 50/50 chances by a margin of 5 wins to 2 losses will do very well.
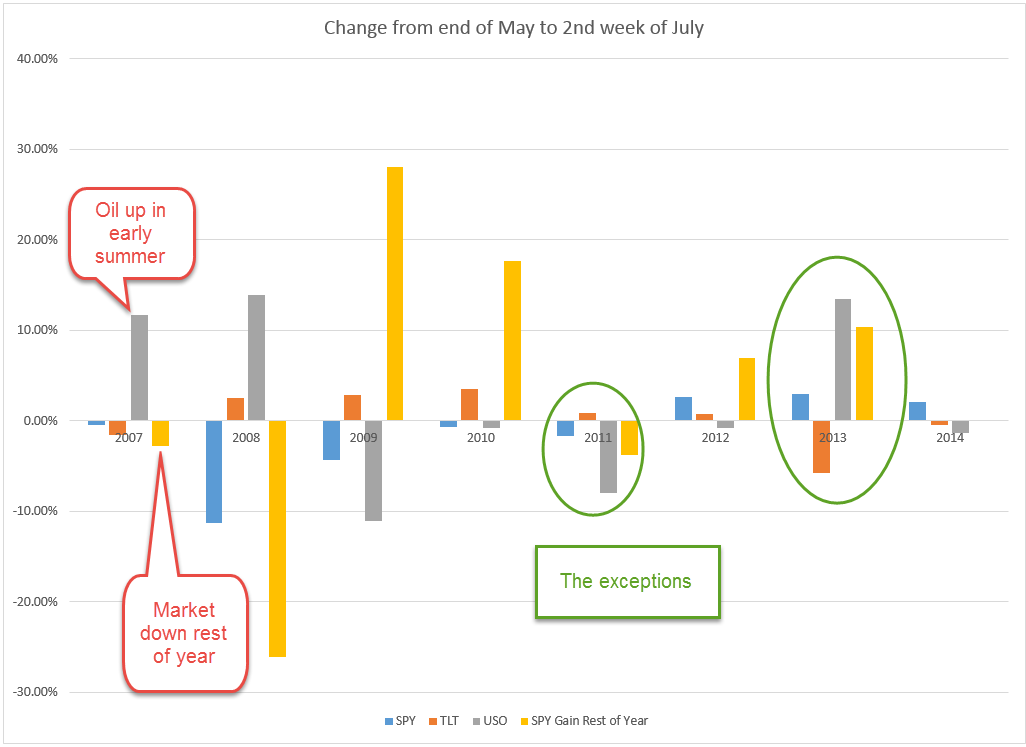
Whether this negative correlation is anything but happenstance is anyone’s guess. If you look at the chart again, you’ll see that there is also a negative correlation between long term Treasuries (TLT) and oil the the first half of summer trading. When one is up, the other is down. The last year these two moved in tandem was – gulp! – in the summer of 2008. Oh, and this year. We know what happened in the fall of 2008. So, is this the sign of an impending financial catastrophe? Let me go throw some chicken bones and I’ll let you know.
*************************
Takeaways
Small business sentiment eased back from its recent optimism. Spending on government social programs exacerbates political tensions and aging boomers will add fuel to the fire. Job openings and confidence continue to rise from historically low levels. Do summer oil prices signal market sentiment?
