Sales, Employment, Social Security

March 15th, 2014

Small business

The monthly survey of small businesses showed an abrupt decline in sentiment, below even the lowest of expectations,  and the sixth report since the beginning of the year to come in below the consensus range.  Two factors led the downward change: lowered sales expectations and hiring plans. The majority of business owners surveyed are reducing, not adding to inventory.  The steady but slowly improving sentiment during 2013 has now weakened.

This reading of optimism among small business owners is indexed to 100 in 1986.  The current survey reading of 91.5 is far above the pessimistic level of 80 that the index sank to in the early part of 2009.  In 2006, sentiment broke below the 95 level and has not risen above that since – eight years of below par sentiment among small business owners.

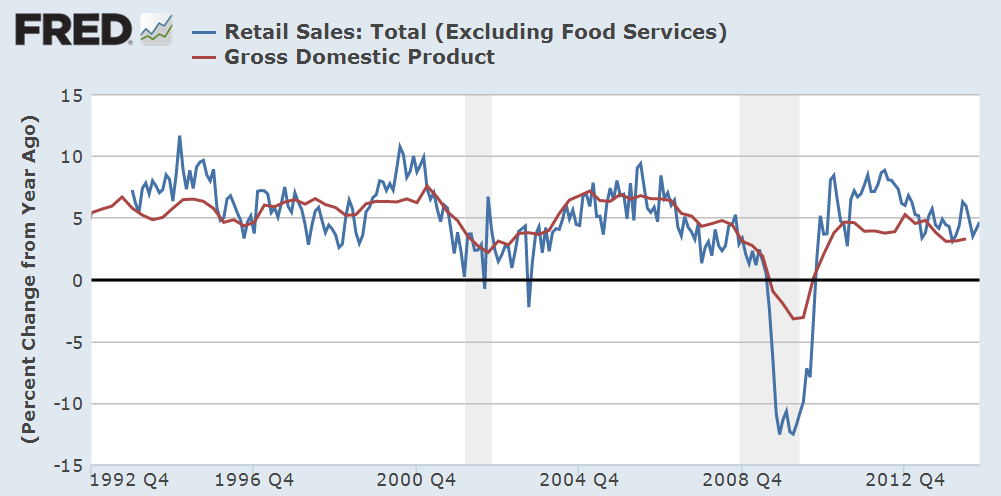
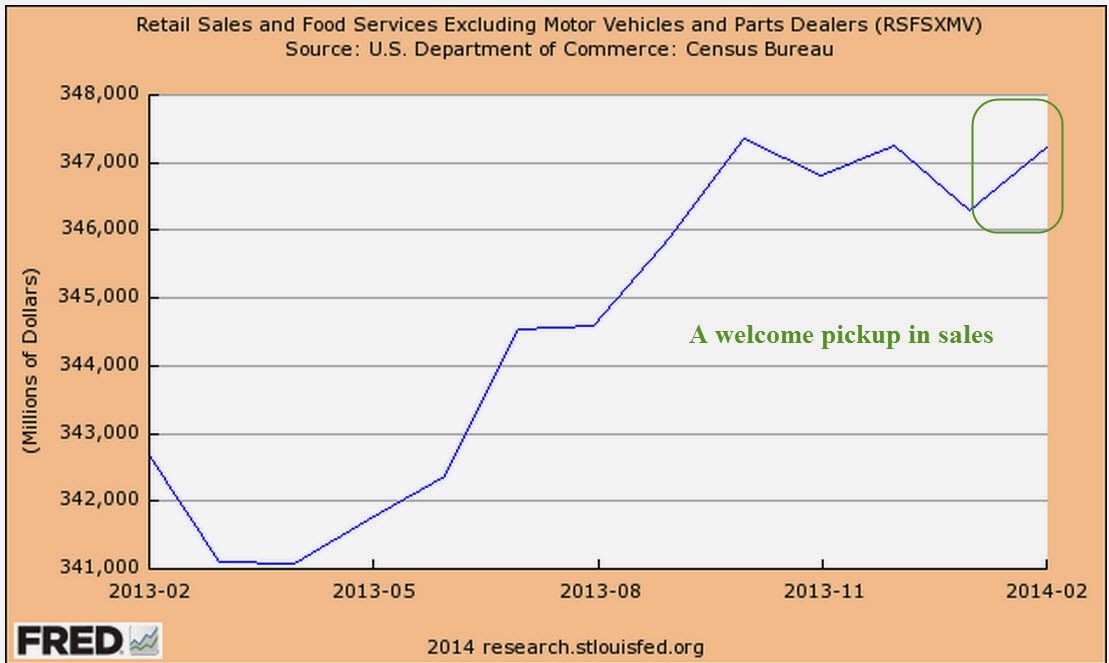
The lackluster small business report early in the week dampened market activity until the release of February’s retail sales report on Thursday.  The retail sales and employment reports that are released each month probably elicit the most response from the market.  A fall in February’s retail sales might have driven the market down at least 1%.  Instead, the report showed an annualized growth rate of 3.6%, offsetting the weakness in January and December.  Excluding auto sales, which accounts for about 20% of retail sales, total sales have formed a plateau.  Even auto sales were up this past month in spite of the extreme bad weather in parts of the country.  Some see this resilience in the face of the extraordinary weather this winter as an indication of an ever strengthening consumer base, a harbinger of solid economic growth.

The reason for the reduction in inventories indicated by the small business survey was revealed by Thursday’s report of the inventory-sales ratio for January.  Inventories rose at a 4.8% annualized rate versus a 7.2% annualized decline in sales.  January’s ratio of inventory to sales is at the same level as the beginning of the recovery in 2009.  Businesses will be cautious buyers this spring until excess inventories are reduced.

****************************
Employment

The number of unemployment claims declined again this week, bringing the four week average down to approximately 330,000, considered by many to be in the healthy range.  As a percent of the workforce, new unemployment claims are near all time lows.  Enacted in 1993, NAFTA had some small effect on employment but the more consequential impact was the admittance of China into the WTO.  As the relatively more volatile manufacturing employment decreased, so too did the surge in unemployment claims.  Note the reduced volatility of the work force today compared to the 1980s.

As a rule, employees quit jobs when they feel confident that another job is readily available.  The Quits rate has been rising since the official end of the recession in the summer of 2009 but is still relatively weak and declined in January.  The current level is at the lows of the recovery from the recession of the early 2000s.

As a percent of the workforce, however, the level of quits has not even reached the lows of that previous recession.

***************************
Income

Now for a disturbing trend: the decline in disposable income below 1% has always marked the start of a recession.  This annual report from the Bureau of Economic Analysis (BEA) covers the period till the end of 2013 and was not affected by the recent cold weather.

Recent price increases in basic food commodities like milk and cereal nibble away at consumers’ pocketbooks.  An ETF that tracks agricultural commodities is up almost 20% in the last six weeks.

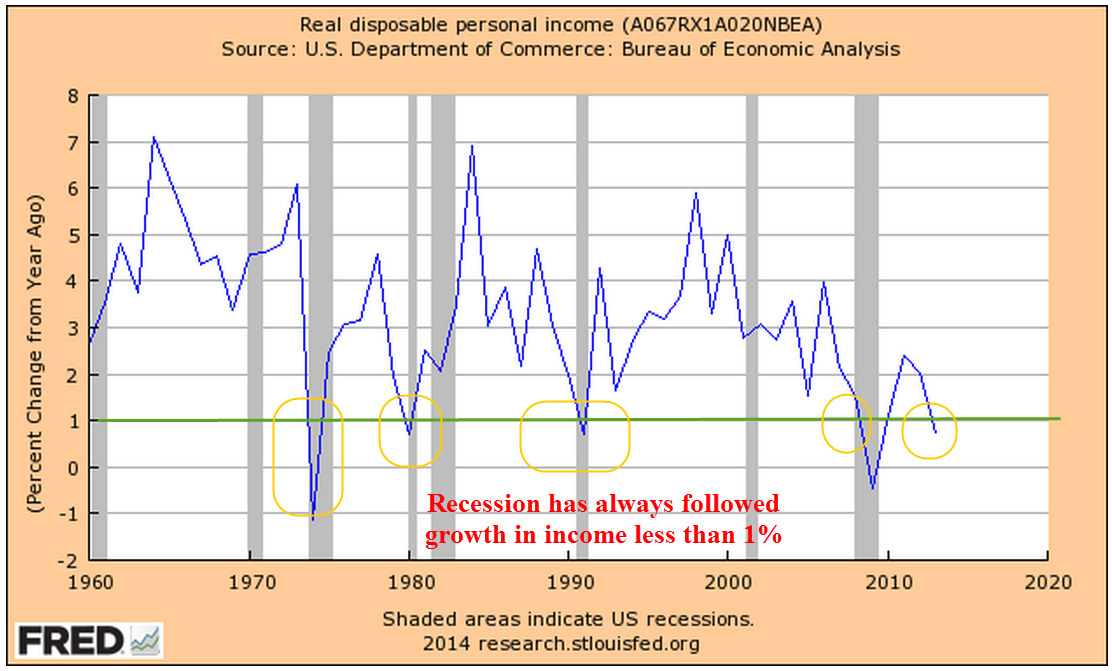
Whenever the growth in real, or inflation-adjusted, personal consumption has declined below 2.5%, the economy has always  gone into recession within the year.  In 2013, consumption growth fell to 2.0%.

Well, maybe this time is different.  Eternal hope, persistent denial. Those of us living in the present too often believe that we belong to an elite club with special rules that those in the past did not enjoy.

**************************

Social Security

Several years ago, the Social Security administration (SSA) estimated that 10,000 people would qualify for benefits each day.  Republican Congressman Eric Cantor and Democratic Senator Ron Wyden are two politicians on opposite sides of the political aisle who mention the 10,000 a day factoid.  The actual number of new retirees per day is actually higher.  Using recent data from the SSA, PolitiFact reported that 11,000 new retirees each day qualify for Social Security.  No one mentions the 4,300 who die and drop off the Social Security rolls (2008 data from the Census Bureau).  This number is likely to increase another 15% as the Boomer population swells into old age; the 1.6 million a year who die is likely to grow to 1.8 million who leave the Social Security system while 4 million become eligible for retirement benefits.  The result is an approximate net increase of 2.2 million beneficiaries each year of the next decade.

For now, let’s leave out the growth in the disability and Medicare programs and focus only on retirement and survivor’s benefits, or OASI.

At an average yearly benefit of $14K the benefits paid by the Social Security Administration rise by $31 billion this year, a 4.6% increase on the approximately $670 billion in Social Security and Survivor’s benefits paid out in 2013 (CBO report).  The relatively small deficit of $60 billion last year will grow into hundreds of billions within the decade.  Congress argues at length over $3 billion; efforts at tackling the really big deficits of Social Security are too often met with blowhard rhetoric, not serious negotiation.

The SSA estimates that “By 2033, the number of older Americans will increase from 45.1 million today to 77.4 million.” (SSA Basic Facts) At an inflation rate of 2.5%, less than the 3% average of the past 50 years, the average $14K annual benefit will grow to $23K by 2033.  Multiply that by 77 million people and the total of benefits that will be paid to seniors in 2033 is close to $1.8 trillion, almost triple the benefits paid in 2013.  

The current elderly count of 45 million people is 14% of today’s population of approximately 313 million.  In 2033, 77 million elderly will be 20% of an estimated population of 382 million.  More people getting paid while fewer people will be paying.  The SSA estimates that a little over 40% of the population who are working will be supporting the 20% of the population that is collecting SS benefits.
Independent Senator Bernie Sanders is fond of reassuring us that the Social Security Trust Funds have plenty of money to pay benefits over the next two decades.  What the trust funds have are I.O.U.s from the U.S. Government’s pool of tax revenues.  Where will the money come from?  Increased taxes. 
Politicians rarely lead.  The art of politics is to look like one is a leader, to position oneself at the front of the herd as it flees the pursuing lions.  In this case, the lions are demographics, and decades of promises, unrealistic assumptions and political cowardice.  The question is whether voters will force the leaders to lead before the lions attack.

Retail Sales and Inflation

December 15th, 2013

Retail sales rose .7% in November, posting year over year (y-o-y) gains of almost 5%.  The twenty year average of y-o-y gains is 4.6%.  When we remove the eleven monthly outliers with gains of more than 10% or less than -10%, the average is 5.0%

Now let’s compare the percentage change in GDP with the change in retail sales.

The change in GDP is like a smoothed average of the change in retail sales, so the continuing willingness of consumers to spend is a positive for both GDP growth and the market in the mid-term outlook.

*******************************

In March 2009, incoming President Obama pledged that his administration was going to support small businesses which employ 1/2 the workforce and contribute 40% to GDP. (CBS News article  Note: The article incorrectly states that small businesses employ 70% of the workforce.) A recent report, short and written in plain English, by the Cleveland Federal Reserve compares levels of lending to small businesses in 2013 vs 2007.  Five years after the financial crisis, six years after the start of the recession, loans to small businesses are only 80% of 2007 levels.  Impacting the start up of small companies has been the decline in home values.  Home equity provides the funding for most small business start ups.

A graph from the report illustrates the long term decline of small business lending.  As the banking sector has consolidated over the past twenty years, the mega-banks have less incentive to “take a chance” on small businesses.

As I watch Senate and House hearings on C-Span (yes, I know I have a problem), I am struck by how many members of Congress appear to be on a mission.  While at times Washington seems to be a town of political prostitutes, it may be more accurate to describe it as a town of missionaries.  These dedicated men and women come to Washington with a plan to save the souls of the American people – or at least that’s the way they like to present themselves.  Nancy Pelosi and other prominent Democrats give voice to the plight of the long term unemployed but rarely mention small business owners.  A 50 year old guy who can’t find a job because his skills are out of date is a topic of concern to Democrats.  But what about the 50 year old who can’t start up a business because the drop in housing prices has diminished the equity of many home owners?  Republicans mention small businesses only when bashing Obamacare.  Why has there been so little attention paid to this rather large part of the economy?  Why aren’t the banks being subpoenaed to appear before a Congressional subcommittee?  Many Presidents seem to spend their second terms answering for the broken promises of their first term.  Finally, after eight years, voters turn to a new guy, hoping that this one will be different.  Hope, or foolishness, triumphs in the hearts of voters.

********************************

Now I’ll take a look at a contentious subject, the measurement of inflation.  A comprehensive review of the inflation measurement is far beyond my skills and a blog.  The CPI produced by the Bureau of Labor Statistics is the official measurement of inflation to adjust Social Security payments each year.  I want to come at the subject from a different viewpoint – corporate profits. Starting in 1990, the Bureau of Labor Statistics (BLS) adopted a new way of measuring inflation, introducing what is called a hedonic adjustment. Coincidentally, corporate profits began to surge shortly thereafter.  Below is a graph showing inflation adjusted profits.

Adjusting for population growth, the surge in per capita profits confirms the trend.

As I noted in September, corporate profits as a percent of GDP are at historically high levels.

In a FAQ sheet, the BLS explains their methodology in plain language and refutes the claim that hedonic adjustments have any significant impact on the CPI measurement. I have also discussed another measure of inflation, the PCE deflator.  Here is a working paper by an economist at the Federal Reserve on the PCE measurement.

For years, John Williams of Shadow Government Statistics (SGS) has painstakingly maintained an alternate data set of the CPI.  Here’s a graph from that page to give you an idea.

As you can see, the official measure of inflation is about 2 – 3% below the CPI that Williams produces using the pre-1990 methodology.  Essentially, hedonic adjustments measure inflation after consumers have adjusted to inflationary price pressures.  Let’s say that a family eats steak twice a week.  Steak then goes up in price by 20%.  To stay within their budget, a family might substitute hamburger for one of those meals.  The old method of measuring inflation would capture the 20% rise in the price of steak.  The post-1990 method does not capture all of that rise because it allows for the substitution effect.

Several reasons have been given for the dramatic rise in corporate profits since 1990.  These include globalization, technology, and increased productivity of both labor and capital.  As I wrote about in August, multi-factorial productivity has only increased 12% in the 12 years from 2000 – 2012, an annual gain of less than 1%.  Technological progress occurred in almost every decade of the past century, yet average economic growth is about 3% over those one hundred years – a remarkable consistency.  Globalization has helped and hurt domestic companies, enabling them to reduce costs but also increasing the competition from firms around the world.  Have companies found some magic key in the past twenty years?

The magic key may be the change in the CPI methodology. What if the CPI understates inflationary pressures by 2 – 3% each year?  What effects would that have?  Interest rates would be reduced, lowering the costs of borrowing for companies.  There would be less pressure from labor for wage increases.  These two factors figure heavily in the profits of many large companies. (Interest expense for GE is more than a third of their operating income ).  There is yet another effect: real profits adjusted for this higher inflation rate, would simply not be so dramatic.

Since 1990, per capita corporate profits have risen about 7.6% per year.

Now let’s adjust per capita profits for inflation using the official CPI and a higher inflation rate that is closer to the inflation measures that SGS compiles.

What we see is approximately 3% real growth in per capita profits since 1990.  This is quadruple the .75% growth rate of corporate profits for the thirty year period from 1959 – 1989.

The 30 year average was hurt by the 4% decline in inflation and population adjusted profits during the 1980s.  This decline undermines the conventional narrative that the 1980s were a big growth boom for companies.  The 50 year average of this real profit growth is 2.5%.  As a rule of thumb then, we can guesstimate inflationary pressures on consumers as the nominal rate of profit growth less 2.5%.  Let’s look at a chart I showed earlier.

The 7.6% nominal growth rate of profits less 2.5% gives us an average inflation rate of close to 5% for the past 23 years.  This different methodology lends more credence to the higher CPI calculations that SGS presents. Compare this to the 2.5% average that the BLS calculates for this time period.

Small changes in methodology add up over time.  While this “back of the envelope” method of computing inflation does not meet the rigor that Williams brings to his calculations, it does illustrate the difference in inflationary pressures that many families feel.  Here’s a comparison of the two indexes.

Now comes the juicy part and I will keep my voice low.  There is a conspiracy theory floating around that, in the late 1980s, the politicians in Washington were pressured by businesses to have the BLS revise their methodology to reduce rising labor costs which were hurting profits. Another theory says that Congress wanted to curb the annual CPI increases in Social Security and Medicare payments and secretly ordered the BLS to come up with a way to revise the CPI down.  In 50 years, financial historians may discover that both of these theories have some substance.

Whatever the “real” reason for the change in methodology, those who are dependent on retirement income indexed to the CPI should keep in mind that unmeasured inflationary pressures may eat an additional  2 – 3% out of their retirement savings base and income.

Productivity and You

In an article for the online magazine Slate, Daniel Gross presents the plight of the many employees who have jobs and are fed up with them.  I’ve been there, done that – a number of times in my life – so I can relate.  Now I’ll give you the other side of the picture.

Appearing before the House Joint Economic Committee on Aug. 6th, Keith Hall, the Commissioner of the Bureau of Labor Statistics, reported that about 98% of employees in this country work for a company with 50 employees or less.  He stated that there have been small increases in hiring by larger companies but hiring by small companies is flat or has decreased slightly.

Small companies are the economic engine of this country and they are not hiring.  Until small company owners starting hiring, workers will continue to endure almost record unemployment. This administration has only just begun to address this issue with talk about a loan program for small businesses.  For the past 1-1/2 years, they have been focused on the viability of big companies, those that produce 2% of the jobs in this country.  This administration thought that by helping the big guys, they would be helping the little guys – a kind of trickle down economics.  By the time the presidents and many vice-presidents at the big companies get done taking their share of the administration’s stimulus money, that’s about all that is left for the smaller companies – a trickle.  Little wonder that the real engine of this economy is sputtering.

The reluctance of small business owners to hire is due to several factors:  caution, fear, and uncertainty about future sales are top reasons.  Others are: a lack of readily available business loans, excessive employee regulations and the burden of employee payroll taxes and benefits.  Politicians like to make promises of a safety net for all employees, but who builds that safety net?  Small business owners.

Many small businesses have had to lay off employees in the past 2 – 3 years and those layoffs jack up the unemployment rate on each business.  In response to the rise in unemployment, many states also charge employers an additional tax surcharge.  My company’s unemployment insurance rate has quadrupled in the past two years. If a small business owner hires an employee and business drops off after six months, the owner will have to let the employee go, which will only increase the unemployment insurance rate again.  This self-defeating cycle of increasing taxes only makes small business owners more cautious about hiring.

In a downturn, small employers try to let those employees go who have the least productivity, leaving only the more productive workers to get the job done.  As a result, productivity goes up.  During downturns, the employees who have jobs are reluctant to push for raises and that, in turn, keeps a damper on labor costs, which helps increase productivity.  There are a number of other factors that have contributed to increased productivity in the past decade, but the chief one is investment in technology.  Better technology has enabled workers in a variety of industries to be more productive.  Daniel Gross, the writer of the Slate article, seems to think that it is because employees are working harder.  While that may be a minor contributing factor, people can only work so hard.  Better tools produces the biggest sustained gains in productivity.

The Bureau of Labor Statistics recently released their preliminary report of productivity for the quarter ending in June. For those readers who like graphs, the first page of the report has graphs of productivity for the past 5 years. For the first time since 2008, productivity declined about 1%.  In late 2007 and early 2008, labor costs increased dramatically, putting downward pressure on productivity.  Does Daniel Gross think that the downturn of productivity in 2008 meant that workers were goofing off that year?  When the economy gets strong or overheated, workers can demand higher pay for their work, which lowers productivity. 

There is an old saying “I never got a job from a poor person.”  While that may be true, it is also true that, for most of us, we get a job from a small business owner and most of those owners are not rich, just a bit better off than the people they hire.  Many smaller businesses are funded in part by the equity in the owner’s home.  The owner borrows against that equity to expand a small business or to fill in the cash flow gap that occurs frequently to many smaller business owners.  As the real estate market tanked, many small business owners saw their home equity decline or evaporate, making banks less willing to extend a business loan.

What answers does each of our political parties have to this small business funding crisis?  After 1-1/2 years of not thinking it was a problem, the Democrats will craft some complicated program that involves a lot of paperwork that small business owners will have to fill out.  What do the Republicans offer as a solution for the small business lending crisis?  Why it’s the one answer that Republicans give for all problems – lower taxes.  Neither party could fix a leaking drain.

Health Horror Stories

In 2007, USA today reported several horror stories of individual health policy revocations. These stories highlight the root conflict of interest in private health insurance. In case you might wonder why other forms of insurance don’t have these problems, they do. Business liability insurance has its own horror stories. I know of several smaller contractors, newly in business, who simply could not get liability insurance from the more reputable insurance companies for their line of work in construction. The public hears little of these stories. They are told on job sites and in trade journals.

Home Equity Loans

Since the credit crisis in September 2008, home equity loans have declined – little surprise there. The steepness of the decline, however, is a bit astonishing. In a Dec. 25th article, AP details the 87% drop in loans in 2009 compared with loans in 2006, when the housing market was booming.

A lot of kitchens and baths are not getting remodeled, garages are not being built, college educations are not being funded. The reduction in remodeling projects has dealt a blow to the construction industry but the sharp reduction in home equity lending has a wider impact on many varieties of small businesses. Home Equity loans provide the start up funds for new businesses and can provide a more cost effective way for small businesses to build seasonal inventories. In a July article, CNN looked at this aspect of the credit crunch.

Small businesses, not the mega corporations or the financial bank giants, create the majority of new jobs in this country. Unemployed people sap the resources of local, state and federal government. Employed people contribute to those resources with payroll and income taxes, as well as sales taxes. It would be good public policy to implement an incentive program to encourage private banks to loan to small businesses.

Small Business Health Benefits

In a 5/26/09 WSJ article, Dana Mattioli reports on how the recession and health care premium increases are affecting small businesses.

What does the future hold? “About 10% of small businesses are considering eliminating coverage over the next year, up from 3% in 2005, according to a recent survey by National Small Business Association.” A survey by another group estimates 19% of small businesses dropping coverage over the next two years.

What are the historical trends? The Small Business Association reports that “just 38% of small businesses [provided] health insurance last year compared to 61% in 1993.”

What is not news to any small business owner is the increase in premiums over the past years. “Health-insurance premiums for single workers rose 74% for small businesses from 2001 to 2008, the latest year data are available, according to nonprofit research group Kaiser Family Foundation.” In that same period, the Consumer Price Index has gone up 22%.

As revenues drop, some business owners have been canceling health insurance in order to keep more employees on the payroll.

Small Business Lending

In a 5/5/09 WSJ article, Raymund Flandez focuses on the market for small business loans.

In February, 35% of new SBA loans of the most popular type were sold on the secondary market, up from 24% the previous month. Before the crisis in September 2008, 45% of these loans were sold on the secondary market.

At GovGex.com, where these loans are bundled and sold, bids for these loans have more than doubled since mid-March, when the Obama administration made a pledge to use $15B of taxpayer money to free up the secondary market in these loans. The government is guaranteeing as much as 90% of some loans. Before that pledge, the market for these loans had all but dried up, with volume totalling on $7.8M. Since then, volume has rocketed to over $67M.

Loan applications have more than tripled at Small Business Loan Exchange, an online marketplace which matches up borrowers with lenders.

Government Loan Solutions follows the SBA market closely and reports that the delinquency on the most popular SBA loan was 6.18%, the second highest rate in 10 years.

Small Business Stimulus

In the 3/10/09 WSJ Small Business section, Kelly Spors notes that the federal stimulus bill mandates that the government “aims to award 23% of all contract dollars across all agencies to small businesses every year.”

There are several examples of new contracts recently awarded but the author notes the difficulties that small businesses have to secure government contracts. A company may have to invest a lot of employee hours to cope with the many regulations and abundant paperwork in order to bid a job. A former president of the Entrepreneur’s Organization says that it may be better for a small business to subcontract on a few projects to get some idea of what is required.

The government has a website where you can register and survey the various business contracts available.