December 15th, 2013
Retail sales rose .7% in November, posting year over year (y-o-y) gains of almost 5%. The twenty year average of y-o-y gains is 4.6%. When we remove the eleven monthly outliers with gains of more than 10% or less than -10%, the average is 5.0%

Now let’s compare the percentage change in GDP with the change in retail sales.
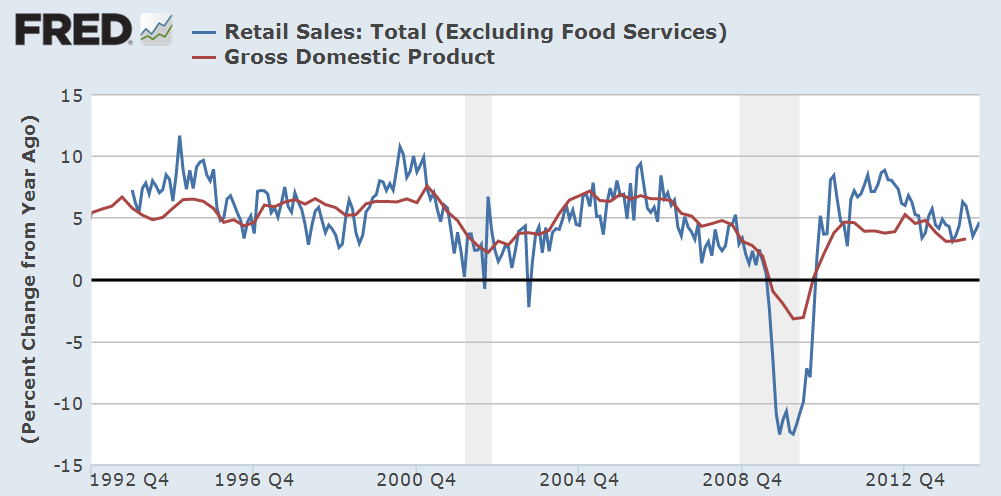
The change in GDP is like a smoothed average of the change in retail sales, so the continuing willingness of consumers to spend is a positive for both GDP growth and the market in the mid-term outlook.
*******************************
In March 2009, incoming President Obama pledged that his administration was going to support small businesses which employ 1/2 the workforce and contribute 40% to GDP. (CBS News article Note: The article incorrectly states that small businesses employ 70% of the workforce.) A recent report, short and written in plain English, by the Cleveland Federal Reserve compares levels of lending to small businesses in 2013 vs 2007. Five years after the financial crisis, six years after the start of the recession, loans to small businesses are only 80% of 2007 levels. Impacting the start up of small companies has been the decline in home values. Home equity provides the funding for most small business start ups.
A graph from the report illustrates the long term decline of small business lending. As the banking sector has consolidated over the past twenty years, the mega-banks have less incentive to “take a chance” on small businesses.

As I watch Senate and House hearings on C-Span (yes, I know I have a problem), I am struck by how many members of Congress appear to be on a mission. While at times Washington seems to be a town of political prostitutes, it may be more accurate to describe it as a town of missionaries. These dedicated men and women come to Washington with a plan to save the souls of the American people – or at least that’s the way they like to present themselves. Nancy Pelosi and other prominent Democrats give voice to the plight of the long term unemployed but rarely mention small business owners. A 50 year old guy who can’t find a job because his skills are out of date is a topic of concern to Democrats. But what about the 50 year old who can’t start up a business because the drop in housing prices has diminished the equity of many home owners? Republicans mention small businesses only when bashing Obamacare. Why has there been so little attention paid to this rather large part of the economy? Why aren’t the banks being subpoenaed to appear before a Congressional subcommittee? Many Presidents seem to spend their second terms answering for the broken promises of their first term. Finally, after eight years, voters turn to a new guy, hoping that this one will be different. Hope, or foolishness, triumphs in the hearts of voters.
********************************
Now I’ll take a look at a contentious subject, the measurement of inflation. A comprehensive review of the inflation measurement is far beyond my skills and a blog. The CPI produced by the Bureau of Labor Statistics is the official measurement of inflation to adjust Social Security payments each year. I want to come at the subject from a different viewpoint – corporate profits. Starting in 1990, the Bureau of Labor Statistics (BLS) adopted a new way of measuring inflation, introducing what is called a hedonic adjustment. Coincidentally, corporate profits began to surge shortly thereafter. Below is a graph showing inflation adjusted profits.

Adjusting for population growth, the surge in per capita profits confirms the trend.

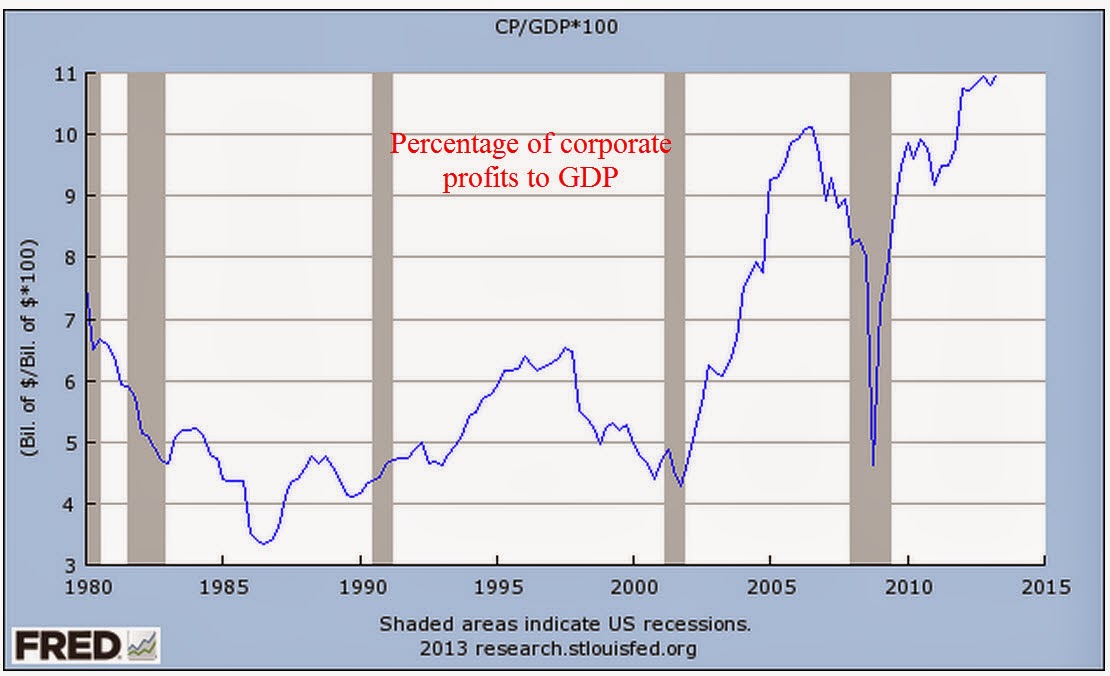
As I noted in September, corporate profits as a percent of GDP are at historically high levels.
In a FAQ sheet, the BLS explains their methodology in plain language and refutes the claim that hedonic adjustments have any significant impact on the CPI measurement. I have also discussed another measure of inflation, the PCE deflator. Here is a working paper by an economist at the Federal Reserve on the PCE measurement.
For years, John Williams of Shadow Government Statistics (SGS) has painstakingly maintained an alternate data set of the CPI. Here’s a graph from that page to give you an idea.
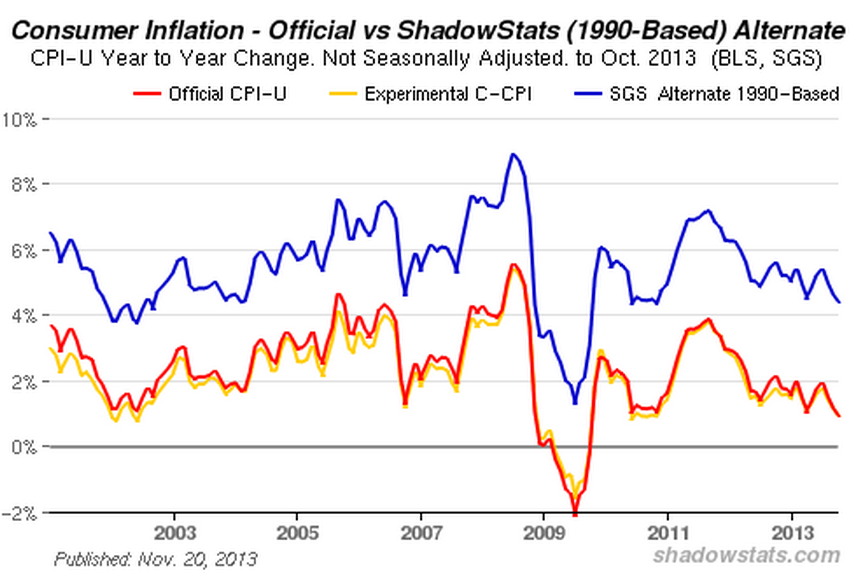
As you can see, the official measure of inflation is about 2 – 3% below the CPI that Williams produces using the pre-1990 methodology. Essentially, hedonic adjustments measure inflation after consumers have adjusted to inflationary price pressures. Let’s say that a family eats steak twice a week. Steak then goes up in price by 20%. To stay within their budget, a family might substitute hamburger for one of those meals. The old method of measuring inflation would capture the 20% rise in the price of steak. The post-1990 method does not capture all of that rise because it allows for the substitution effect.
Several reasons have been given for the dramatic rise in corporate profits since 1990. These include globalization, technology, and increased productivity of both labor and capital. As I wrote about in August, multi-factorial productivity has only increased 12% in the 12 years from 2000 – 2012, an annual gain of less than 1%. Technological progress occurred in almost every decade of the past century, yet average economic growth is about 3% over those one hundred years – a remarkable consistency. Globalization has helped and hurt domestic companies, enabling them to reduce costs but also increasing the competition from firms around the world. Have companies found some magic key in the past twenty years?
The magic key may be the change in the CPI methodology. What if the CPI understates inflationary pressures by 2 – 3% each year? What effects would that have? Interest rates would be reduced, lowering the costs of borrowing for companies. There would be less pressure from labor for wage increases. These two factors figure heavily in the profits of many large companies. (Interest expense for GE is more than a third of their operating income ). There is yet another effect: real profits adjusted for this higher inflation rate, would simply not be so dramatic.
Since 1990, per capita corporate profits have risen about 7.6% per year.

Now let’s adjust per capita profits for inflation using the official CPI and a higher inflation rate that is closer to the inflation measures that SGS compiles.

What we see is approximately 3% real growth in per capita profits since 1990. This is quadruple the .75% growth rate of corporate profits for the thirty year period from 1959 – 1989.

The 30 year average was hurt by the 4% decline in inflation and population adjusted profits during the 1980s. This decline undermines the conventional narrative that the 1980s were a big growth boom for companies. The 50 year average of this real profit growth is 2.5%. As a rule of thumb then, we can guesstimate inflationary pressures on consumers as the nominal rate of profit growth less 2.5%. Let’s look at a chart I showed earlier.

The 7.6% nominal growth rate of profits less 2.5% gives us an average inflation rate of close to 5% for the past 23 years. This different methodology lends more credence to the higher CPI calculations that SGS presents. Compare this to the 2.5% average that the BLS calculates for this time period.
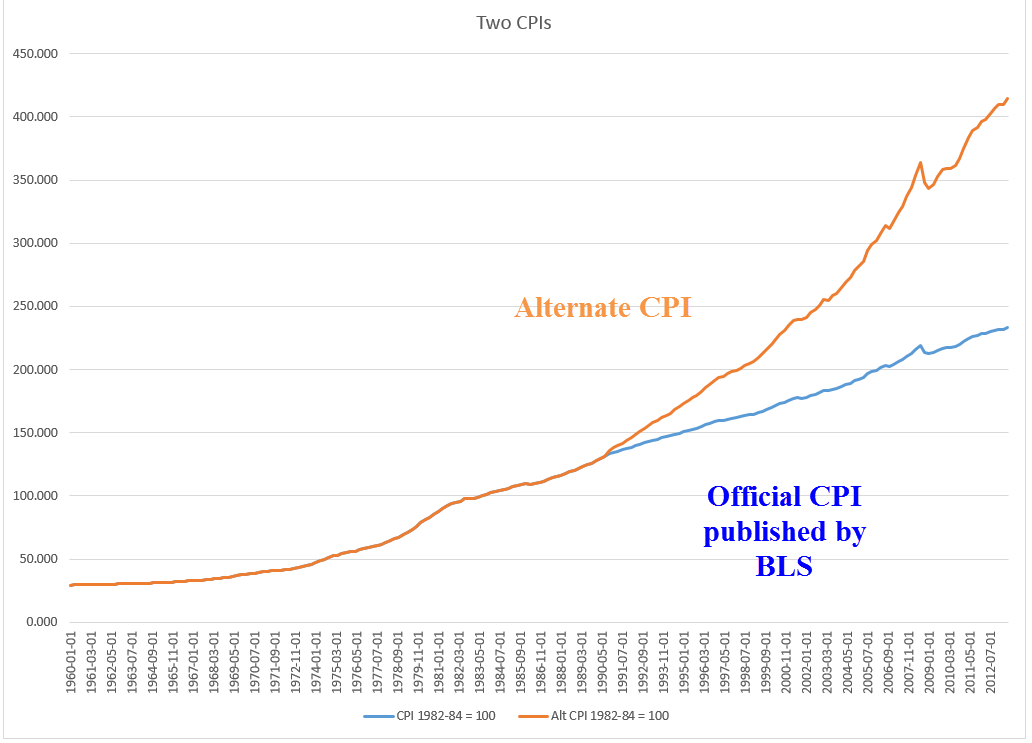
Small changes in methodology add up over time. While this “back of the envelope” method of computing inflation does not meet the rigor that Williams brings to his calculations, it does illustrate the difference in inflationary pressures that many families feel. Here’s a comparison of the two indexes.
Now comes the juicy part and I will keep my voice low. There is a conspiracy theory floating around that, in the late 1980s, the politicians in Washington were pressured by businesses to have the BLS revise their methodology to reduce rising labor costs which were hurting profits. Another theory says that Congress wanted to curb the annual CPI increases in Social Security and Medicare payments and secretly ordered the BLS to come up with a way to revise the CPI down. In 50 years, financial historians may discover that both of these theories have some substance.
Whatever the “real” reason for the change in methodology, those who are dependent on retirement income indexed to the CPI should keep in mind that unmeasured inflationary pressures may eat an additional 2 – 3% out of their retirement savings base and income.

This comment has been removed by a blog administrator.
LikeLike