The Association – A Split

August 25, 2019

by Steve Stofka

A few things before I continue the saga of our mountain community. Bond yields have sunk to remarkable lows as the prices of those bonds climb higher in response to global demand for safe assets. Governments have borrowed trillions since the financial crisis, yet there is not enough debt to meet demand.

The private market created a huge supply of “safe” assets called Collateralized Debt Obligations, or CDOs, based on house mortgages. When the housing market imploded, it left a big hole in the market for safe assets. As countries around the world have adopted capitalistic market structures, the living standards of millions of people have improved and that has led to more savings in search of safe investments.

The U.S. still pays a positive interest rate on its debt and that is attracting a lot of foreign capital to our country – capital that is driving down the interest rates on our savings and pension assets. Unlike some other countries, capital moves freely across U.S. borders. It doesn’t wait in crowded spaces behind chain link fences.

Donald Trump’s family business relies heavily on borrowing, and most of that has come from a single source, the German firm Deutsche Bank. No other bank is willing to risk capital on a family business with a history of failure. The family’s business depends on the free movement of capital across national borders, yet Trump himself is adamantly opposed to the free movement of labor across borders.

Capital requires a legal framework of property rights protection, a robust banking system capable of servicing that capital, and a political system that protects the profits generated by investment from graft and corruption. Labor requires a social framework in addition to a legal system that enforces basic personal rights. Capital comes to this country because we spend a lot of money to nurture and protect it more than some other countries. Labor comes to this country for the same reasons – a higher return on their effort, an educational system that nurtures their families, a social and legal system that offers some protections.

“They’re taking our jobs!” some people complain of immigrant labor, yet few Americans are affected by an immigrant labor force that takes mostly lower paying jobs. The flow of capital into our country creates a competition that affects many more Americans – anyone who has a savings account, a pension fund, a 401K, an IRA. Where is the outcry against foreign capital?

Let us return to those dear souls who inhabited an abandoned mining town. In last week’s story, they had formed a homeowner’s association which created Money, Debt, and traded with another community called the Forners.

The board of the homeowners’ association complained often about the expense of handling the Money that it had created. The association decided that it would be more efficient to reduce the use of paper Money. It gave each homeowner a bank account and a Money shredder which scanned and tabulated the Money that each homeowner shredded. Homeowners didn’t have to go to the community center when they needed to pay another homeowner or the association. When they did receive Money, they deposited it in the shredder, which added the amount to their balance. When they wanted to pay someone, they tapped some buttons on their shredder and the amount went from their account to the other homeowner’s account. Paying their monthly homeowner fees was so much more convenient.

A homeowner called Mary decided to re-open the old restaurant, but she would need more Money than she had. What to do? The association could print the Money and loan it to her. Mary would put up 10% of what she needs, and the association would print the other 90%.  She would pay the money back over time with interest. One of the homeowners asked, “How will we be paid if we do work for Mary’s restaurant?” Someone answered, “With the same Money that you get paid when you work for the association.”

That was acceptable to everyone. With the extra Money earned by fixing up Mary’s restaurant, several other homeowners put down deposits and opened businesses with loans from the association (Note #1). The association held a mortgage on each business, but the business owner decided how to run the business and received the profits from the business.

When Stan’s business failed, the homeowners discussed what to do. Stan had spent the printed Money that the association had loaned him, so the Money had not disappeared. Like all the printed money, it was spread around the community. The effect of Stan’s business failure was the same as if the association had started the business, hired people to do work, paid them and then closed the business after a time. The printed Money went out into the community but never made it back to the association in the form of loan payments. Someone said, “There is extra Money in our community because Stan’s business loan won’t be paid back.”

They agreed that this was so but what to do about it? They all had some extra Money because of Stan’s business loan. “What if more businesses fail?” someone asked. “What will we do with all the extra money the association has printed?”

“Prices will go up,” someone else said. “That’s what happened last time.”

“If more businesses failed, I would be more careful and buy less stuff,” another offered. Several heads nodded. “I’d deposit some extra Money in the shredder.”

“Well, that doesn’t make the Money go away,” someone argued. “The money is still in your bank account with the association.”

“But prices won’t go up because people are spending less Money, isn’t that right?” someone asked. That was the confusing part. The last time there was extra Money, prices went up. But in this case, prices were likely to go down if more businesses failed and there was extra Money.

Someone stood up and said, “I’ve got the answer. When we all worked fixing up Stan’s business, the Money was exchanged for our labor and supplies. Since the Money was exchanged for goods and services, there is no extra Money.”

Someone else countered, “What if we all started businesses, borrowed Money from the association and we all failed? There would be a lot of extra Money.”

The other person answered, “Yes, the amount of circulating Money would be suitable for a thriving community. Too many people with a lot of Money and nowhere to spend it would drive up prices. But just one or two business failures has such a small effect that it is negligible.”

They decided to continue printing and loaning money but formed a loan committee whose job was to review an applicant’s business plan before loaning the money.

Bob, the community’s propane dealer, bought his supplies from the Forners. One month, the Forners got very angry at the whole community and would not sell propane to Bob. He contracted with another community for propane but there wasn’t enough for everyone’s needs. Bob raised the price of propane then began rationing propane by selling only to those who were in line at his station at 6 A.M. After two hours, he shut off supplies until the next day. Some homeowners threatened Bob and so he had to hire a few people for extra security (Note #2).

Mary used a lot of propane for cooking, so she had to spend several hours each day buying propane. Naturally, she raised prices to account for the additional time and higher price of propane. Homeowners ate fewer meals at Mary’s and she had to let go of several employees.

As prices rose, some homeowners who had bought association debt at low interest rates began to complain. “We loaned the association money at 5% interest and prices are going up at 10% a year. We’re losing money!”

Everyone agreed that this wasn’t fair, but no one knew what to do about it. Should they cancel the old debt and reissue debt at higher interest rates? That would lead to higher homeowner fees for everyone. “You want us to pay extra so that your interest income will keep up with inflation? Why should I take money out of my pocket and put it in yours?”

Tempers flared. “I’m not loaning this association money ever again,” complained one homeowner and several stormed out of the clubhouse. True to their word, these homeowners would not renew their loans to the association unless it paid much higher interest rates. After several months, the Forners resumed propane deliveries but a vicious cycle of higher prices had started. Homeowners had to pay higher association fees and wanted more money for their labor to pay those higher fees. No one knew how to fix the situation.

“We need to charge high interest rates on the Money we print and loan to homeowners for their businesses and homes,” a board member said.

“Are you crazy?!” Several complained. “Rates are already too high. People can’t afford to start businesses or buy a home!”

“We need to raise them so high that it will hobble the economy for a while,” the board member said. “That’s the only way to bring prices down. It won’t take long.”

It took much longer than anyone anticipated, and the economy declined for almost two years. This period of higher prices followed by high interest rates caused a divide among the homeowners – between those who relied on the association for services and help during hard times, and those who formed a deep distrust of the association (Note #3). No one fully understood how deep the divide would grow.

/////////////////////

Notes:

  1. The process where loans generate income for others which generates more loans is called the Money Multiplier in economics.
  2. In the 1970s, two gas embargoes led to similar circumstances.

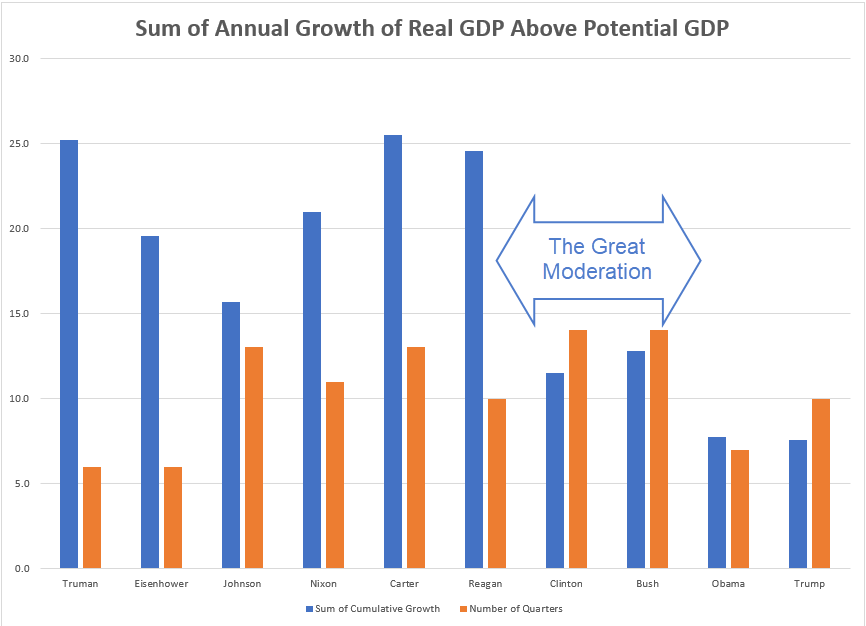
This is a retelling of the high inflation of the late 1970s, followed by nose-bleed interest rates that caused back-to-back recessions in the early 1980s. The recession of 1981-82 was the most severe since the 1930s Depression.  

The Homeowners’ Association

August 18, 2019

by Steve Stofka

Two quick asides before I get into this week’s topic. A cricket perched on the top of a 7′ fence. It drew up to the edge of the top rail, learned forward, raised its rear legs as though to jump, then settled back. It did this twice more before jumping 8′ out then down into a soft landing on some ground cover. How far can crickets see, how often do they injure a leg if they land incorrectly and do they get afraid?

The bulk of the personal savings in this country is held by the top 20% of incomes, and it is this income group that received the lion’s share of the 2017 tax cuts. It’s OK to bash the rich but that top 20% probably includes our doctor and dentist. Before you start drilling or cutting me, I want to make it perfectly clear that I was not criticizing you, Doc.

In 2016, the top quintile – the top 20% – earned 2/3rds of the interest and dividend income (Note #1). Due to falling interest rates over the past three decades, real interest and dividend income has not changed. Real capital has doubled and yes, much of it went to those at the top, but the income from that capital has not changed. That is a huge cost – a hidden tax that gets little press. The real value of the public debt of the Federal Government has quadrupled since 1990, but it pays only 20% more in real interest than it did in 1990 (Note #2). Here’s a graph of personal interest and dividend income adjusted to constant 2012 dollars. Thirty years of flat.

Ok, now on to a story. Economists build mathematical models of an economy. I wanted to construct a story that builds an economy that gradually grows in complexity and maybe it would help clarify the relationships of money, institutions and people.

Let’s imagine a group of people who move into an isolated mining town abandoned several years earlier. The houses and infrastructure need some repairs but are serviceable and the community will be self-sufficient for now. The homeowners form an association to coordinate common needs.

The association needs to hire lawn, maintenance and bookkeeping services, and security guards to police the area and keep the owners safe.  How does the association pay for the services?  They assess each homeowner a monthly fee based on the size of the home. How do the homeowners pay the monthly fee?  Each homeowner does some of the services needed. Some clean out the gutters, others fix the plumbing, some keep the books and some patrol the area at night. They work off the monthly fee.

How do they keep track of how much each homeowner has worked? The association keeps a ledger that records each owner’s fee and the amount worked off. The residents sometimes trade among themselves, but it is rare because barter requires a coincidence of wants, as economists call it. Mary, an owner, needs some wood for a project and Jack has some extra wood. They could trade but Mary doesn’t have anything that Jack wants. He tells Mary to go down to the association office and take some of her time worked off her ledger and credit it to Jack’s monthly fee. Mary does this and they are both happy (Note #3).

As other owners learn of this idea and start trading work credits, the association realizes it needs a new system. It prints little pieces of paper as a substitute for work credits and hands them out to owners who perform services for the association. These pieces of paper are called Money (Note #4).

The money represents the association’s accounts receivable, the fees owed and accruing to the association, and the pay that the association owes the owners for the work they have done. Then the association notices that there are some owners who are not doing as well as others. It assesses an extra fee each month from those with larger homes and gives that money to needy homeowners.  These are called transfers because the owners who receive the money do not trade any real goods or services to the association. In this case the association acts as a broker between two people. Let’s call these passive transfers. We can lump these transfers together with exchanges of goods and services.

Then some people from outside the area start stealing stuff from the homeowners. The association needs to hire more security guards, but homeowners don’t want to pay a special one-time assessment to pay for the extra guards.

Instead of printing more Money, the association prints pieces of paper called Debt. Homeowners who have saved some of their money can trade it in for Debt and the association will pay them interest. Homeowners like that idea because Money earns no interest and Debt does. The association uses the Money to pay for the extra security guards.

But there are not enough people who want to trade in their Money for Debt, so the association prints more Money to pay the extra security guards.

Let’s pause our story here to reflect on what the words inflation and deflation mean. Inflation is an increase in overall prices in an economy; deflation is a decrease (Note #5). Inflation occurs when the supply of money fuels a demand for goods and services that is greater than the supply of goods and services. Ok, back to our story.

So far so good. All the Money that the association has printed equals a trade or a passive transfer. Let’s say that the association needs more security guards and no one else wants to work as a security guard because they can make more Money doing jobs for other homeowners. The association makes a rule called a Draft. Homeowners of a certain age and sex who do not want to work as security guards will be locked up in the storage room of the community center.

Now there’s a problem. Because the association has taken some homeowners out of the customary work force, those people are not available for doing jobs for other homeowners, who must pay more to contract services. This is one of several paths that leads to inflation. To combat that, the association sets price controls and limits the goods that homeowners can purchase. After a while, the outsiders are driven off and the size of the security force returns to its former levels.

Now all the extra Money that the association printed to pay for the security force has to be destroyed. As homeowners pay their dues, the association retires some of the money and shrinks the Money supply. However, there is a time lag, and prices rise sharply (Note #6).

Over the ensuing decades, there are other emergencies – flooding after several days of rain, a sinkhole that formed under one of the roadways, and a sewer system that needed to be dug up and replaced. The association printed more Debt to cover some of the costs, but it had to print more Money to pay for the balance of repairs. Because the rise in the supply of Money was a trade for goods and services, inflation remained tame.

There didn’t seem to be any negatives to printing more Money, so the homeowners passed a resolution requiring that the association print and pay Money to homeowners who were down on their luck. These were active transfers – payments to homeowners without a trade in goods and services and without some offsetting payment by the other homeowners.

So far in our story we have several elements that correspond with the real world: currency, taxes, social insurance, the creation of money and debt and the need to pay for defense and catastrophic events. Let’s continue the story.

With the newly printed Money, those poorer homeowners could now buy more goods and services. The increased demand caused prices to rise and all the homeowners began to complain. Realizing their mistake, they voted on an austerity program of higher homeowner fees and lower active transfers to poorer homeowners.

Because homeowners had to pay higher fees, they didn’t have enough extra Money to hire other services. Some residents approached the association and offered to repair fences and other maintenance jobs, but the association said no; it was on an austerity program and cutting expenses. Some residents simply couldn’t pay their fees and the problem grew. The association now found that it received less Money than before the higher fees and Austerity program. It cut expenses even more, but this only aggravated the problem.

Finally, the association ended their Austerity program. They printed more Money and hired homeowners to make repairs. Several homeowners came up with a different idea. There is another housing development called the Forners a few miles away. They are poorer and produce some goods for a lower price. The homeowners can buy stuff from the Forners and save money. There are three advantages to this program:

  1. Things bought from the Forners are cheaper.
  2. Because the homeowners will not be using local resources, there will be less upward pressure on prices.
  3. The homeowners will pay the association for the goods bought from the Forners and the association will pay the Forners community with Debt, not Money. Since it is the creation of Money that led to higher prices, this arrangement will help keep inflation stable.

As the homeowners buy more and more stuff from the Forners, the money supply remains stable or decreases. After several years, homeowners are buying too much stuff from the Forners and there is less work available in the community. As homeowners cannot find work, they again fall behind in paying their monthly fees.

Several of those in the association realize that they don’t have enough Money to go around in the community. There is a lot to do, and the homeowners draw up a wish list: repairs to the roads and helping older homeowners with shopping or repairs around their home are suggested first. A person who is out of work offers to lead tours and explain the biology of trees for schoolchildren. The common lot near the clubhouse could use some flowers, another homeowner suggests. I could use a babysitter more often, one suggests, and everyone nods in agreement. I could teach a personal finance class, a homeowner offers. Another offers to read to homeowners with bad eyesight and be a walking companion to those who want to get more exercise.

Everyone who contributes to the welfare of the community gets paid with Money that is created by the association. What should we call the program? One person suggests “The Paid Volunteer Program,” and some people like that. Another suggests, “The Job Guarantee Program” and everyone likes that name so that’s what they called it (Note #7).

So far in this story we have two key elements of an organized society:

  1. Money – a paper currency created by the homeowner association.
  2. Debt – the amount the association owes to homeowners (domestic) and the Forners (international).

Next week I hope to continue this story with a transition to a digital currency, banks and loans.

//////////////////////

Notes:

  1. In 2016, the top 20% of incomes with more than $200K in income, earned more than 2/3rds of the total interest and dividends. IRS data, Table 1.4
  2. In 2018 dollars, the publicly held debt of the Federal government was $4 trillion in 1990, and $16 trillion now. In 2018 dollars, interest expense was $500B in 1990, and is $600B now.
  3. In David Graeber’s Debt: The First 5000 Years, there is no record of any early societies that had a barter system. They had a ledger or money system from the start.
  4. In the Wealth of Nations, Adam Smith – the “father” of economics – defined money as that which has no other value than to be exchanged for a good. This essential characteristic makes money unique and differentiates paper money from other mediums of exchange like gold and silver.
  5. An easy memory trick to distinguish inflation from deflation. INflation  = Increase in prices. DEflation = DEcrease.
  6. The account of the increased force of security guards – and its effect on prices and regulations – is the simple story of money and inflation during WW2 and the years immediately following. The process of rebalancing the money supply by the central bank is difficult. Monetary policy during the 1950s was a chief contributor to four recessions in less than 15 years following the war.
  7. A Job Guarantee program is a key aspect of Modern Monetary Theory.

The Skittish Market

August 11, 2019

by Steve Stofka

I had some whole hazelnuts left over and left them out for the squirrels. They smelled them, tried to bite them, gave up and buried them in the ground. No surprise there. Squirrels bury food. But that got me to wondering. Do hazelnuts soften after a few weeks in the ground? If so, then that might be an indication that squirrels have some primitive notion of future time. I buried a few hazelnuts in the garden and dug them up this week. Still as hard as they were when I put them in there.  Maybe two weeks is not long enough.

We bury money, not nuts. We put it in banks and other institutions called “financial intermediaries” and hope that our savings grow into a big money tree over time. Our bank, mutual or pension fund sends us statements every month or quarter and tells us how big our tree has grown. Financial advisors caution us not to go out and look at our money tree every day. Why? Because sometimes the wind comes and breaks a few branches.

This past Monday was a bit windy. In response to escalating trade tensions, the Chinese yuan weakened in the global money market, and the Chinese central bank did not intervene as the exchange rate dipped below a key number of 7 yuan to the dollar. President Trump accused the Chinese of manipulating their currency because they had taken a free market approach much like the U.S. does. That’s the upside down world we live in now. If the Chinese don’t manipulate their currency, they are guilty of manipulating their currency.

The popular Dow Jones index dropped 3%.  How much is that? A little perspective might help. The financial crisis began when investment firm Lehman Brothers went bankrupt on September 15th, 2008. The stock market dropped 4.4%. A dip below a key number in the money exchange rate between China and the US was all it took to drive the market down a remarkable 3%. In short, the market is extremely sensitive right now to information. Don’t look at your money tree. Some of the branches have been broken.

How do the banks and pension funds grow our money trees? They loan the money out to people and businesses who need it. Unlike nuts and seeds, money doesn’t grow when left in the ground. Growth during the past decade of recovery has been slow but unemployment is at 50-year lows so demand for consumer credit is high – credit card rates are the highest in 25 years – over 17% (Note #1).

Here’s a graph showing credit card rates (the blue dots) and the prime rate (red line), the rate that banks charge their best business customers.

Here’s a chart of the spread or difference between the two rates. Notice that the spread decreases a few years before a recession actually occurs or banks get increasingly worried about a recession. Banks were already telegraphing their fears two years in advance of the 2008-09 recession.

As you can see, the current spread is increasing, not decreasing. Banks are not worried about getting paid because the economy is strong, and people are working. Credit card defaults are near all-time lows (Note #2). Interest rates are the price of money – the price of time. Banks are confident that they can raise their prices for people who want to borrow money.

Less than two weeks ago, the Fed cut interest rates for the first time in a decade. Chairman Powell cited concerns about global growth and warned that the market should not expect further cuts unless data justified such action. He called the ¼% rate cut a mid-course correction.

Conflicting signals – the “yes, buts” – drive market volatility higher. The economy is good. Yes, but the global economy is weakening.

Wage growth is slow. Yes, but unemployment and delinquencies are very low. Housing costs are through the roof and people won’t be able to keep up their payments. Yes, but annual increases in housing costs for the whole country are only 2-1/2 to 3%, the same as they were for most of the 90s and early 2000s (Note #3).

The yield curve recently inverted, meaning that short term rates are higher than long term rates. Yes, but workers in the retail industry are particularly vulnerable and their real weekly earnings are still rising (Note #4). The yes, buts.

As children we were told to go to sleep and we may have said, “yes, but I saw a spider on the ceiling, and I don’t want it to eat me while I’m sleeping.” It’s just a trick of the light, now go to sleep. “Yes, but I heard a mouse under the bed. What happens if it gets under the covers?” That’s just the wind outside, now go to sleep.

Not once did we worry before going to sleep, “Yes, but what about my piggy bank?” That’s what some of us do as adults. “Yes, but what if the financial crisis comes again and uproots my money tree and carries it up into the sky?” we ask. Close your eyes, now. Don’t listen to the market noise. It’s only the wind. Don’t look under your financial statement every minute for mice and bugs.

///////////////////////

Notes:

  1. Highest credit card rate in 25 years
  2. Credit card delinquency, FRED series DRCCLACBS
  3. Housing costs, FRED series CPIHOSNS
  4. After adjusting for inflation, median weekly earnings of full-time retail workers have risen 10% since the end of the recession. Annual earnings of $33,000 (in 2018 dollars) are far below the median $45,000 for all workers.

The Interest Rate Curve

August 4, 2019

by Steve Stofka

I was doing some work on various 1930s Depression era programs and ran across this precursor to Social Security call the Townsend Old-Age Revolving Pension. You can read more about it at the Social Security website in the notes below (Note #1).

The idea was to give people 60 years and older $200 a month. Pretty cool, I thought. Then I checked the BLS inflation calculator and found out that $200 at that time was equivalent to $3900 a month! That’s almost 2-1/2 times the average $1,461 a month that current Social Security recipients receive. The program was to be funded by a 2% national sales tax somewhat like the VAT tax in Europe. Seniors loved the program. They would be receiving twice what an average working person received each month.

A bill was introduced in Congress to adopt this plan; when the proponents of the program appeared at a Congressional hearing, it became apparent that they had not done any research on the amount of taxes needed to fund the program – more than half of the entire federal budget. The idea was shelved but inspired the creation of the Social Security program a few years later.

A unique feature of the plan was that recipients had to spend the money every month or lose whatever they did not spend. As the economy slowed down in early 2008, the Bush Administration sent out tax rebates to everyone in the hopes that the increased spending would stimulate the economy. A 2008 consumer confidence survey indicated that only a third of people spent the rebate (Note #2), but a 2009 Congressional Budget Office analysis indicated a higher percentage (Note #3).

In Obama’s first months in office after the 2008 Financial Crisis, the issue was a hot topic among policymakers and economists. The government could send out another round of rebate checks to people, but it couldn’t make them spend it to stimulate the economy. The Fed had cut interest rates to near 0%. What else could it do?

In an April 2009 NY Times op-ed, the prominent economist Greg Mankiw discussed a proposal that one of his students offered (Note #4). Essentially, the scheme was to announce a lottery that would invalidate 10% of all money. The nominal cost of holding money would go from 0% to -10%. By nominal, I mean excluding inflation which was zero or negative in early 2009. In advance of the lottery, people would want to hold as little money as possible. Would they spend it, or deposit it in the bank?  In today’s digital economy, most of us do not hold as much money as we did several decades ago. Would such a scheme encourage people to spend more?

I remember reading a suggestion at the time that the government should send credit cards to taxpayers instead of checks. The thinking was that people would have to spend the rebate instead of being saved or paying off debt. However, money is fungible, or interchangeable. After receiving my credit card loaded with $600, for example, I could pay my utilities or rent with that and put $600 in my savings account. I have spent nothing extra, which is what the government wants me to do.

If government can’t force people to spend money, then the government must spend the money directly to stimulate the economy during a downturn. But that leaves it to Congress to decide what to spend the money on and that is a long and difficult process of debate and competition for political and economic power.

It has been more than ten years since the financial crisis. That’s ten years of some very smart and experienced people trying to think of solutions to the next crisis, whenever it comes. No one has been able to come up with a workable solution. I think that’s why the Fed announced a small decrease in the prevailing interest rate this week. In the face of some weaker manufacturing data in this country and around the world, they are trying to steer the economy away from any rocky shore. 

Have policymakers unwittingly crafted a financial world that can no longer cope with the normal downs in a business cycle? There are imbalances that build up during an expansion. A downturn is a correcting mechanism. After ten years, the Fed hasn’t been able to raise rates to a normal 3-4%. Because developed countries around the world have large debts that they must service, central banks are pressured to keep interest rates low.  The low rates entice companies to borrow money to buy back their own stock to make their future earnings more attractive to equity buyers. The low rates fuel robust credit growth among consumers who feel more confident in the future as stock prices continue to rise. The money spent spurs more growth. Eventually, the growth rate of employment and house prices and credit slows to zero. Then comes the downhill part. I think the Fed knows that the brakes on this economy are not working very well and are taking us down a road where the downhill might be more gradual. I hope.

////////////////////

Notes:

  1. The Townsend Old-Age Pension program
  2. A preliminary analysis 2008 tax rebate
  3. A CBO analysis of the 2008 tax rebate
  4. Greg Mankiw’s NY Times op-ed “It May Be Time for the Fed to Go Negative.”

Growth Periods

July 28, 2019

by Steve Stofka

Did you know that housing costs double every twenty years? The predictability surprised me. Both rents and home prices double. Based on the last forty years of data the average annual increase is about 3-1/2% (Note #1).

House prices can only get ahead of earnings for so long before a correction occurs. Take a look at the chart below. Yes, low interest rates reduce mortgage payments so people can afford more home. That’s what we said in the 2000s. This trend does not look sustainable to me.

I was doing some work on potential GDP and wondered which president since World War 2 has enjoyed the longest and strongest run of real (inflation-adjusted) GDP above potential. Potential GDP is estimated as a nation’s output at full employment.

I won’t start with the #1 award because that would be no fun. Nixon came in fourth place with a run of strong economic growth from 1971 – 1973. The oil embargo that followed the Arab-Israeli War of 1973 sent this country into a hard tailspin that ended that growth spurt.

Ronald Reagan comes in third with a cumulative total of 24.5% growth above potential GDP. The expansion began in the third quarter of 1983 and ran through the second quarter of 1986. These strong growth periods seem to last two to three years.

Second place goes to President Truman with a short (less than two years), sharp 25.2% gain that ended with the beginning of the Korean War.

And the award goes to…the envelope please…Jimmy Carter. Wha!!? Yep, Jimmy Carter. The growth streak began in 1976, the year Carter was elected, and ended in 1979 when Iran overthrew their Shah, oil production sank, and oil prices doubled. At its end, the expansion had totaled 25.5% above potential GDP. In less than two years, the nation soured on Carter and put Reagan in office.

What about other Presidential administrations? We might remember the late 1990s as a heady time of skyrocketing stock prices during the second Clinton administration. The output above potential was only 11.5% but is the longest period of strong growth, lasting almost four years, from the first quarter of 1996 through the last quarter of 1999.

George Bush’s growth streak was only slightly higher at 12.8% but is the second longest growth period, beginning in the third quarter of 2003 and ending in the last quarter of 2006. A year later began the Great Recession that lasted more than 1-1/2 years.

Barack Obama’s presidency began with the nation deep in a financial crisis. By the time he took office fourteen months after the recession began, the economy had shed 5 million jobs, 3.6% of the employed. Employment was more than 6 million jobs below trend. The economy did not start growing above potential until the first quarter of 2010. The growth period ended in the third quarter of 2012, but employment did not regain its 2007 pre-recession level until May of 2014, 6-1/2 years after the recession began. It is the weakest strong growth period of the post-WW2 economy.

President Trump’s streak of strong growth began in the last few months of Obama’s term and is still ongoing with a cumulative gain of 7.5%. Unlike other growth periods, this one is marked by steadily accelerating growth above potential.

I’ve charted the cumulative growth above potential and the period length for each president.

As the economy shifted away from manufacturing in the 1980s, the days of 20-plus percent growth ended. Manufacturing is more cyclic than the whole economy. The manufacturing sector contributes to strong growth in recovery and pronounced weakness at the end of the business cycle each decade. In the 1980s, economists and policy makers in both government and the Federal Reserve welcomed this shift away from manufacturing. They dubbed it the Great Moderation and it ended twenty years later with the Great Recession.

President Trump is on a mission to begin another “Great” period – the resurgence of manufacturing in America. It is a monumental task because manufacturing depends on a supply chain that is presently located in Asia. In 2013, Apple tried to manufacture and assemble its high-end computer, the Mac Pro, in Texas. Production faltered on the availability of a tiny screw (Note #2). Six years later, the Trump administration is levying 25% tariffs on Apple products to encourage them to manufacture computers again in Texas.

The widespread use of tariffs usually leads to fewer imports. As other countries retaliate, exports decrease. Slowing global growth poses additional challenges to repatriating manufacturing to this country. If Trump can realize his passion, we may again return to those days of heady growth and more severe business cycle corrections.

////////////////////

Notes:

  1. The Case-Shiller home price index (HPI) for home prices. The Consumer Price Index’s rent of a primary residence.
  2. A NY Times account of Apple’s last attempt to manufacture in the U.S.A.

View From The Top

July 21, 2019

by Steve Stofka

Several Democratic Presidential contenders have painted a target on the top 1%, claiming that they have not paid their fair share of taxes. After the 1986 Tax Reform Act, those in the top 1% paid 26% of their income in taxes. Thirty years later and they paid the same percentage, even though their incomes had grown 50% in real dollars, according to an analysis of IRS data from 2016 returns (Note #1).

Other high-income brackets have experienced modest income gains and small increases in their average tax rates. In 1987, the top 10% of incomes paid 20%. In 2016, they paid 21%.

The average tax rates of the top 25% of incomes has increased from 16.5% to 18.5% in thirty years. As a group, the effective tax rate of the top half of incomes has increased from 14.6% of income in 1987 to 15.6% in 2016. While the top half has gone up a percent or two in the past three decades, the bottom half of incomes have paid a decreasing share of their income – falling from 5% to 3.7%.

The lesson? Changes in tax rates occur very slowly. A candidate who promises big changes quickly is facing formidable odds.

How much income does it take to get into the top half of incomes? Only $40K (Note #2). I was surprised how low the amount was and it hasn’t changed much in the past thirty years. In 1987, the income threshold to be in the top half of incomes was $17,768 – $38,500 in inflation adjusted dollars.

Want to be part of the upper class? All it took in 2016 was $81K, 9% more than it did in 1987, to be a part of the top 25%. How many workers making modestly good incomes in Los Angeles, San Francisco, New York City or Boston feel like they are upper class? After tax income is about $56K and rent in a middle-class neighborhood of L.A. can be 45% of that disposable income. That’s two paychecks toward rent. One paycheck for bills. One paycheck for food and miscellaneous. Ooops, just ran out of paychecks, didn’t you? Welcome to the upper class.

The threshold to get into the top 1% has increased a lot – from $302K to $480K in real dollars – a jump of more than 50%. Those are the people who are still paying the same percentage of their income in taxes. Their share of the total income pie has risen from 12% to 20% in thirty years (Note #3).

In the past thirty years, incomes have stretched upward by 50% for those at the tippy top. As a group their share of income taxes paid has kept pace with income growth, increasing from 24% to 37% of total personal income taxes collected (Note #4). The top 1% can say, “Yes, we are doing better, and we are paying proportionately more.” Can one of the Presidential contenders convince the Congress to get more out of that top 1%?

///////////////////

Notes:

  1. At the top of the analysis is a link to the Tax Foundation’s summary tables. Table 8 of that summary shows effective tax rates of the various income brackets. Here’s a link to the summary tables themselves.
  2. Table 7 from the summary tables.
  3. Table 5.
  4. Table 6.

The Politics of Compassion

July 14, 2019

by Steve Stofka

It was a busy week in Washington. Jerome Powell, the chair of the Federal Reserve, testified before a House subcommittee. His dovish remarks signaled Wall Street traders that the Fed would almost certainly lower interest rates at their next meeting on July 30-31 (Note #1). The market rallied to new highs even as investors continued to transfer funds from stocks to bonds during the past month (Note #2).

Not so dovish was the atmosphere at a House subcommittee hearing this week on immigration proceedings at the southern border. Very emotional testimony from several freshman House members who had visited immigrant detention facilities in Texas. The former head of ICE under Presidents Obama and Trump testified about the challenges that border patrol officers face under the surge of immigrants. Human and drug trafficking along the southern border has been at crisis levels for many months. Patrol officers are not trained to be social workers or medical attendants but find that most of their time is spent caring for people who lack the physical stamina necessary to navigate the harsh conditions of the deserts of northern Mexico.

Many immigrants are sick or injured after a long treacherous journey from Central America. The crowded facilities pose a challenge even for healthy immigrants. They are certainly no place for mothers with young children, but neither was Ellis Island (Note #3). However, most of the immigrants at Ellis left the building after several hours (Note #4).

I was reminded of my grandmother and aunt who were turned away twice for whooping cough and pink eye. It was easy to pick up contagious diseases on the 7-10 day journey in third-class quarters on a crowded transatlantic steamer a century ago. Processing hundreds of immigrants a day, doctors at Ellis Island were quick to reject those with even the hint of TB or trachoma (Note #5). In the years before World War I the northern states needed workers and government officials were largely forgiving of many disabilities and illnesses. Less than 2% of immigrants were deported. My family was one of the unlucky ones – twice. My grandfather waiting on the Manhattan shore a few miles away must have been confused and angry.

Some Americans are insistent that immigrants should follow our Constitution, but our founding document has little to say about immigration. Article 1, Section 8 states that the Congress shall “establish a uniform rule of naturalization.” End of story. For the first hundred years of our nation’s existence, each state processed immigrants. Many immigrants did not present any paperwork or pass a medical examination. State and Federal governments simply took an immigrant’s word as to their name and personal information. Those who insist most loudly that immigrants follow our laws may be descended from people who followed no laws when they immigrated into our country.

In 1891, Republican President William Henry Harrison signed into law the Immigration Act of 1891 passed by a Congress dominated by Republicans (Note #6). Republicans represented the interests of northern businesses who needed able bodied workers who were unlikely to become dependent on government for their care. The flood of immigrants into the northern states gave Republicans additional congressional seats and an edge over Democratic majorities in the southern states.

The founding documents of this country were forged in the fires of heated debate and hard bargaining (Note #7). In 230 years, the debate has not cooled. Today, Democratic majority states like California and New York stand to gain Congressional seats as they welcome and champion the rights of immigrants. While the Senate has a filibuster rule, only the Democratic Party can fix our broken immigration laws because they are the only ones capable of securing a filibuster-proof majority in the Senate. The Republican Party has not enjoyed such a majority since Senators were first popularly elected in 1914. If Republicans are ever going to take the lead on contentious issues, they will have to abandon the Parliamentary filibuster that chokes most legislation to death in the Senate.

Why didn’t the Democratic Party address the issue of immigration while they had a filibuster-proof majority in the Senate and controlled the Presidency and House? Was it not important then? Nancy Pelosi was House Speaker then and now. She is known for her political ability to “count votes.” Perhaps she would be more effective if she looked further than votes. In a deeply divided nation with a constitutional architecture that resists change, a resolution of our most intractable problems is a formidable challenge for any leader.

After the Financial Crisis in 2008, Pelosi helped patch together two large pieces of legislation under Obama’s first term. ARRA was an $800B stimulus package passed in February 2009 that did help keep unemployment from getting even worse but was ineffective in many areas because the stimulus was diluted over several years (Note #8). That and the passage of the controversial ACA, dubbed “Obamacare,” cost the Democrats dearly in the 2010 midterm elections. Obamacare has withstood both legislative and judicial assault but may fall sometime this year to yet another judicial challenge that was just heard by the 5th Circuit Court of Appeals. That’s a topic for next week’s blog.

///////////////////

Notes:

  1. Schedule of Fed meetings
  2. ICI flow of funds
  3. Crowded main hall at Ellis Island
  4. Relatively short processing time at Ellis Island
  5. Medical examinations of immigrants at Ellis Island
  6. Immigration Act of 1891
  7. Michael J. Klarman’s “The Framer’s Coup” is a thorough account of the construction of our nation’s Constitution. The audio book
  8. ARRA – the American Recovery and Reinvestment Act of 2009

Working Class Blues

July 7, 2019

by Steve Stofka

This week I had a chance to watch two documentaries hosted by journalist Bill Moyers several years ago (Note #1). They featured the shifting fortunes of two blue-collar working-class families in Milwaukee. Each family had enjoyed the security and benefits of middle-class life – a house and dreams that they would send their kids to college one day. When each breadwinner lost their jobs in the manufacturing industry, they realized just how precarious their situation was.

With more education and skills, these blue-collar workers could have made a better transition. Higher education is certainly a solution for some but how will more education help the butcher, the baker and the candlestick maker? These professions play a part in our complex society and the marketplace has not found a viable solution for those workers and their families.

What is the middle class? The Census Bureau defines it as the middle three quintiles of income (Note #2). What does that mean? If incomes range from $0 to $100 the range of the middle class is from $20 to $80. Some economists use $25 and $75 as the upper and lower bounds of the middle class. A hundred years ago the middle class was a small sliver of the population in the middle. They were between the working class who relied almost entirely, if not exclusively, on work for their income, and the upper class whose major source of income was not work – profits, interest, dividends and rents.

When economists talk about the middle class, it is usually the lower middle-class or working class that they use to represent the fortunes of a wide range of people with far different circumstances, education and skills. Both videos focused on that working-class segment because the stories are poignant and the solutions difficult, if not intractable.

The Golden Age of the working class was after World War II when unions were strong and blue-collar incomes grew much faster than inflation. After the productive capacity of much of developed world had been destroyed during World War II, America was the factory for the world. The workers in those factories enjoyed strong bargaining power and could command a good benefit package and wage gains from employers.

Until the Roosevelt administration established housing and mortgage programs during the decade of the Great Depression, most families had to put a third to a half down on a house and pay off the mortgage in five to ten years. The FHA (1934) and FNMA (1938) lowered those requirements to as low as 10% (Note #3). The GI bill that was passed in 1944 promised returning GIs a home for little to nothing down and low-interest long-term mortgages.  Residential construction boomed.

As the European nations and Japan recovered in the 1960s and 70s American firms were challenged by low cost imported goods. As their pricing power eroded, they became more resistant to wage and benefit demands by working-class unions. Protectionist policies guarded against competition from foreign auto makers, but consumer buying power in America was a magnet for appliances and electronics from Japan and Germany, and foodstuffs from France, Spain, Italy and Mexico (Note #4).

The 1970s was beset by a series of bitter strikes in both private industry and in government service. The benefit and wage packages that union workers had negotiated in the 50s and 60s proved uncompetitive in the revived private international marketplace. Those who could afford the higher taxes to pay city workers began to move out of the cities to the suburbs. Cities like New York suffered under successive waves of strikes by fire, police, sanitation and transportation workers. If the firefighters got a 4% raise, other city workers wanted a similar wage package.

Rather than invest in refurbishing decades-old factories, manufacturers built new factories abroad, where labor costs were much cheaper. The savings more than offset the shipping costs of finished products back to America. Those shipping costs had been drastically reduced in 1955 when a transport owner and an engineer designed a shipping container that could be stacked and survive the rigors of an ocean voyage. They gave away the patent and the world adopted the new containers (Note #5).

As the manufacturing plants in the northern states, particularly the Rust Belt, began to shutter their doors, some families moved. Many families who had bought homes now found that the value of their homes had depreciated. Some with strong ties to the community and a lack of savings struggled on at lower paying jobs. Some lost their houses, their cars, their dreams. The two families that Bill Moyers interviewed exemplified this broad trend. 

For some journalists and economists, this short-lived post-War era became a benchmark for the way it should be. That benchmark may have been a historical anomaly, an aftermath of a global war.

What is to be done? Since the Johnson Administration ushered in the War on Poverty fifty years ago, the percentage of the population in poverty has not changed (Note #2). 42% of children born into poverty remain in poverty. Either the programs have been poorly designed, or the problems are complex and resist solutions.

Will raising taxes on the rich help? Most of the capital gains go to the upper class who pay lower taxes on those gains. Is that the solution? To fund their retirement, millions of seniors each year are selling some of their IRAs and 401Ks, and incurring capital gains when they do so. Will politicians change the rules in midstream on a generation of Boomers? Old people vote in high percentages. Probably not.

Some suggest that the government stop subsidizing rich people and give that money to people who need it. This would include means testing Social Security, but also include a plethora of “gimmes” that pass unnoticed to most of us from government to those who are well-off. Some farmers receive a check from the government to not grow crops in order to control the supply. “Dear Santa, do not give me money this year.” Who is going to write that note?

Some have suggested we implement a Universal Basic Income (UBI) program, a program which would give $1000, for example, to everyone. That would be a nice subsidy for Walmart and McDonald’s who could then pay their workers even less than they do now. Some economists argue that there are even more problems (Note #6).

What about a higher Federal minimum wage? $15 is a popular suggestion on the campaign trail. A $15 wage in Los Angeles has much less buying power than it does in Alamosa, CO. Why not implement something indexed to the median wage in each area? The BLS, the same agency that produces the employment report each month, has the data to implement such an idea. Why a one size fits all minimum wage? Those who prefer local solutions are not without compassion.

History tells us that large government solutions can exacerbate the very problems they were meant to solve. The housing assistance and student loan programs are examples of the bureaucratic bramble that characterizes active Federal programs. Given that caveat, I do think that a Job Guarantee program that operated at the state and local level but was funded by the Federal government would provide stability to the more vulnerable in our work force. It would reduce the cyclical and structural unemployment that corrodes our society (Note #7). There are several proposals to implement some trial programs in the states and I support those efforts. What do you think?

//////////////////////////

Notes:

  1. Frontline’s Two American Families and Moyers & Co. Surviving the New American Economy
  2. A 2018 Census Bureau presentation (PPT) of income and poverty in the U.S.
  3. History of Government housing programs
  4. In 1964, the Johnson Administration enacted the “chicken tax,” a 25% import tax on imported autos
  5. History of Shipping Containers and the free of patent innovation that changed international commerce
  6. Economist Daron Acemoglu argues against a UBI program
  7. Search for Job Guarantee and choose the depth that you want to explore on this topic. On Twitter, #JG for many sources.

A Nation of Farm Kids

June 30, 2019

by Steve Stofka

This week the Supreme Court ruled that the administration had not provided an adequate reason to include a proposed citizenship question on the 1920 census. Here’s a snapshot of that section of the census form (Note #1).

This week I’ll look at past census questions through the lens of personal family history – completed copies of census pages. In 1850, the Census first asked people their place of birth and naturalization status. For a hundred years, the census asked the question until the topic was dropped for the 1960 census (Note #2).

In 1860, just before the Civil War, some of my family ancestors were farmers in Mississippi. All forty people listed on that census page had been born in a southern state, most from Mississippi or Alabama.  The Education section of the census did not yet ask whether a person could read and write; only whether each person had attended school in the past year. Fourteen out of forty people listed on that census page had gone to school. There was only one child of school age who had not attended school. A rural farming community in the deep south with limited resources made sure that their children could read and write. That was an essential part of the American project.

In drafting the 14th and 15th Amendments after the Civil War, there was some discussion about adding an English language requirement for voting. At that time, German was the second language of America and was the most taught foreign language in schools. Considering the industriousness and good character of German men, lawmakers decided against such an exclusion. Fifty years later, in the midst of the WW1, Americans would excoriate the hated “Hun” and demean the character of many German immigrants. War changes attitudes.

Let’s skip ahead to the 1900 census taken in a Texas county east of Dallas. The question can you read and write had been added to the census. In a rural farming community, only four out of fifty people listed on that census page could not read and write. All were adults. One was over fifty. All the children aged eight and above were literate.

Let’s travel in time and space to an environment that couldn’t be more unlike rural Texas – the lower east side of Manhattan for the 1930 census. Of the fifty people listed, all adults were immigrants, most of them from eastern Europe. The earliest on that page had arrived in 1890; the latest was just a year earlier, in 1929. All except four people from Russia could read and write. The census asked the language spoken in the home before they came to America. Most people on that page answered Yiddish, except my grandparents, who spoke Slovak. My grandmother, a woman from a rural farming community, could read three languages. It was all part of growing up in the Austro-Hungarian Empire. By the time she died, she had added English to that list. I imagine that the Yiddish speakers had some familiarity with German and Hebrew. How many of us today can read several languages?

The farmers from western Europe had spilled out into the farms of America during the 19th century. In a second wave near the turn of the century, many farmers from eastern and southern Europe found work in the rural communities of the northern states. Many, like my grandparents, crowded into the dense streets of New York City when they first arrived. They worked hard because farm kids learn about hard work as they grow up.

A new generation of farm kids is arriving, but not by ship. They are coming from areas to the south that have been hit hard with drought, violence and political corruption. They come from hard work for little pay (Note #3). They have not waited in line for years to come into this country. Instead, they are showing up at the southern border just as many of our ancestors showed up at Ellis Island and other eastern ports.

Most of us in this country are the descendants of farmers who made sure their kids could read and write. That is the heart of the American spirit: character, hard work and education. Maybe the Congress needs to rewrite the laws so that they conform with the rules that we carry in our hearts and our guts from our parents and their parents and their parents…

//////////////

Notes:

  1. Some background on the 2020 census question from Pew Research
  2. Short history of census questions and index of past census questions
  3. See the six part series “Borderland” ( https://www.imdb.com/title/tt3300988/ for info). Six Americans follow the routes of migrants from Central America. An Idaho farmer experiences grueling work for little pay and understands the attraction of his farm to these migrants where they can make 5x as much or more harvesting crops.

Interest Rate Ceiling

June 23, 2019

by Steve Stofka

After the Federal Reserve meeting this week, traders are betting on a cut in interest rates in July and the market hit all-time highs. Is a cut in interest rates warranted at this time? Such an action is usually taken in response to weak employment numbers, a decline in retail sales or sluggish GDP growth. Let’s review just how good the economy is.

Unemployment is at 50-year lows. The percent of people unemployed more than fifteen weeks is near the lows of the late 1990s. At almost 18 million vehicles, auto sales are near all-time highs. Real retail sales continue to grow more than 1% annually. In the first quarter of this year, real GDP growth was over 3%. Ongoing tariffs may cause real GDP to decline one percent but a growth rate above 2% is above average for this recovery after the financial crisis.

Corporate profits have been strong. In fact, that may account for the volatility of the past two decades. The chart below is after tax corporate profits (CP) as a percent of GDP. The multi-decade norm is in the range of 5-8% but the past twenty years have been above that trend except for the plunge in profits and GDP during the GFC.

Companies have paid part of those extra profits as dividends to shareholders who tend to be cautious pension funds or older, wealthier and more cautious individuals.  Some profits have been used to buy back shares and boost the return to existing shareholders.

Despite the above average profits, investors still have a strong thirst for lower yielding government debt. Why? The Federal Reserve has kept interest rates below a market equilibrium, which is currently about 3.8%, far above the current 2.4% federal funds rate (Note #1). As with any price ceiling, the below-market price creates a shortage. In this case, the shortage is in the capital investors want to supply to governments to meet the demand for capital. Consequently, investors have been searching for alternative substitutes or near-substitutes. That distortion is being reflected in stock market prices.

Despite a strong economy and corporate profits, the SP500 has gained less than 5% from its peak high in February 2018 after the passage of the 2017 tax cuts. Including dividends, the SP500 has gained just 5.7% in 16 months. If we turn the clock back a few weeks to the end of May, the total return of the SP500 during the past fifteen months was a big, flat zero. Those gains of the past sixteen months have come in the past three weeks on the hope and the hint of rate cuts.

An intermediate bond ETF like Vanguard’s BIV has returned 5.2% in the same period. On a scale of increasing risk 1-5, with 1 being a safe investment, BIV is rated a 2. The SP500 is rated a 4. Investors buying the broad stock market have not been rewarded for the additional risk they are taking.  How long will this situation persist? For as long as the Fed keeps a price ceiling on interest rates.

///////////////////

Notes: A popular model of equilibrium interest rates is the Taylor rule proposed in 1993 by John B. Taylor, a member of the Council of Economic Advisors under three presidents. The Atlanta Fed has a utility that calculates the current rate and allows the reader to change the parameters. Click on the graph icon, accept the default parameters and the utility graphs the equilibrium rate and the historical Fed funds rate.