Dynamic Portfolio Allocation

March 27, 2016

Happy Easter!

Before I take a look at a dynamic allocation model for older readers, I’ll quote from a paper published in the last decade: “adequate savings is the primary driver of retirement success and is approximately 5 times more important than Asset Allocation.”  For readers who are not near retirement, what is called the accumulation phase of life, the one word that sums up a lot of financial advice is “Save.”

A reader sent me an article that recounts several common sense strategies for investors nearing or in retirement.  I was especially interested in a strategy for recent retirees: to have a cautious 30/70 stock/bond allocation in the first years of retirement and transition to a more agressive 60/40 portfolio over 10 – 15 years. Is this madness?  Conventional advice advocates more caution in the later years of life.

The initial conservative approach is designed to minimize the negative effects that a bear market would have on a portfolio in the first years of retirement.  At seven years old, the current bull market is long in the tooth, so to speak. One of the authors of the article is Wade Pfau, whose Retirement Researcher site I include in my blog links in the right column of this blog.  I have a lot of respect for Mr. Pfau’s work and his sensibilities so I was inclined to trust this recommendation.

In order to forecast, one has to backtest, and the authors have more sophisticated portfolio allocation testers than many of us have.  I have recommended before a free allocation tester at Portfolio Visualizer.  Their web site also has a free Monte Carlo simulation tool (MC).  What the heck is that, you ask?

For Dr. Who fans, an MC is like a time trip in the doctor’s Tartus.  First we set the thing jab on the whozee panel, spin the furbee wheel clockwise to go forward in time, then stand one pace to the left – do not stand on the right! – of the big lever as we pull the lever knob.

For those of you without a Tartus, an MC uses historical returns and creates a number of what-if possibilities based on variable parameters like the period of time to run the simulation, the inflation rate, the withdrawal amount or rate, the asset mix, etc.  If I start out with $1M in savings at age 65, for example, and I take out $40,000 each year adjusted for inflation, what are the chances I will have any money left after thirty years, at age 95?  Will the Daleks catch up with my savings and exterminate it?  No, not the Daleks!

The remaining balance, the money a person would have left, is ordered by percentile: 25%, 50%, the median, and 75% are common. Example:  A remaining balance of $500K for a certain allocation at the 75% percentile means that 75% of retirees will have less than that amount.

A success rate is computed; a 75% success rate means that you don’t run out of money in 75% of the simulations.  What about the other 25% of the time?  Care to roll the dice on that one? A 90% success rate is considered a desireable minimum in the industry.  I tend to focus on both the success rate and the median balance.

If using historical asset prices as a basis for computing future possibilities, an important assumption is the time period.  If the past forty years have included some really good returns for a few decades, then the MC results will be optimistic.  What if the next twenty years are not so good?  Move in with your kids?

Using the historical data of the past 20 years or 40 years as a basis for future returns is a bit optimistic, I think.  During this past twenty years, bond prices have been inflated by extraordinarily low interest rates set by the Federal Reserve.  The price of a composite of intermediate corporate bonds, Vanguard’s VFICX mutual fund, has almost quadrupled since 1995.  A 60/40 stock/bond mix has returned 9.5% over the past 20 years.  We are unlikely to see such returns in the future.  My gut instinct is to err on the side of caution and assume a 7.5% return on a 60/40 mix, and a 6% return on a 30/70 mix.

Here’s the assumptions:  $1M initial portfolio; 30 year future period; withdraw an initial $45K adjusted annually using a 3% inflation rate.

.nobrtable br { display: none } td {text-align: center;}

Stock/Bond % Success Rate Median Bal
30/70 57 $278K
60/40 73 $1.6M
30/70 –> 60/40 92 $1.7M

Using a 30/70 mix for the first 5 years and a 60/40 mix for the following 25 years gives a median balance of $1.7M after 30 years, about the same as the 60/40 mix above BUT the success rate shoots up to 92%.   The authors suggest a gradual transition but this simple simulation shows the advantage of a dynamic allocation strategy.

In short, this does look like a good strategy.

Readers who want to use the more optimistic historical returns of the past 20 years would see these simulation results:

Stock/Bond % Success Rate Median Bal
30/70 92 $2.7M 10 times higher!
60/40 88 $4.3M
30/70 –> 60/40 92 $4.3M

Using historical returns for the past 20 years sure pumps up the median balance on the conservative allocation.

///////////////////

Existing Homes

Existing Home sales fell 7% in February.  Mortgage rates are at all time lows.  What’s going on?
Below is a chart of the ratio of Existing Home Sales to New Single Family Homes.  As you can see, the ratio has remained fairly steady over the past several years.  The spike in the ratio in early to mid 2013 coincided with historically low mortgage rates (Money) .   In the last quarter of 2015, this ratio started sinking despite the stimulus of low interest rates.  Are home buyers at all levels being priced out of the market?

////////////////////////

The Immigration Carousel

The 1900 census counted a total population of 78 million, of which 13% were foreign born. Responding to a growing hostility toward immigrants, Congress passed strict quota laws for immigrants in 1921 and 1924. Regarded as lazy, shiftless, boorish, stupid, or criminal, southern Europeans were among the undesireable groups.  During the 1920s, the foreign born population began to decline and, beginning with the 1950 census, stayed below 8% for 40 years.

The 2000 census counted 11% of the population as foreign born. The 2010 census counted 13% foreign born, so that our population mix now matches that of the early 20th century.

It is hardly surprising then to see a growing antipathy towards immigrants in the past decade.  Donald Trump’s candidacy is partly fed by the same anti-immigrant sentiment prevalent in the America of one hundred years ago.  We like to think we have put some crude and cruel instincts behind us, but we are again confronted with our “herdness.”  We will tolerate “others” as long as their percentage of the herd remains relatively small. In America, that tolerance limit seems to be 10% foreign born. How does America compare to other countries?

The Donald and the Washington Post

March 22, 2016

The editorial board and several other employees at the Washington Post recently sat down with Donald Trump.  Here is a transcript of the conversation .

Here are some highlights.   Donald rambles a lot but I think I got the kernel of his responses.  I think my edited version does Donald more justice than the sometimes incoherent responses he actually gave. He really is not ready for prime time. At this point in the campaign his responses to questions about foreign policy, international trade, and other issues mentioned on the campaign trail should be more practiced, not the rambling sentiments that any of us might have in a conversation with a co-worker at a lunch break.

WP = Editorial staff at Washington Post, DT = Donald Trump.  I’ve included some context where I thought it might be needed.

WP: “is there a secretary of state and a secretary of defense in the modern era who you think have done a good job?”

DT: “I think George Shultz [Reagan’s Sec’y State] was very good, I thought he was excellent.”  “I think your last secretary of state [Hillary Clinton] and your current secretary of state [John Kerry] have not done much.”  Trump uses the word “your” to indicate that media institutions are partisan and biased, and including the WP in the liberal media. It indicates that Trump’s essential sense of the world is polarized, a game of warball.  That may be the case in Washington but it mutes Trump’s appeal among independent voters who have less polarized outlooks. Trump offered an example of Kerry’s bad negotiating tactics with Iran: “We should have had our prisoners before the negotiations started.”

In response to a question about promoting values like democracy and freedom around the world,
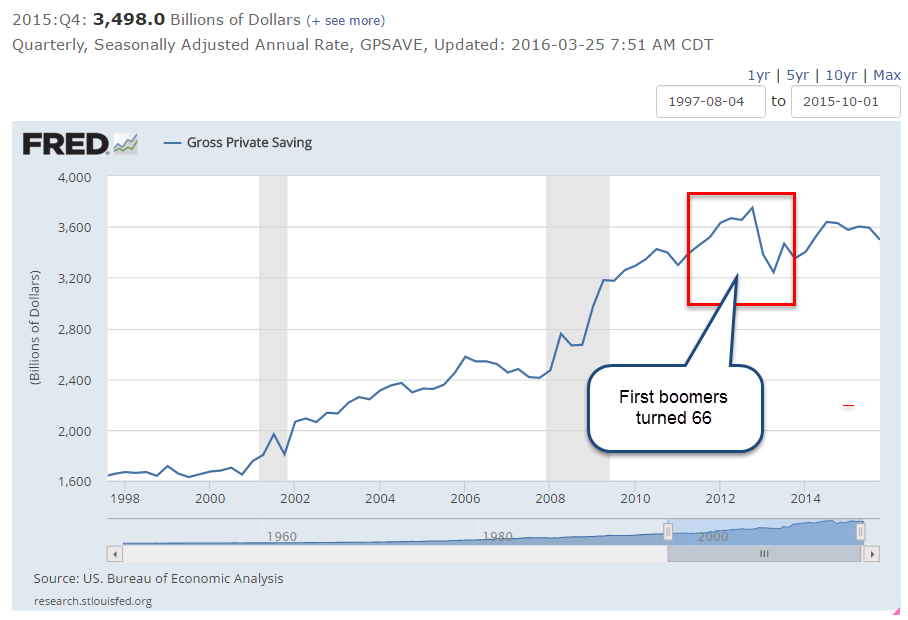
DT: “I don’t think we should be nation building anymore,” indicating that he is not a neo-con. “We’re sitting probably on a bubble and, you know, it’s a bubble that if it breaks is going to be very nasty. And I just think we have to rebuild our country.”   Trump is not the only person who thinks that extremely low interest rates for seven years have over inflated stock, bond and housing values.  Trump immediately changes the subject and endorses infrastructure spending, aligning himself with economists Paul Krugman, Robert Frank, and others who recommend large Federal stimulus programs to repair infrastructure and employ those with low to modest educational backgrounds.  Trump recalls that we built schools in Iraq, and rebuilt them several times when they got bombed “and yet we can’t build a school in Brooklyn. We have no money for education, because we can’t build in our own country. And at what point do you say hey, we have to take care of ourselves. “

WP: “So what would you do for Baltimore [as an example of a city with troubled inner neighborhoods]”

DT: “I’d create economic zones. I’d create incentives for companies to move in. I’d work on spirit because the spirit is so low… unemployment for black youth in this country, African American youth, is 58-59 percent.”  These are called enterprise zones and have been used with mixed success in the U.S. but particularly in Britain.  See this article

WP: “in general, do you believe there are disparities in law enforcement?”

DT: “I’ve read where there are and I’ve read where there aren’t…I have no opinion on that.  We have to create incentives for people to go back and to reinvigorate the areas and to put people to work…we have lost million and millions of jobs to China and other countries.”   When Trump doesn’t like the topic, law enforcement, he switches subjects to an old refrain, jobs lost to China, and now Mexico. “Mexico is really becoming the new China.”

WP, returning to the topic:  “There is disproportionate incarceration of African Americans vs. whites. Is that something that concerns you?”

DT: “It would concern me. But at the same time it can be solved to a large extent with jobs.”  Some economists and social scientists have championed this idea that people in poor neighborhoods will choose  legal employment if presented with better job prospects.  Over time, residents in the area will become more committed to the neighborhood, to the protection of their property, to law and order.

WP: “Baltimore received a lot of federal aid over the years. What’s different specifically about your approach to these issues from what’s been tried in the past, because a lot of effort has been put in just the direction you just described.”

DT: “I think what’s different is we have a very divided country.”  He goes on about how divided the country is, as if we didn’t already know that.  How does that answer the question about Baltimore? “I thought that President Obama would be a great cheerleader for the country. And it just hasn’t happened. You have to start by giving them hope and giving them spirit and that has not taken place. I actually think I’d be a great cheerleader for the country.”

WP: “What presidential powers and executive actions would you take to open up the libel laws?”

DT: “I’ve had stories written about me … that are so false, that are written with such hatred.  I think libel laws almost don’t exist in this country.  I think that [the media] can do a retraction if they’re wrong. They should at least try to get it right. And if they don’t do a retraction, they should, they should you know have a form of a trial. I don’t want to impede free press, by the way.”

WP: “So in a better world would you be able to sue [the Post]?”

DT: “In a better world I would be able to get a retraction or a correction. Not even a retraction, a correction.”

WP: “Would you require less than [actual] malice for news organizations?”  “Actual malice” is a legal standard, a criteria for liability for libel set up the Supreme Court in 1964.  See below.

DT: “I would make it so that when someone writes incorrectly, yeah, I think I would get a little bit away from malice without having to get too totally away.”  What does that mean?

WP: “How are you defining ‘incorrect?’ It seems like you’re defining it as fairness or your view of fairness rather than accuracy.”

DT: “Fairness is… part of the word. I’ve had stories that are written that are absolutely incorrect. I’ll tell you now and the word ‘intent’, as you know, is an important word, as you know, in libel.”  Trump then gives an example of a news account of a protester at a Trump rally.  The video tape is edited to make Trump supporters look guilty of unprovoked violence.  Trump says these are professional protesters with trained voices that can be heard throughout a large hall in order to disrupt Trump’s speech or a question from the crowd.  Trump says that news media accounts do not potray these incidents accurately.

Through several questions various people from the Post try to get Trump to acknowledge that Trump condones violence.  Trump insists that he supports law and order, not violence.  Trump’s campaign manager notes that there are repeated public service messages before every rally that the audience should not confront protestors and to let security personnel do that.  Trump repeats that some protesters, when interviewed, say they don’t know why they are there, implying that the protesters are paid agitators by those who want to make Trump rallies look violent.  Some protesters simply interrupt his speeches with shouted obscenities.  Out of 20,000 attending a rally, Trump claims that there are just a few protesters and that they are strategically placed at the rally venue.

WP:  “given the Supreme Court rulings on libel — Sullivan v. New York Times — how would you change the law?”  New York Times v. Sullivan is a 1964 decision by the Supreme Court that there must be a malice standard applied before reporting about a public official can be considered libel.  “Actual malice” is a legal concept that the media outlet knew the information was incorrect or should have known, i.e. that they exercised little or no effort to find the correct information.  After this decision, a person claiming libel in the U.S. must prove the untruth of something published.  This departed from centuries of common law precedent.  In Britain, for example, the defendant of a libel claim must prove the truth of the information they published.

DT: “I’d have to get my lawyers in to tell you, but I would loosen them up.”  Although Trump is not specific on this, I’m guessing that he would like some balance between the strict U.S. system and the Briitish system.  U.S. precedent was based on a problem that existed in the southern states during the early 20th century.

WP: “Would that be the standard then? If there is an article that you feel has hatred, or is bad, would that be the basis for libel?”

DT: “The Washington Post never calls me. I never had a call, ‘Why – why did you do this?’ or ‘Why did you do that?’ It’s just, you know, like I’m this horrible human being. And I’m not.”  If a news organization makes no effort to validate information, is that cause for libel?  “I want to make it more fair from the side where I am, because things are said that are libelous, things are said about me that are so egregious and so wrong, and right now according to the libel laws I can do almost nothing about it because I’m a well-known person.”

WP: “can you talk a little bit about what you see as the future of NATO? Should it expand in any way?”

DT: “Ukraine is a country that affects us far less than it affects other countries in NATO, and yet we are doing all of the lifting, [European members of NATO are] not doing anything.”

WP: “Could I ask you about ISIS, speaking of making commitments, because you talked recently about possibly sending 20 or 30,000 troops”

DT: “I said the generals, the military is saying you would need 20- to 30,000 troops, but I didn’t say that I would send them. I would put tremendous pressure on other countries that are over there to use their troops and I’d give them tremendous air … support because we have to get rid of ISIS. I would get other countries to become very much involved.”

WP: “What about China and the South China Sea?”

DT: “We have trade power over China. I don’t think we are going to start World War III over what they did, it affects other countries certainly a lot more than it affects us. I always say we have to be unpredictable. We’re totally predictable.  And predictable is bad. Sitting at a meeting like this and explaining my views and if I do become president, I have these views that are down for the other side to look at, you know. I hate being so open.”

WP:  Asks about Iraq and ISIS

DT: “We then got out [of Iraq] badly, then after we got out, I said, “Keep the oil. If we don’t keep it Iran’s going to get it.” And it turns out Iran and ISIS basically—”  Trump is interrupted but I wonder if he was going to say that Iran and ISIS were conspiring to get Iraq’s oil?  Iran and ISIS are blood enemies.  Iran embodies the Shia sect of Islam, ISIS is Sunni.

WP: “How do you keep it without troops, how do you defend the oil?”

DT: “I would defend the areas with the oil [with U.S. troops].”  Asserting that Iran is out for Iraq’s oil, Trump says, “Iran is taking over Iraq as sure as you’re sitting there. And I’ve been very good on this stuff. My prognostications, my predictions have become, have been very accurate, if you look.”

WP:  Asks Trump about his claim that he could use trade as a diplomatic cudgel against China’s territorial ambitions in the South China sea.  These disputes involve Vietnam, the Phillipines, and Malaysia.

DT: “You start making it tougher [for Chinese exporters]. They’re selling their products to us for… you know, with no tax, no nothing. If you’re a manufacturer, you want to go into China? It’s very hard to get your product in, and if you get it in you have to pay a very big tax.” “I don’t like to tell you what I’d do, because I don’t want to…”

WP: “This theory of unpredictability …there are many people who think that North Korea invaded South Korea precisely because [Secretary of State Dean] Acheson wasn’t clear that we would defend South Korea. So I’m curious, does ambiguity sometimes have dangers?”  Acheson served under Truman from 1949 to 1953.  In 1950, the N. Korean People’s Army crossed the 38th parallel to invade South Korea.

DT: “President Obama, when he left Iraq, gave a specific date – we’re going to be out. I thought that was a terrible thing to do. [The enemy] pulled back, and after we left, all hell broke out, right?”

WP: “What you’re saying [about European NATO members] is very similar to what President Obama said to Jeffrey Goldberg (Atlantic article) in that we have allies that become free riders. Do you have a percent of GDP that they should be spending on defense? Because it’s not that you want to pull the U.S. out [of NATO].”

DT:  “No, I don’t want to pull it out. NATO is costing us a fortune and yes, we’re protecting Europe but we’re spending a lot of money.”  Again, nothing specific in answer to the question.

WP:  “does the United States gain anything by having bases [in Japan and S. Korea]?”  The Post cites an unnamed public source that the U.S. pays 50% of non-personnel costs to maintain the bases.

DT: “I think we were a very powerful, very wealthy country. And we’re a poor country now. We’re a debtor nation.  We’re spending that [money] to protect other countries. We’re not spending it on ourselves. We have armor-plated vehicles that are obsolete. The best ones are given to the enemy.”  Donald relates that the son of one of his friends has served three tours in Iraq and Afghanistan.  “He said the enemy has our equipment – the new version — and we have all the old version, and the enemy has our equipment.  “We send 2,300 Humvees over, all armor-plated. we have wounded warriors, with no legs, with no arms, because they were driving in stuff without the armor. And the enemy has most of the new ones we sent over that they captured. And he said, it’s so discouraging when they see that the enemy has better equipment than we have – and it’s our equipment.”

There was more, including someone at the Post asking about the size of Donald’s hands.

Free Trade

March 20, 2016

This week’s blog will be about free trade.  Donald Trump first made it one of two signature Presidential campaign issues, then Bernie Sanders joined the chorus and now Hillary Clinton has made it part of her campaign speech. Have trade agreements with other countries put Americans at a disadvantage?

Most economists will not even entertain the idea.  The benefits of free trade are ultimately based on the benefits of specialization, the idea that everyone benefits when the most efficient producers supply a good or service.  Each producer achieves a comparative advantage (CA) in that specialization.   First formalized by economist David Ricardo in the 19th century, CA has long been a bedrock of micro-economic theory and introductory economics textbooks.

Greg Mankiw’s Prinicples of Economics cites the example of a rancher and farmer, who both benefit when they specialize.  The rancher concentrates on raising beef, the farmer raises potatoes and they produce more beef and potatoes at a lower cost than if the rancher and farmer did both. (Chapter 3)

A key concept to understanding CA is another bedrock economic principle:  opportunity cost, or what someone has to give up (the cost) to get some good or service (opportunity).  Each person, each country wants to minimize the cost to take advantage of the opportunity.

The same principle can be extended to international trade.  If a Mexican company can produce a good at a more efficient cost than an American company, then Americans will benefit if they buy the good from Mexico and sell something to Mexico which an American company can produce at a cheaper cost.  The ill effects in a particular part of the country are balanced by the good effects in another part of the country or economy, and lower prices benefit all Americans.

When countries impose tariffs on imports, those goods become more expensive for consumers. Economists talk about the “deadweight loss” from tariffs. Here is a graph of the negative effects of tariffs and more discussion on the topic.

The matter would seem settled then, as economist Paul Krugman noted in a 1987 paper : “the underlying commonality among conventional trade models is such that until a few years ago international trade theory was one of the most unified fields in economics.”

As early as the 1960s, economists questioned some aspects of conventional trade models, leading to the development of new models. Krugman notes, “The new view of international trade holds that trade is to an important degree driven by economies of scale rather than comparative advantage, and that international markets are typically imperfectly competitive.” [my emphasis]

Economies of scale. What’s that? This idea, also called increasing return, is when a producer gets a greater growth in outputs than the growth in inputs.  Increasing returns become a force separate from comparative advantage that leads to a “geographical concentration of production of each good,” or regional oligopolies.  We see this phenomenon in southeast Asia, Indonesia and Australia, where a complex web of materials and components production dominates the global electronics market.

“The view that free trade is the best of all possible policies is part of the general case for laissez-faire in a market economy, and rests on the proposition that markets are efficient. If increasing returns and imperfect competition are necessary parts of the explanation of international trade, however, we are living in a second-best world where government intervention can in principle improve on market outcomes.” [my emphasis]  The new idea in trade models is that strategic trade policy by a government “can tilt the terms of oligopolistic competition to shift excess returns from foreign to domestic firms.”  On the campaign stump, Trump makes the same case, although a bit less elegantly; that the U.S. government should make trade deals that shift the benefits of trade back to American workers and producers.  Is Trump channeling Paul Krugman?

Not quite.  Krugman notes three sometimes vociferous criticisms of government intervention. 1) The difficulty in measuring, understanding and modeling imperfect markets makes it impossible to formulate just the right policy.  2) If the government is going to intervene, companies will devote some resources to compete for favors from government, a process called “rent-seeking.” 3) Markets will make adjustments to offset intervention.  Other governments will initiate policies to counter the effects of a government’s intervention.

Krugman concludes “This is not the old argument that free trade is optimal because markets are efficient. Instead, it is a sadder but wiser argument for free trade as a rule of thumb in a world whose politics are as imperfect as its markets.”  This is the argument that Adam Smith made for laissez-faire capitalism, finding it undesireable but better than the alternatives.  Smith spent considerable effort in his book The Wealth of Nations to recount the degree of political corruption that distorted economies and society, that poisoned the human character.

That Krugman disregards those cautions when he favors government intervention within domestic markets confirms the fact that economists are human.

Economist Ian Fletcher presents far more arguments against free trade than Krugman. I would add an additional consideration.  When economists compute the costs of free trade policies, they use a model which does not include the economic benefits provided to workers displaced by free trade policies.  The costs are presumed to be offset by higher taxes from those areas of the country which benefit from free trade.  Admittably, these costs and additional tax revenues attributable to free trade policies are difficult to measure.  However, I do think that the effort should be made.  I suspect that the benefits paid to dislocated workers and the total negative effect, the multiplier, of the lost economic activity have not been fully accounted for and that free trade is much more costly than conventional models portray.

Even if we can measure and agree on the facts, we can not agree on what those facts mean.  Whatever the facts, we prefer our familiar and favorite idea.  They not only reassure us but are also well integrated into our values, and our philosophical sense of life.

Building Or Not

March 13, 2016

There are some upcoming changes to claiming rules for Social Security (SS) that take effect at the end of April.  A few weeks ago, Vanguard posted an article explaining some of the changes.

1) The end of “file and suspend,” the strategy where one half of a married couple, “John” we’ll call him, files for SS, then requests that those benefits be suspended.  The spouse, “Mary”, claims a spousal benefit while John’s benefits continue to grow at 8% per year until John is 70 years old.

2) The end of the “restricted application” strategy that allowed a person between the ages of 62 and 70 to collect benefits based on either their work history or their spouse’s history.  This allowed married couples to suspend taking benefits so that they could grow as under the file and suspend strategy.

////////////////////

You Didn’t Build That
In a 2012 campaign speech, President Obama infamously said, “If you’ve got a business — you didn’t build that. Somebody else made that happen.”

With the aid of teleprompters (only $2700) Mr. Obama  is a stirring orator, unlike his predecessor, Mr. Bush, who struggled with pronunciation, cadence and tone.  In contrast to his sweeping rhetoric, impromptu remarks by Mr. Obama are notoriously equivocal or inartful.  This remark was one of those.  Later on in the speech, Obama clarified his sentiments, “we succeed because of our individual initiative, but also because we do things together.”

In the 2012 election, Republican nominee Mitt Romney used Obama’s own words against him many times.  Many small business start-ups fail and when they do, the bank does not say, “you don’t need to pay your business loan back.  Somebody else made that failure happen.”  In Obama’s philosophy, failure is our personal responsibility but success is not?  It doesn’t play well in the small business community.

In response to February’s job report released last week, Mr. Obama is quite willing to take credit for the jobs created in the past seven years: “the plans that we have put in place to grow the economy have worked.” (Video and transcript) Mr. Obama doesn’t specify what plans.  The President and Congress, Democratic and Republican, have failed to enact fiscal policies that will help American businesses grow.  These leaders, these lifeguards of the economy, can not swim.  The Federal Reserve has had to implement extraordinary monetary policy to keep Americans from drowning.  0% interest rates for SEVEN years and $4 trillion of asset purchases by the Fed have reinflated the stock market and housing prices, the life raft of wealth for most Americans.

A fundamental theme of many elections is “It’s the economy, stupid,” a core mantra of the 1992 Clinton campaign coined by strategist James Carville.   Race and bigotry, defense and security play a part in a candidate’s appeal, but jobs, wages, benefits and taxes motivate voters to pull the lever in a voting booth.  The two outsider candidates, Bernie Sanders and Donald Trump, play to these economic concerns by promising jobs, or free college and medical care. Both candidates have been accused of being unrealistic and dangerous.

Once in office, most Presidents come to realize the reduced power they have in a Constitutional framework of checks and balances.  Each President must cooperate with a Congress easily swayed by lobbying interests, and fifty state legislatures with varying priorities and interests.

FDR exerted king-like powers during the multiple tenures of his Presidency thanks to the unprecedented majorities in both the House and Senate during the 1930s.  In the 1937-38 session, the Senate was dominated by 76 Democrats out of 100 members.  334 Democrats overwhelmed the 88 Republican members in the House.  During those years, the Supreme Court radically shifted the permissible Constitutional role of the Federal government in our lives.  The four generations that have lived since those policies were enacted continue to struggle with the social and financial consequences of those policies.

We are unlikely to repeat the lopsided majorities of that era simply because we recognize that unrestrained legislative power is dangerous and unhealthy for both our society and economy.  The Parliamentary systems of other developed countries allow a minority of citizens to have it their way, to dominate the policy choices of the majority.  The republican (small ‘r’) and federalist values embedded in the U.S. Constitution make it so much more difficult for a group of American citizens to get their way.  While this is often a source of frustration to policy advocates, we don’t veer off center as easily as other countries.

Focused on the 2016 election, voters may not notice the creeping dangers implicit in the extraordinary monetary measures and debt accumulation of the past twenty years.

Growing Government Debt

March 6, 2016

Earlier this year and again last week I suggested that a broad index of energy companies would probably be a good investment for the long term investor.  This week’s inventory report from the U.S. Energy Information Administration (EIA) showed that crude oil inventories continued to climb but that demand for gasoline is up a strong 7% over last year.

The latest Baker Hughes rig count showed an 11th week of declines in North America.  Oil rigs are now at levels last seen in early 2008 and gas rigs are at a 70 year low.

In response to demand growth and a steadily declining supply, crude oil prices climbed almost 10% and energy ETFs like XLE and VDE climbed almost 8% this past week.

////////////////////////

Constant Weighted Purchasing Index (CWPI)

At the beginning of each month I update an index that is based on the Purchasing Managers Index (PMI) using a methodology initially developed by financial economist Roland Pelaez in 2003 as a possible forcasting indicator for recessions.  I modified that to include the dominant non-manufacturing part of the economy, and called this combined index the CWPI, which I have included in my blog for three years.

The PMI is a monthly survey of Purchasing Managers throughout the country that gauges expansion or contraction in several aspects of their business.  The two most important components in the model are employment and new orders.

For the first time since last October, the manufacturing component of the index rose but is still contracting slightly.  Export manufacturers have had to overcome a strong dollar in the past 1-1/2 years, which makes American made products more expensive overseas.  The services sector is still expanding and the composite reading is still strong, indicating that there is little risk of recession in the near term.

Although Friday’s employment report showed strong job gains of 240,000, growth in the employment component of the services sectors is slowing.

Mr. Pelaez has recently published  a peer reviewed recession forecasting tool that I have not reviewed yet but I do look forward to reading his insights. Recessions come infrequently, about once a decade, but a long term investor who can switch out of stocks and into Treasuries to avoid these recessions could theoretically triple their wealth.

A word of caution.  There are several inherent problems with trading models based on infrequent economic events like recessions: 1) backtesting can help one develop a model or trading rule that does little more than fit the historical data;  2) backtesting uses revised economic and financial data.  Unfortunately, we don’t get to make decisions with historically revised data.

A great example of this:  at the June 2008 meeting of the Fed, three months before the financial crisis imploded, the majority of economists at the meeting felt that the economy had skirted a recession.  As more data for the first and second quarters of 2008 showed a definite decline in GDP, the NBER actually marked the start of the recession six months before that meeting, in December 2007.  You want perfect?  Next universe that-a-way.

///////////////////////

Debt Doubts

In December 2009, I mentioned  a comment by Raymond Baer, the chairman of Swiss private bank Julius Baer, who warned: “The world is creating the final big bubble. In five years’ time, we will pay the true price of this crisis.”

That time has come and gone but these things don’t run on a calendar.  As the book “The Big Short” noted, a person has to be right and timely.  Some who bet on the implosion of the housing bubble ran out of money before the bubble burst.

Taking advantage of extremely low interest rates, companies continue to borrow.  Levels of corporate debt are nearly a third of GDP.

Instead of bringing some of its cash profits back into the U.S. and triggering a tax expense, Apple has borrowed money to fund operations and investment.  Banks and investors would rather loan money to Apple than some medium sized business.  How good is that for the long term health of the economy?

To understand the makings of a debt bubble, let’s compare rates of return on investment and debt. Let’s say that a 50/50 balanced portfolio can earn 5.5% per year; 7.5% for stocks, 3.5% for bonds.  If a mortgage can be had for 4%, then it makes sense to NOT pay down the mortgage.  A car lease or loan at a 2% interest rate?  Keep rolling the loan or lease.  A company like Johnson and Johnson can borrow money for 25 years at the same 4%.  Why would they pay down debt?

Debt continues to grow because there is no financial incentive to pay it down.  Some families may pay down debt out of conservative prudence but there is no economic sense in doing so as long as money can be borrowed at a rate that is below what one can earn with the money.

As an example, let’s say that a family is considering paying off the remaining $100K on their mortgage.  They can get a new mortgage for 3.5% – 4%.  If they can earn 5% on that money, why bother paying off the mortgage?  Persistently low interest rates cause families and businesses to make short term decisions that make sense – until they don’t.  Some families will pay off debt as a matter of prudence but the low interest rate environment encourages families and businesses to NOT pay off debt.

In 2009, Raymond Baer was referring to the amount of corporate debt that was being rolled over at the time in order to avoid taking a loss on the loan.  Central banks have helped subsidize that rising corporate debt with low interest rates.  Banks reciprocate by buying government debt.

Global government debt has DOUBLED from $28 trillion in 2007 to almost $56 trillion in 2015 (Global debt clock).  China’s government debt-to-GDP ratio has more than doubled from 21% in 2007 to an estimated 54% in 2008 (S. China Post)

In the U.S. and Europe, government banking agencies reciprocate by requiring banks to hold little if any reserve collateral for the Federal or central government debt the banks purchase.  It’s a great financial buddy system – until it’s not.  We have never lived in a world where central banks can create so much money with an entry in a ledger.  As long as no one runs for the exits, everything is OK.

Under the Dodd-Frank rules, the Federal Reserve does not rate state and municipal debt with the same safety it accords U.S. Treasury debt.  This forces banks to hold more collateral against the debt, making it less attractive.  The Dodd-Frank test is whether banks can survive for thirty days during a financial crisis.  Since municipal and state bonds don’t trade very frequently, their lack of liquidity makes them more susceptible to downward price pressures in a crisis.  The Fed wants banks to offset that risk.  Cities and states complain that this forces them to pay higher interest rates on their debt and gives them less access to the bond market.  What do governments do when they don’t like the judgment of finance professionals?  Get their legislators to pass laws to override that prudence.  Several bills in both the Senate and House have been proposed.  This is how the world goes to hell.  One step at a time. (WSJ article on municipal debt)

////////////////////

Bonds Bust ZLB

Howz dat for a headline?!  ZLB means “Zero Lower Bound”, or 0%. Last Monday, the central bank of Japan sold almost $20 billion of 10-year government bonds that paid a negative interest rate.  Buyers are paying the Japanese government a fee to loan the government money.  Bizarro world!  While I don’t know the details, the buyers are probably Japanese banks who “take one for the team” – lose money – to implement a plan that the central bank hopes will combat the threat of deflation.

Political Promises

February 28, 2016

Heaven on Earth

The tax and spending policies proposed by Presidential contender Bernie Sanders were “vetted” by economist Gerald Friedman.  David and Christina Romer review Friedman’s assumptions and methodology,  finding the former unrealistic and the latter flawed. Christina Romer was former chair of the Council of Ecomic Advisors during the Obama administration.

Friedman assumes that Sanders’ income redistribution policies will spur a lot of demand in the next decade, 37% more than the Congressional Budget forecasts.  Real GDP will grow by 5.3% per year (page 7), erasing the effects of the 2008 financial crisis. Friedman also thinks that the productive capacity of this country is far below its optimum.  Therefore, all that extra demand will not lead to increased inflation, which would naturally put a brake on economic growth.  Employment will increase by 26% from the 2007 peak and, magically, all that extra demand for workers will not cause an increase in wages and inflation.

On page 8, the authors provide some historical context:  “Growth above 5% has certainly happened for a few years, such as coming out of the severe 1982 recession. But what Friedman is predicting is 5.3% growth for 10 years straight. The only time in our history when growth averaged over 5% for a decade was during the recovery from the Great Depression and the years of World War II.”

While GDP growth averaged over 5% during the decade after WW2, it was erratic growth spurred on by the inability of many families to buy many household items during the war.  It included one recession as well as phenomenal growth of 13% in 1950, and is unlikely to be replicated.

But we want to believe, don’t we?

/////////////////////

Labor Force Health Report

Yes, we’re busy so who has time to look at a lot of data to understand whether the world will implode tomorrow?  As an indicator, the health of the labor market is pretty good.  To take the temperature of the labor market we can look at the ratio of active job seekers to job openings.  At an ideal level of 100%, seekers = openings.  In the real world, there are always more job seekers than job openings.  When the percentage of seekers to openings is 200%, it is almost certainly a recession.  The economy rarely produces levels below 150%, which means that there are 3 job seekers for every 2 job openings.

Looks pretty good on a historical basis, doesn’t it?

///////////////////

Women in the Workforce

Fact Check: Women make less than men.  In 2013, the BLS published a survey comparing the full time wages of men and women in the general population and by race.  In 2012, median weekly earnings for women were 81% of men’s.  Black and Hispanic women were higher, at 90% and 88%, but this may be due to the fact that Black and Hispanic men make less than white men.

Education levels have changed dramatically.  In 1970, only 11% of women had a college degree.  In 2012, 38% did, just slightly below the 40% average for the U.S.  A 2010 BLS study found that, in 2009, median weekly earnings of workers with bachelor’s degrees were 1.8 times the average amount earned by those with a high school diploma.  (They are comparing a median to an average to reduce the effect of especially high incomes).

What the BLS notes is that “the comparisons of earnings in this report are on a broad level and do not control for many factors that may be important in explaining earnings differences.”  We will never hear that on the campaign trail.  Academic caveats do not get voters fired up to go out and vote.  If a candidate is running on a platform of fixing income disparity (Democrats), we will hear quoted the report with the most disparity.  Candidates running who claim little disparity (Republicans) will quote a paper whose statistical assumptions minimize income differences.

A more distressing trend is that older women are having to work longer.  8% of women worked beyond retirement age in 1992.  The percentage has almost doubled to 14%.  The BLS estimates that, in ten years, 20% of women will be working past retirement age.

///////////////////////////

Oil Rig Count

Almost half of the oil and gas rigs in the U.S. are located in Texas.  The 60% reduction in Texas rigs reflects the decline in total rigs throughout the U.S., according to Baker Hughes.  Rigs pumping oil account for 3/4 of the rigs shut down.

The oil “glut” is only about 1.5 million barrels of oil per day, less than 2% of the 2016 daily demand of 96 million gallons barrels estimated by the IEA.  Fewer rigs reduce downward price pressures and lately we have seen crude prices rise into the mid-$30s. With a long time horizon of several years or more, a diversified mutual fund or ETF like XLE, VDE or VGENX would likely provide an investor with some dividend income and capital gains. Could prices go lower?  Of course. After falling more than 40% in 2008, the SP500 stood at 900 at the end of December.   Investors who bought at those depressed levels might have felt foolish when the index dropped another 25% in the following months.  Those “fools” have more than doubled their investment in the past 7 years, averaging annual gains greater than 12%.

Capitalism and Politics

February 21, 2016

Capitalism

Growing income inequality, and extreme disparities of wealth in a capitalist economy prompted this 2013 speech by David Simon, the writer of the HBO series “The Wire.”  Mr. Simon attributes the plight of an economic underclass to thirty years of unrestrained capitalism.

Simon confuses capitalism with politics. When the politicians and agencies in Washington amass ever more power and draw corporate lobbying money to Washington, that’s politics, not capitalism.  When taxpayers bail out big banks for making stupid bets, that is politics, not capitalism.  When large companies like Archer Daniels Midland and Exxon receive generous subsidies from taxpayers, that is politics, not capitalism.

Cronyism contaminates whatever political or economic system it infects, be it capitalism, socialism, communism or fascism.  Cronyism and factions have infected every human society from the Assyrians of 4500 years ago to the present.  Knowing how destructive these twin human traits were, James Madison, chief constructor of the U.S. Constitution, crafted a system of checks and balances to provide a legal boxing ring for the various factions to punch it out.

Simon sees the economy as a Manichean battle between capital and labor, a model first proposed by Marx.  The battle is more accurately described as a triangle of capital, labor and political power.  Capital and labor are the two productive components of the economy, vying for legal favors from politicians. Capital and labor must push and shove for a more advantageous place in a courtier’s line before the political princes and princesses, kings and queens in the capitols of the world.

With much of the productive capacity of the world weakened or destroyed by World War 2, most of the world’s capital flowed to the U.S., which became the economic engine of the world.  With little global competition, workers in the U.S. had strong bargaining power, able to win pay packages of $200,000 (in 2015 dollars) to install parts on an assembly line.  Public labor unions flexed their legal bargaining and striking power to win pension packages that paid them almost full salary for the rest of their lives.

With few challenges from the rest of the world, management at U.S. companies became undisciplined, unfocused and uncompetitive.  The big three automobile manufacturers influenced politicians who passed tariffs which protected the vehicles produced by those manufacturers.  Tariffs on imported pickups and cargo vans still insulate domestic manufacturers from competion.  Like the automobile manufacturers, aerospace companies like Lockheed cracked under the weight of inept business planning and execution.  The demands of their labor force added to the strains.  Crippled by chronic cronyism, New York slid into bankruptcy and sought a bailout from the Federal government.

In the 1950s and 60s, I grew up in a union family, in a union neighborhood in New York City.  I accepted the nepotism and bribery in the union shops where I worked.  They were a fact of life along with housing segregation and sex discrimination.  The building trades were riddled with union cronyism and “tips” to building inspectors. Repeated strikes by city workers made daily life unpleasant.  Trash piled up in the streets, mass transit didn’t work and it could take an entire day at City Hall to renew a driver’s license.

In the 1960s and 70s, whole sections of New York, Chicago, Detroit and Philadelphia were unsafe to walk in, to live in or to work in. Folks like radio and TV host Tom Hartmann and Senator Bernie Sanders find it convenient to leave out some history when they talk about the 60s and early 70s as a benchmark of fairness for working people.

In the 1970s, the problems of the past two decades were brought to a head by the oil embargo, the recession of 1973-74, wage and price controls, the Watergate scandal, and rising inflation that would near 10% by decade’s end.  In 1971, Lockheed was bailed out by the U.S. government, a precedent that would be followed by others in the coming decades.

As European countries continued to rebuild their manufacturing and financial capacities, Japanese manufacturers took advantage of a new technology, transistors, to build smaller and less expensive electronic TVs and radios.  Their automobiles posed a weak but growing challenge to the dominance of U.S. manufacturers. In 1979, the three cronies of U.S. capitalism – organized labor, capital and politics – renewed their pact when Congress bailed out the automobile manufacturer Chrysler.

In the 1980s, the financial industry, the “bookies” of capitalism, began a decades long courtship of politicians in Washington, competing with organized labor and capital for political favors. The decade began with back to back recessions, 8 – 10% interest paid on savings accounts, 9 – 10% mortgages (a deal!),  and small business loans at 14% (secured), or 21% (unsecured) interest rates.  Small business owners worked extra hard  to compensate for the high interest rates paid on business loans.

Several Social Security tax increases were passed, taking an every bigger bite out of paychecks and profits.  A lot of us muttered about taxes.  There were 10 to 15 tax brackets, none of them indexed for inflation so that most of a raise or some occasional overtime went to Uncle Sam.    For decades, fat cats had been using tax dodges – legally – to escape taxes.

Sensing a growing discontent among voters at the unfairness of the tax system, politicians deliberated for several years before passing a tax reform bill in 1986.  Although tax rates were reduced for the wealthy, they lost many of their tax shelters.  Any change impacts both the incompetent and the dishonest, but especially exposes those who are both incompetent and dishonest.  The loss of tax shelters revealed a large network of scams in the financial and real estate industries that ignited the Savings and Loan Crisis of the late 1980s and early 1990s.

Declining union membership coupled with the growing political influence of the financial industry meant that unions could no longer afford to keep up with capital in the scuffle for treats from Washington.  Politicians protest that they too are victims of the “pay to play” system of American politics but efforts to enact a system of public financing of elections have been unsuccessful.  Why?  Because the system fattens the wallets of too many politicians.  If a few do lose their gerrymandered seats, they often find jobs lobbying the very politicians who replaced them.

The task of politicians and partisans of both major parties is to first craft the problem. Is the problem 1) greedy capitalists, 2) the immoral redistribution of income, 3) an overabundance of regulation that is stifling business growth, 4) income inequality, 5) too much power concentrated in the Federal Government, 6) too much money in politics, 7) too much taxes, 8) too little taxes, 9) ineffective or inadequate Federal regulation?  Pick one, or pick several. Make up your own.  The problem is that people can not agree on the problems, much less the solutions.

The essence of capitalism is that it has one metric – the return on capital which directs the flow of capital.To the champions of capitalism, this simplicity of feedback is the virtue of capitalism.  To the detractors of capitalism, this primitive mechanism is a bane.  Socialist and communist planners insist that an elite can direct a society’s capital for the greatest good.  They offer a top-down approach in contrast to the bottom-up solution design that a capitalist system offers.  Because capitalism does not present a unified solution for a society’s problems, some people reach for socialist and communist solutions presented by the few only to find that those solutions benefit mostly the few.

Portfolio Stability

February 14, 2016

Disturbed by the recent volatility in the stock market, some investors may be tempted to trade in some of their stock holdings for the price stability of a CD or savings account.  After a year of relatively little change, stock prices have oscillated wildly since China began to devalue the yuan at the beginning of the year.

Just this week, the price of JPMorgan Chase (JPM), one of the largest banks in the world, fell almost 5% one day then rose 7% the next.  Such abrupt price moves in a large multi-national company are driven less by fundamentals and more by fear.  As the price of oil fell below $30, hedge fund and investment managers began to doubt the safety of bank loans to energy companies, particularly those smaller companies whose fortunes have risen recently during the fracking boom.  Even if these types of loans were a miniscule portion of JPM’s total loan portfolio, investors remember that the financial crash began in 2007 with growing defaults of home loans that started a financial chain reaction of derivatives that blew up.  Sell, sell, sell, then buy, buy, buy.

Price stability is a term usually associated with measurements of inflation like the Consumer Price Index (CPI). A basket of typical goods is priced each month by the BLS and the changes in those prices are charted.  Each of us has a basket of investment goods that have varying degrees of price stability.  Stock prices vary a lot;  bond prices less so; house prices even less.  Cash type instruments like savings accounts and CDs have no nominal variation.

Each of us desires some degree of stability as we chug through the waters of our lives.  Like a ship we must make a tradeoff between speed and stability.  A stable ship must compromise between the depth and breadth of its keel, that part of the ship which is below water.  A deep keel provides stability but puts the ship at the risk of running aground in shallow water.  A broad keel is stable but increases the water’s drag, slowing the ship. (Cool stuff about ships)

It is no surprise that stocks provide the power to drive our investment ship.  Few investors realize that housing assets provide more power and stability than bonds.  We judge stability by the rate with which the price of an asset changes.  The slower the price change, the more stable the asset.  Over decades, residential housing has better returns and steadier pricing than bonds, although that might surprise readers who remember the housing bubble and its aftermath.

Many investors include the value of their home in their net worth but not necessarily in their investment portfolio and may underestimate the stability of their portfolio. Let’s imagine an investor with $750,000 in stocks, bonds, CDs, savings accounts and the cash value of a life insurance policy.  Let’s say that $375K is invested in stocks, $375K in bonds and cash equivalents.  That appears to be a middle of the road allocation of 50/50 stocks/bonds.  I will use bonds as a stand in for less volatile investments.

Let’s also assume that this investor has a house valued at $215K with no mortgage.  If we add in the $215K value of the house, we have a total portfolio of $965K and a conservative allocation closer to 40/60 stocks/bonds, not the 50/50 allocation using a more standard model.

We arrive at a conservative estimate of a house value based on the income or rental value that the house can generate, not the current market value of the house, which can be more volatile.  In previous posts, I have noted that houses have historically averaged 16x their annual net operating income, which is their gross annual rental income less their non-mortgage operating expenses. For real estate geeks, this multiplier is 1 divided by the cap rate.

Let’s use an example to see how this multiplier works.  Let’s say that the going rent for a modest sized house is $1600 per month and we guesstimate an average 30% operating expense, leaving a net monthly income of $1120.  Multiplying that amount by 12 months = $13,440 annual net operating income.  Multiply that by our 16x multiplier and we get a valuation of $215K.  Depending on location, this house might have a market value of $260K but we use  historic income multiples to calculate a conservative evaluation.

Our revised portfolio provides a more comprehensive perpective on our investment allocation and the stability of our “buckets.” During the past year, we may have seen a 5 – 10% increase in the value of our home, offsetting some of the apparent riskiness of a 10% or 20% move in the stock market.  Adjusting our portfolio assessment to allow for a home’s value might reveal that our stock allocation is actually a bit on the low side after the recent market decline and – quelle horreur! – we should be selling safer assets and buying stocks to maintain our target portfolio balance.  But OMG, what if stocks fall further?!  Then we might have to buy even more stocks to meet our target allocation percentages!  This is the essential strategy of buying low and selling high, yet it is so counterintuitive to our natural impulses.  We buy some assets when we are fearful of them.  We sell other assets when we think they are doing well.

****************

For anyone interested in housing as a business, the Wall St. Journal published a comprehensive guide, Wall St. Journal Complete Real Estate Investing Guidebook by David Crook in 2006. Recently, Moody’s noted that apartment building cap rates had declined to 5.5%, resulting in a multiplier of 18x that is above historical norms.

**********************

Income Distributions

February 7th, 2016

Updates on January’s employment report and CWPI are at the end of this post.  Get out your snowboards ’cause we’re going to carve the political half-pipe! (*v*)
(X-Game enthusiasts can click here)

////////////////////////////////

To Be Rich or Not To Be Rich

Every year the IRS takes a statistical snapshot of the almost 150,000,000 (150M) personal tax returns it receives.  There are some interesting tidbits contained in these tables that will put the lie to many a politician’s claim in this election season.  The IRS lists the number of returns for each of some twenty income brackets.  They also list the exemptions claimed for each of these income brackets and let’s turn to that for some interesting insights.

From Table 1.4 we learn that there were 290M exemptions claimed in the 147M tax returns filed in 2013, or almost two exemptions per return.  In 1995 (Table 1, same link as above) the number of exemptions claimed was 237M for 118M returns, exactly two exemptions per return. Exemptions are people that need to be fed, clothed, and housed.

Census Bureau surveys (CPS) over the past few decades show that households are shrinking.  Conservatives assert that median household income has stagnated simply because there are fewer people and workers in households today compared to the past.  If this were true, IRS data would show a greater decrease in exemptions over an 18 year period. We can’t say that one or the other data source is “true,” but that averaging data from the two sources probably gives a more accurate composite of income trends in the data.  Census data probably overcounts households while the IRS undercounts them.  Conservatives who advocate less government support will ignore IRS data that conflicts with their beliefs.

30% of the exemptions were claimed by tax returns with adjusted gross incomes (AGI) of less than $25,000, or less than half the median household income. (AGI is earned income and does not include much of the income received from government social programs.)  Only 2M exemptions, or 2/3 of 1%, were claimed by tax returns with an AGI of $1M or more.  Out of 315 million people in the U.S., there are only two million “fat cats” with incomes above $1,000,000.

Presidential contender Bernie Sanders tells his supporters that he is going to tax the rich to help pay for his programs.  IRS data shows just how few there are to tax to generate money for ambitious social programs. Mr. Sanders says he will get money from the big corporations.  Corporations with lots of well paid lawyers are not going to give up their money peacefully.

Instead, Mr. Sanders’ plans will rely on taxing individuals who can not erect the legal or accounting barricades employed by big corporations.  11% of exemptions were claimed by those making more than $200,000, a larger pool of potential tax money. Doctors, lawyers and other professionals will “Feel the Bern.”  It is not unusual for a middle class married couple in a high cost of living city like New York or Los Angeles to make $200K.  Mr. Sanders has his sights on you.  You are now reclassified as rich.

Here is a well-sourced analysis of the net cost to families.  Most will save money.  Unfortunately, Mr. Sanders made the political mistake of admitting that he would raise taxes, but…  No one paid attention to the “but.”  Should he win the Democratic nomination, Mr. Sanders will “feel the Bern” as Republicans use the phrase against him.  He might have used a phrase like “my plan will lower mandatory payments” to describe the combined effect of higher income taxes and no healthcare insurance payments.

The author calculates that the top 4% will spend a net $21K in extra taxes less savings on health care premiums.  The author probably overstates the effect on those at the top because he uses an average instead of a median, but we could conservatively estimate an additional $10K for those with AGIs in the $200K-$300K range.

****************

Earned Income Tax Credit

The Earned Income Tax Credit (EITC) is  a reverse income tax for low income workers, who get a check from the federal goverment.  For the 2014 tax year, over 27 million returns received about $67 billion from the government for an average of $2400 per receipient (IRS).  In inflation adjusted dollars, this is up 50% from the 2000 average of $1600.  The number of receipients has expanded 50% as well, growing from 18 million to 27 million.  Although Democrats often tout their support for the poor, it is Republican congresses that are largely responsible for expanding this support for low income families.  Republicans may talk tough but are more than willing to reach out a helping hand to those who are giving it their best effort.  There is a practical political consideration as well.  An analysis of IRS data by the Brookings Institute found that, in the past fourteen years, the poor have shifted from urban areas largely controlled by Democrats to the outlying suburbs of metropolitan areas, where Republicans have more support. In short, Republicans are taking care of their voter base.

****************

Constant Weighted Purchasing Index (CWPI)

The manufacturing sector, about 15% of the economy, continues to contract slightly, according to the latest Purchasing Manager’s Survey from ISM.  The strong dollar and a slowdown in China have dragged exports down.   Extremely low oil prices have impacted the pricing component of the manufacturing survey, which has reached levels normally seen during a recession.


For some industries, like chemical products, the low oil prices have boosted their profit margins.  Most industries are reporting strong growth or at least staying busy.  Wood, food, beverage and tobacco manufacturers and producers report a sluggish start to the year, as reported to ISM.

The services sectors have weakened somewhat in the latest survey of Purchasing Managers, but are still growing, with a PMI index reading of 53.5.  Above 50 is growing; below 50 is contracting.  The weighted composite of the entire economy, the CWPI, is still growing strongly but the familiar up and down cycle of the recovery is changing.  Both exports and imports are contracting

The composite of employment and new orders in the non-manufacturing sectors has broken  below the 5 year trend.  It may turn back up again as it did in the winter of 2014, but it bears watching.

*************************

Employment

Each month theBureau of Labor Statistics  (BLS) surveys thousands of businesses and government agencies to compute the number of private and public jobs gained or lost during the month.  The payroll processing firm ADP also tallies a change in private jobs based on paychecks generated from thousands of its client businesses.  If we subtract government jobs from the BLS total, we should get a total number of jobs that is close to what ADP tallies.  As we see in the graph below, that is the case.

Economists, policy makers and the media look at the monthly change in that total number of jobs.  This change is miniscule compared to the 121 million private jobs in the U.S.  A historical chart of that monthly change shows that BLS survey numbers are more volatile than ADP.

I find an averaging method reduces the monthly volatility.  I take the change in jobs as reported by the BLS, subtract the  change in government employment, average that result with the ADP report of jobs gained or lost, then add back in the BLS estimate of the change in government employment.  This method produces a resulting monthly change that proves more accurate in time, after the data is subsequently revised by the BLS.  Based on that methodology, jobs gains were close to 175K in January, not the 151K reported by the BLS or the 205K reported by ADP.

There was a lot to like in January’s survey.  The unemployment rate fell below 5%.  Average hourly earnings increased by 1/2%.  Manufacturing jobs added 29,000 jobs, the most since the summer of 2013.  This helped offset the far below average job gains in professional and business services.  Year-over-year growth in the core work force aged 25-54 increased further above 1%.

The bad, or not so good, news: job gains in the retail trade sector accounted for 1/3 of total job gains and were more than twice the past year’s average of retail jobs gained.  Considering that job growth in retail was near zero in December, this may turn out to be a survey glootch.  Food services were another big gainer this past month.  Neither of these sectors pays particularly well.  The jump in manufacturing jobs probably contributed the most to lift the average hourly wage.

The Labor Market Conditions Index (LMCI) is a cluster of twenty or so employment indicators compiled by the Federal Reserve.  December’s change in the monthly index was almost 3%.  In the forty year history of this index, there has NEVER been a recession when this index was positive.

We are innately poor at judging risk.  We derive indicators and other statistical tools to help us balance that innate human weakness with the strength of mathematical logic.  Still, people do not make money by NOT talking about recession.  NOT talking does not pay commissions, does not generate the buying of put options, expensive annuities, and other financial products designed to make money on the natural gut fears of investors.  Next week I’ll look at the price stability of our portfolios.

Re-pricing the Market

January 31, 2016

In the closing moments of one of the “big ape” films, the very large gorilla Mighty Joe Young saves the girl, placing her on a boat as an island in the Pacific, broken by a volcano, falls back into the sea.  The bandaged hand of the big ape reaching out of the roiling waters is the last we see of the movie’s star.

On Friday morning, the Bank of Japan (BOJ) surprised the world by cutting it’s funds rate to a negative .1% from a positive .1%, vowing to fight the deflation and lack of growth that has plagued the Japanese economy for two decades.  As the island’s economy collapses under the weight of its aging population and lack of immigration, the bank thrust its arm above the Pacific waters to save – well, the entire Japanese population.  Could be the script of another big ape movie or a Godzilla sequel.

The first estimate of fourth quarter GDP was released Friday morning and the news was not good, which meant that the news was good, get it?!  GDP growth for the last quarter was positive, not negative, but less than 1%, so traders figured that the Fed will not raise interest rates again in March.

#3 in the combination was positive earnings surprises from Microsoft and Facebook, among others. Thursday was the busiest day of the earnings season.  #4 The price of oil continued to climb above the near rock-bottom benchmark of $30.  All of these factors were the impetus for a stock market surge of 2-1/2% on Friday and helped soften a really bad start to the year.  For the month, the index fell 5%.  During the month, revisions to earnings estimates for 2016 fell about the same amount – 4.7% (Fact Set).  In short, the stock market re-priced itself.

********************

Taxes

As the primary season approaches and millions of Americans receive their W-2 earnings record in the mail, Americans turn their attention to the cheery subjects of incomes and income taxes.  Here’s a Heritage Foundation chart of the effective payroll tax rates and income tax rates for the five quintiles of Americans based on income.

Those in the lowest quintile making less than $25K pay a combined rate of 2.1%.  Those in the next quintile making less than about $47K pay a combined rate of 6.6%.  Those in the next higher quintile making less than $80K pay 12.2%.  The top two quintiles pay 14.7% and 21% respectively.  It is easy to understand why many in the upper quintiles feel that they are already paying their fair share of taxes.

The fault in these calculations is that they neglect the employer’s portion of the payroll tax which is paid indirectly by the employee in the form of a lower wage.  Including that portion would add another 7.5% to 8% to the lower quintiles, a bit less to the top two quintiles.  Here’s a chart showing the total payroll tax burden since the Social Security Act was passed in the 1930s.

Should the rich pay more in taxes?  Yes, says Democratic Presidential contender Bernie Sanders.  Many Americans do not realize that we are in the top 10% of global incomes, the world’s fat cats.  Should Americans pay a global fairness tax of 10% or so?  This money would then be redistributed to poorer people around the world.  That is the world that Mr. Sanders is aiming toward.

**************************

Consumer Problem Survey

Over the past several thousand years people have developed numerous tools to predict the future.  Reading chicken bones, tea leaves and other forms of augery have given way to mathematical and statistical modeling.  The folks at Georgetown have developed a predictive tool to estimate consumer spending. Using a survey methodology researchers ask consumers what problems they have and which ones they are planning to solve in the coming months. These can be the payment of taxes, needing a new computer, iPad, or cell phone, the purchase of new home, etc.  Based on these responses, the researchers compile a Problem Driven Conumption Index (PDCI).  In the spring and early winter of 2014, the predictive index badly under-estimated retail sales.

However, the approach brings an essential understanding of the challenges American families face.  In a 2013 survey, respondents reported having many problems for which they see no solutions.  We learn that men and women have a few problems in common but confirm the axiom that each sex really does see the world differently.  The researchers are able to chart the shifting patterns of problems as we age.  This problems based approach is another statistical tool in the field of behavioral finance.