GDP, Profits, Inflation

December 22nd, 2013

Merry Christmas!

Last week I reviewed several decades of trends in corporate profits, as well as the 1990 change in measuring inflation that has helped increase corporate profits as a share of GDP.   (For those of you interested in the inflation controversy, here is an article that provides some additional insight.)  This week I’ll look at patterns in the economic growth of this country that sheds some light on recent events and provides some context to understand ongoing trends.

During the 30 years following World War 2, the economy grew at an annual rate of 3.7% after inflation.  Population growth was about 1% per year.  Productivity growth was about 1 – 1.5%.  Government spending, including debt, grew a bit more than 1%.  The chart below shows the compounded annual growth rate.

But I think the story is more clearly told by a different chart constructed from the same data.  The growth rate trend is more easily visible and it is the change in this trend that I will be focusing on.

During the 1970s, an economic trend known as staflation increasingly took hold. This period of high inflation, coupled with slowing growth and growing unemployment, was not thought possible by economists using theories proposed by John Maynard Keynes in the 1930s, during the Great Depression.  In 1974, economist Arthur Laffer first sketched out a theory that tax cuts would stimulate the economy.  As the Federal debt began to rise in the mid to late 1970s, few wanted to take a chance that lower tax rates would produce more revenue for the Federal Government.

The 1980s began with back to back recessions and the highest unemployment since the 1930s Depression. Big spending and tax cuts during the 1980s dramatically increased the federal debt but did little  to spur growth.

During this 13 year period, profit growth slowed to 2.4%.  The myth that the 1980s was a high growth era continues to live in the minds of political pundits.  In a WSJ op-ed on Dec. 18th, Daniel Henninger referred to “the high-growth years of the Reagan presidency.”  Myths live on because they serve a purpose to those who cherish them.  The cardinal rule of politics is “Disregard the Data.”

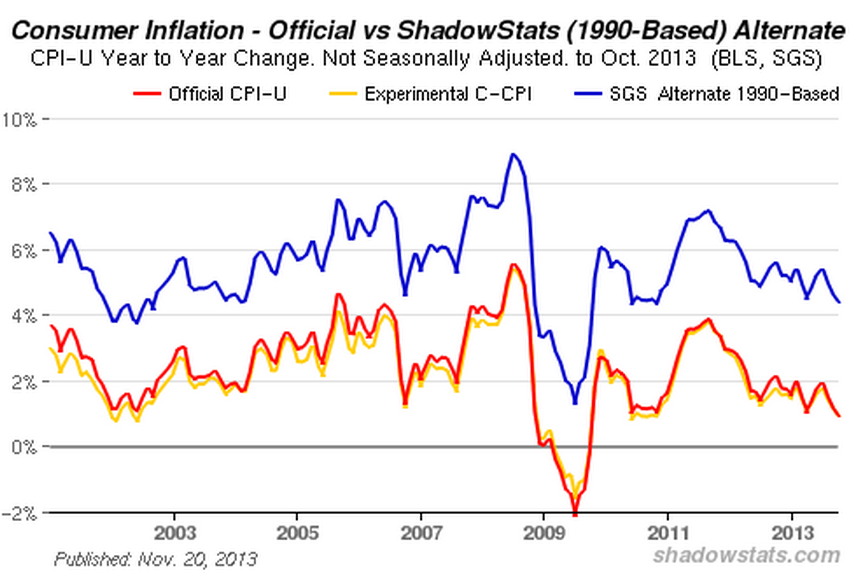
In 1990, economists at the BLS adopted what is called a hedonic methodology to computing the CPI.  Used by other OECD countries, this supposedly more accurate assessment of the growth of inflation shows a lower growth rate of inflation.  This naturally increases the growth rate of inflation adjusted GDP. (GDP dollars each year are divided by the inflation rate to get the real growth rate.)

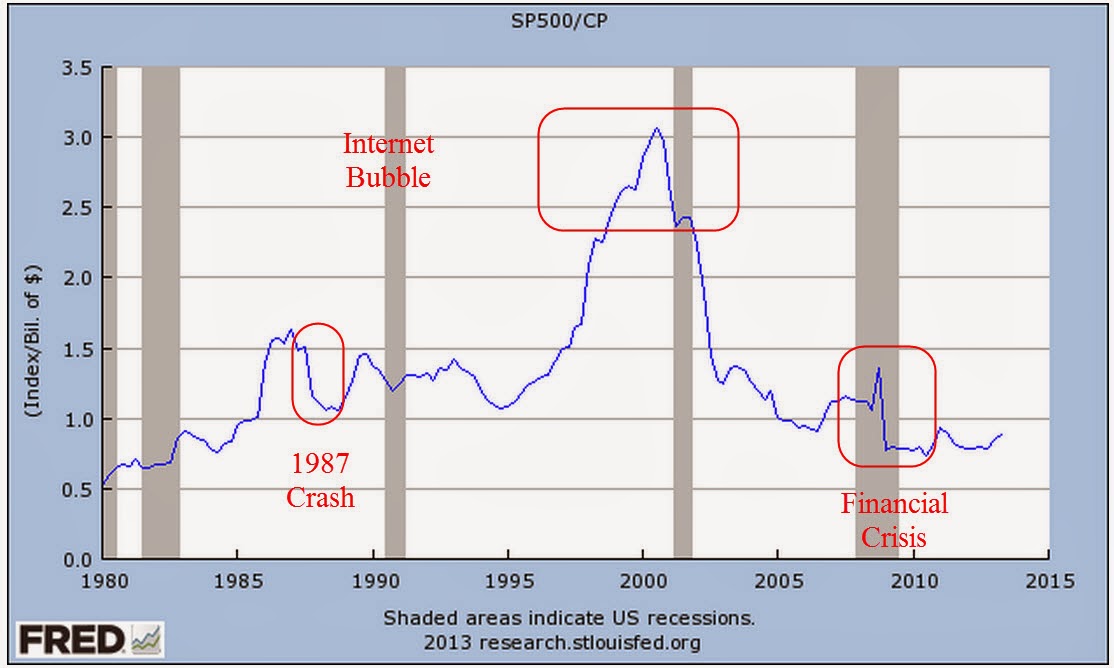
The conventional narrative is that the 1990s was an explosive growth period of new technology and growing globalization.  From the beginning of 1990 to the start of 2000, stock market values grew four times.  After the bursting of the internet bubble, 9-11, and the recession of 2001, the economy recovered.  By the mid-2000s, the unemployment rate was less than 5%.  While that may be the conventional narrative, the growth of the economy from 1990 to 2007 was just as slow as the period 1978 – 1989.

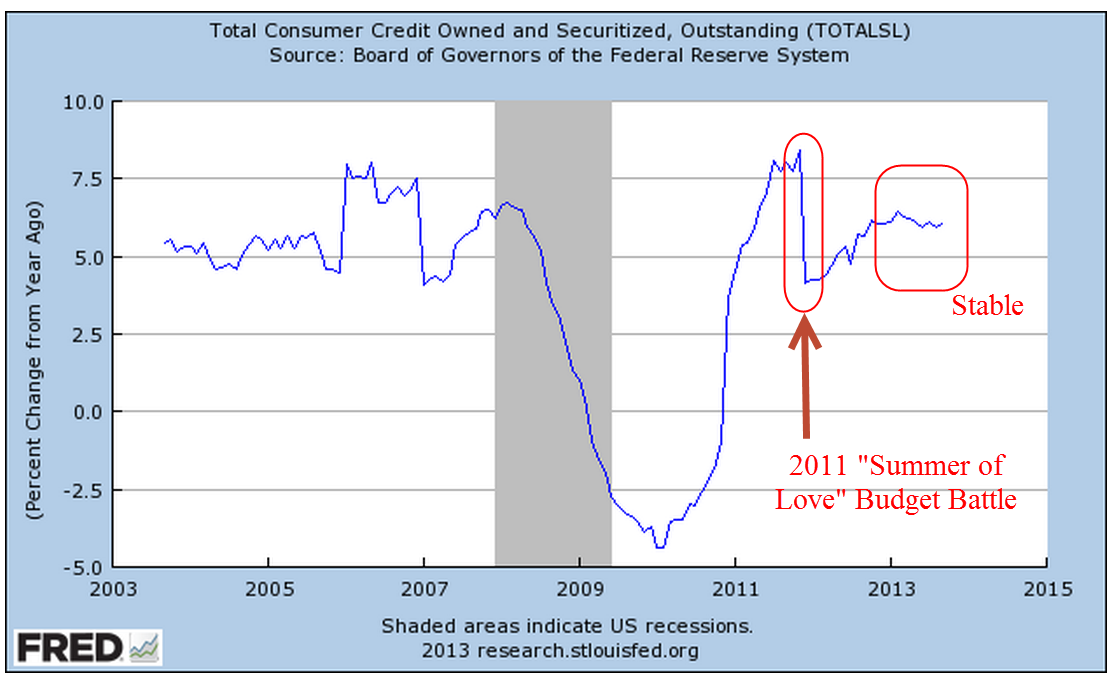
Remember that this slow growth would have been even slower if the BLS had not changed their methodology for measuring inflation.  To recap, the 30 year real growth rate of GDP after WW2 was 3.7%.  The following 30 year growth rate was 2.3%.  But that later 30 period is marked by a sharp rise in consumer borrowing.   Without that escalation in borrowing, growth would have been meager.

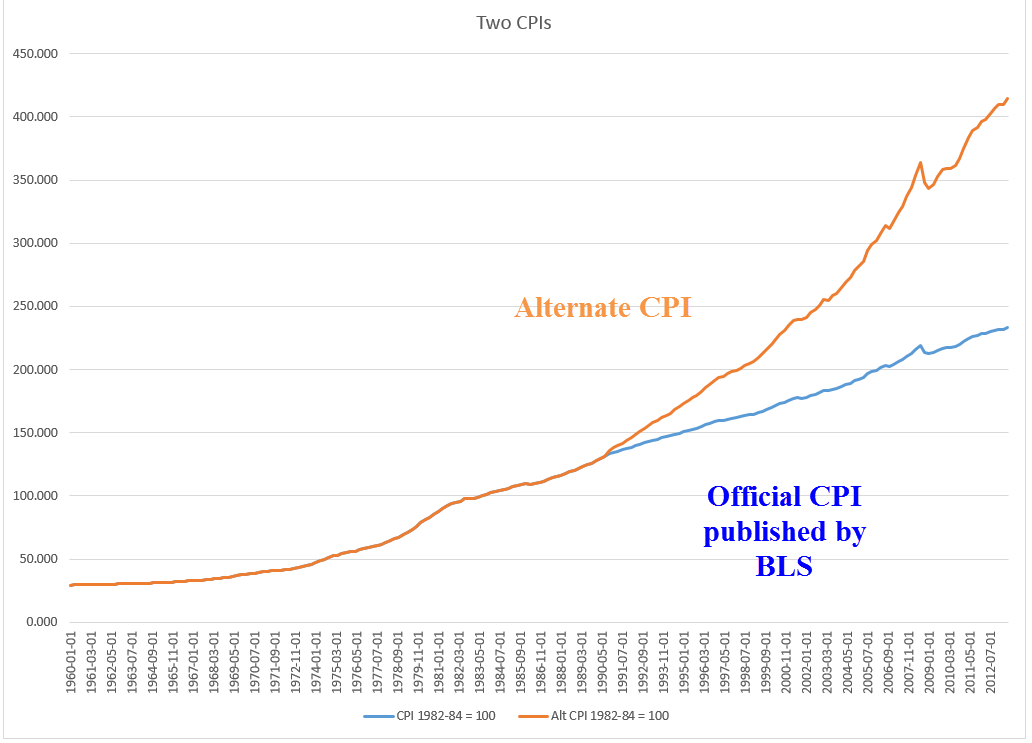
Families with two incomes borrowed against their homes, drove up the balances on their credit cards and still GDP growth was slow.  Let’s construct a fairy tale, what economists call a counterfactual.  What if the BLS had not changed to this new methodology in 1990?  What would be the growth rate of GDP using an alternate measure of inflation?

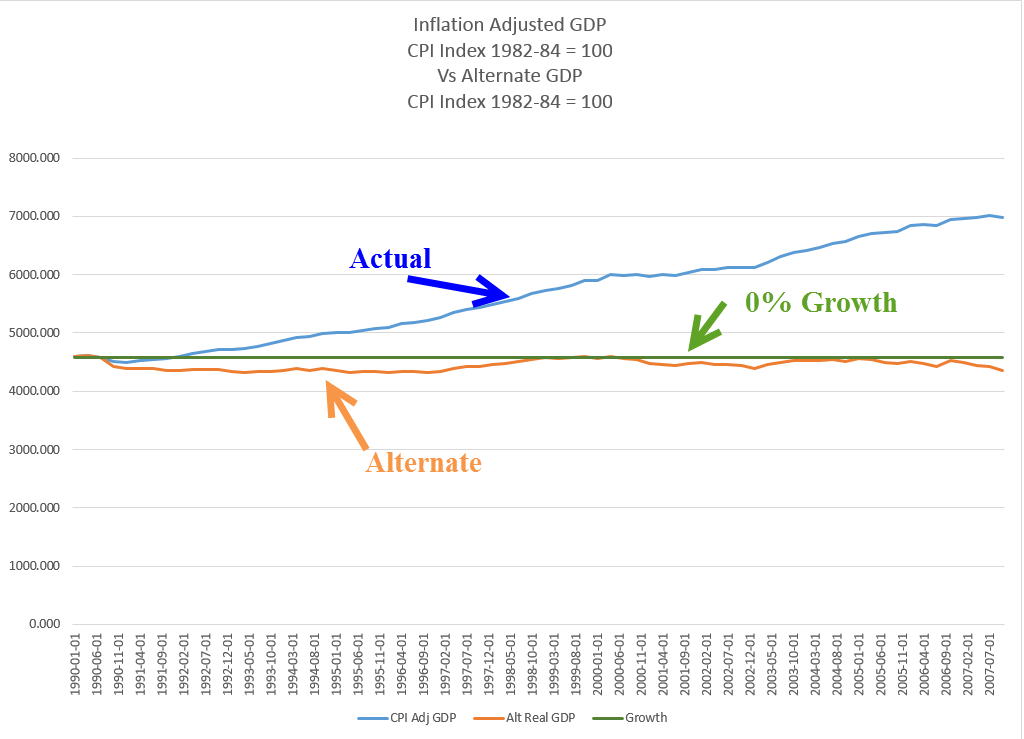
The resulting growth pattern is 0% for the 18 year period and is more consistent with the experiences of many workers and families in this economy.  The change in the measurement of inflation has greatly helped mid-size and large size companies.  An understated inflation rate reduces labor costs by reducing cost of living adjustments to salaries and wages.  In addition, companies can borrow at lower rates since many corporate bonds are tied to the inflation rate.  American companies did not engineer this revised methodology of measuring inflation but they have been the largest beneficiaries of the new policy.

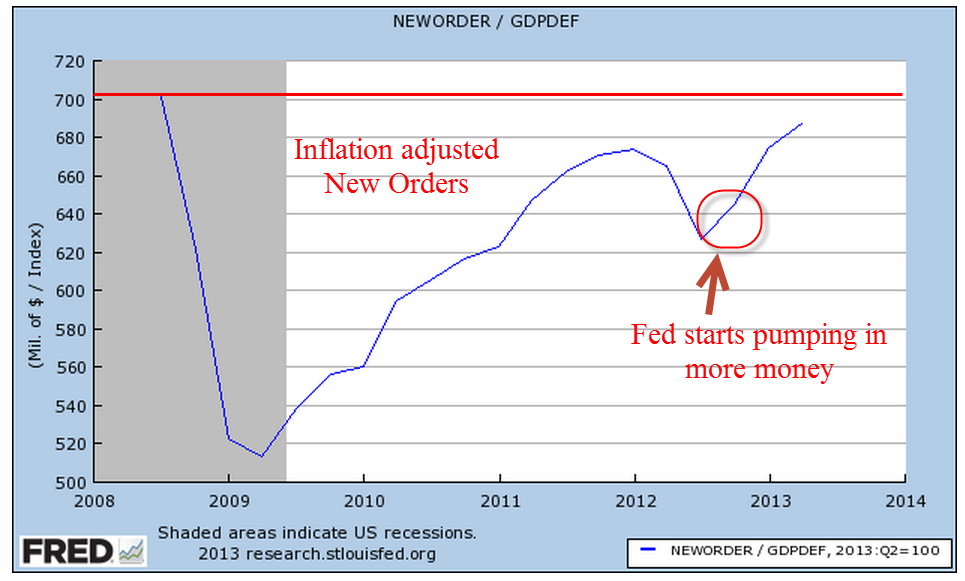
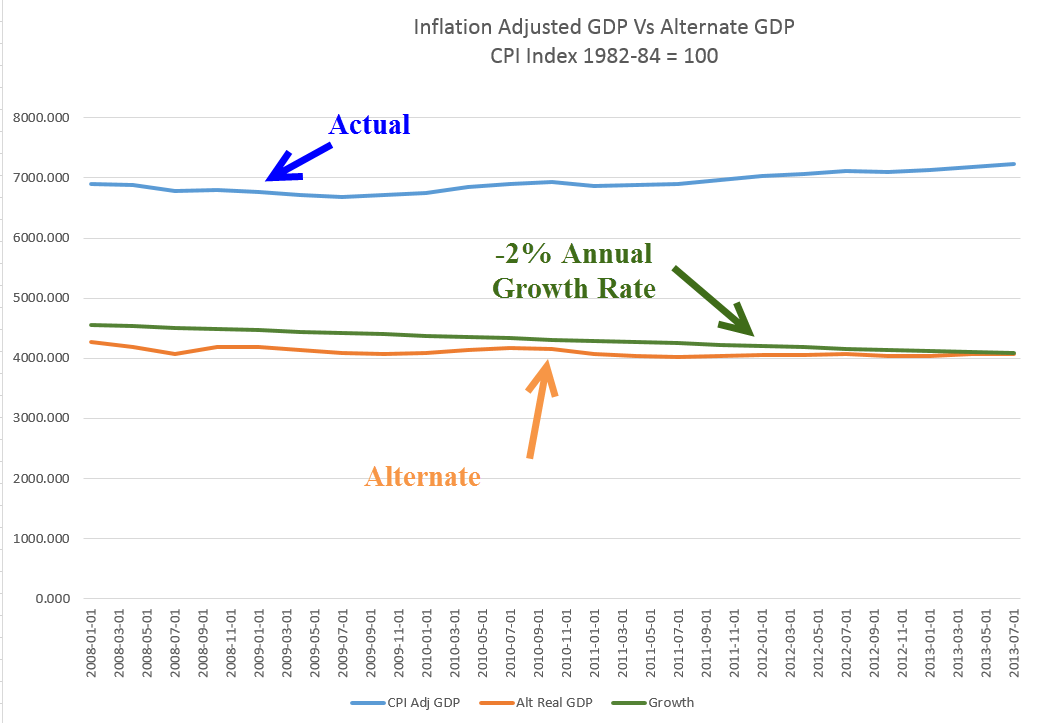
In 2008, the financial poop in the popcorn popper began to pop.  In the past 5+ years, we have experienced less than 1% real growth, not enough to keep up with population growth.  Of course, most people are wondering “what growth? It sure doesn’t feel like growth!”

The story may be told more accurately by looking once again at a comparison of inflation adjusted GDP with an alternate version of GDP, one that more realistically reflects inflationary pressures.  This chart shows a decrease of 2% per year.

Did the BLS adopt this methodology under political pressure?  Perhaps.  More likely, it was an alignment of econometric theory with political and corporate interests.  The reduction in published inflation rates did slow the growth of payments to Social Security recipients and reduced Medicare payouts to physicians and hospitals, thus shrinking budget deficits.  The government saves money, corporations make extra money, but – quietly and slowly – families lose money.

Annual cost of living adjustments to Social Security checks have been reduced but the decreased income has forced more seniors to seek assistance through the food stamp program, now called SNAP.  A politically neutral change in the measurement of inflation thus becomes a way for politicians to introduce a means testing component to Social Security income.  Instead of reducing payments based on income, payments are reduced to all recipients and poor seniors are targeted for additional benefits.  Congress has increased eligibility for the food stamp program so that seniors who are dependent on that extra income can receive it in the form of food stamps.  If the BLS had not changed their methodology, seniors would receive appoximately 60% more each month and many wouldn’t need the food stamps in the first place.

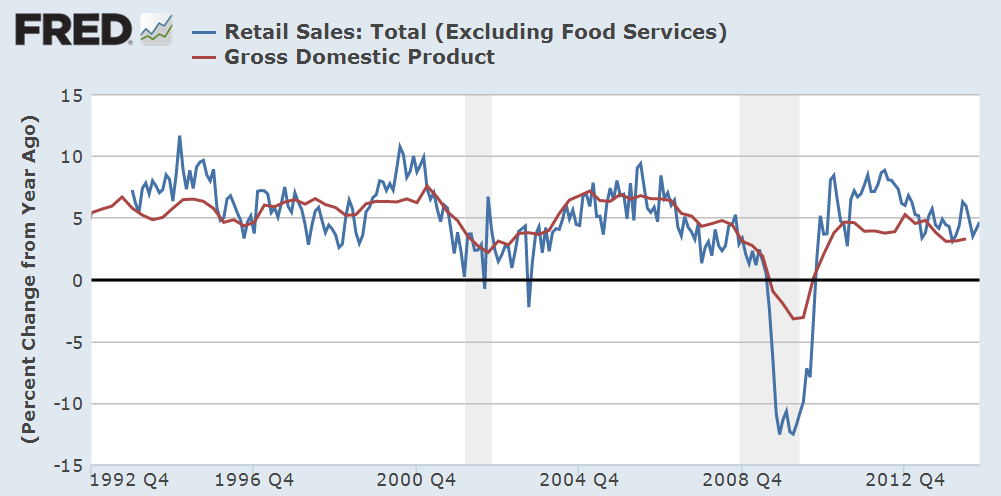
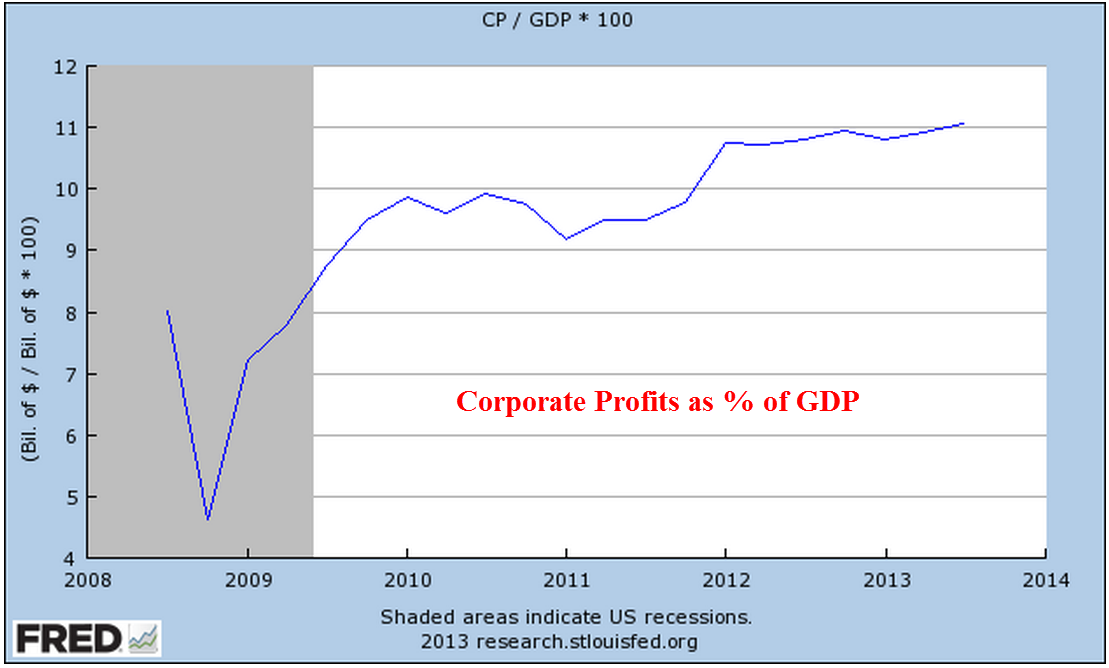
With this history in mind, let’s turn to this week’s revisions of GDP and corporate profits for the third quarter ending in September.  The real, or inflation-adjusted, growth of 3rd quarter GDP was raised to a 4.1% annualized growth rate in the third quarter, largely on upward revisions of consumer spending.  Contributing to stronger GDP growth has been a worrisome increase in company inventories, which probably influenced the Federal Reserve’s decision this week to keep any tapering of their QE bond purchases to a minimum.

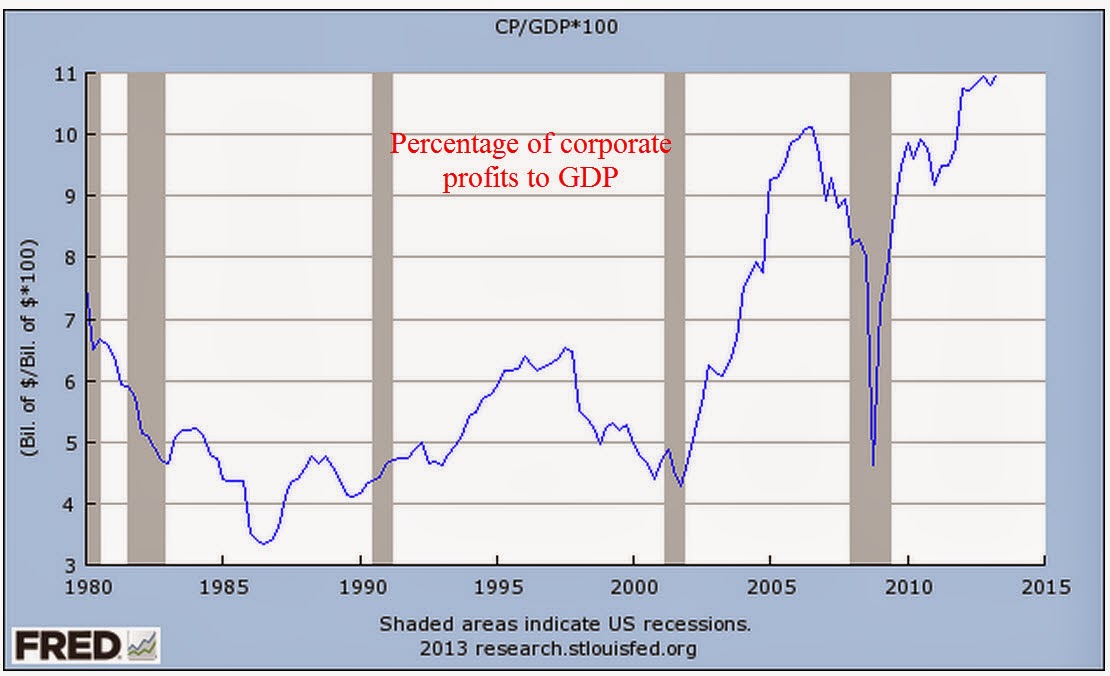
Corporate profits for the third quarter were revised higher as well.  As a share of GDP, corporate profits continue to reach all time highs.

How likely is it that economists at the BLS will change their methodology to reflect inflationary pressures before we make choices in response to rising prices?  The subject is not easily encapsulated in a sound bite or a short slogan on a placard.  In the 1992 presidential race, independent candidate Ross Pierot was able to use charts to make a point with many voters but few politicians are very good at the easel and unlikely to bring up the subject in the public forum.  Families and workers will continue to suffer and politicians will create more social benefit programs to help those hurt by problems that politicians themselves have either created or failed to address.  Large and mid sized businesses will continue to enjoy the additional slice of pie.

Retail Sales and Inflation

December 15th, 2013

Retail sales rose .7% in November, posting year over year (y-o-y) gains of almost 5%.  The twenty year average of y-o-y gains is 4.6%.  When we remove the eleven monthly outliers with gains of more than 10% or less than -10%, the average is 5.0%

Now let’s compare the percentage change in GDP with the change in retail sales.

The change in GDP is like a smoothed average of the change in retail sales, so the continuing willingness of consumers to spend is a positive for both GDP growth and the market in the mid-term outlook.

*******************************

In March 2009, incoming President Obama pledged that his administration was going to support small businesses which employ 1/2 the workforce and contribute 40% to GDP. (CBS News article  Note: The article incorrectly states that small businesses employ 70% of the workforce.) A recent report, short and written in plain English, by the Cleveland Federal Reserve compares levels of lending to small businesses in 2013 vs 2007.  Five years after the financial crisis, six years after the start of the recession, loans to small businesses are only 80% of 2007 levels.  Impacting the start up of small companies has been the decline in home values.  Home equity provides the funding for most small business start ups.

A graph from the report illustrates the long term decline of small business lending.  As the banking sector has consolidated over the past twenty years, the mega-banks have less incentive to “take a chance” on small businesses.

As I watch Senate and House hearings on C-Span (yes, I know I have a problem), I am struck by how many members of Congress appear to be on a mission.  While at times Washington seems to be a town of political prostitutes, it may be more accurate to describe it as a town of missionaries.  These dedicated men and women come to Washington with a plan to save the souls of the American people – or at least that’s the way they like to present themselves.  Nancy Pelosi and other prominent Democrats give voice to the plight of the long term unemployed but rarely mention small business owners.  A 50 year old guy who can’t find a job because his skills are out of date is a topic of concern to Democrats.  But what about the 50 year old who can’t start up a business because the drop in housing prices has diminished the equity of many home owners?  Republicans mention small businesses only when bashing Obamacare.  Why has there been so little attention paid to this rather large part of the economy?  Why aren’t the banks being subpoenaed to appear before a Congressional subcommittee?  Many Presidents seem to spend their second terms answering for the broken promises of their first term.  Finally, after eight years, voters turn to a new guy, hoping that this one will be different.  Hope, or foolishness, triumphs in the hearts of voters.

********************************

Now I’ll take a look at a contentious subject, the measurement of inflation.  A comprehensive review of the inflation measurement is far beyond my skills and a blog.  The CPI produced by the Bureau of Labor Statistics is the official measurement of inflation to adjust Social Security payments each year.  I want to come at the subject from a different viewpoint – corporate profits. Starting in 1990, the Bureau of Labor Statistics (BLS) adopted a new way of measuring inflation, introducing what is called a hedonic adjustment. Coincidentally, corporate profits began to surge shortly thereafter.  Below is a graph showing inflation adjusted profits.

Adjusting for population growth, the surge in per capita profits confirms the trend.

As I noted in September, corporate profits as a percent of GDP are at historically high levels.

In a FAQ sheet, the BLS explains their methodology in plain language and refutes the claim that hedonic adjustments have any significant impact on the CPI measurement. I have also discussed another measure of inflation, the PCE deflator.  Here is a working paper by an economist at the Federal Reserve on the PCE measurement.

For years, John Williams of Shadow Government Statistics (SGS) has painstakingly maintained an alternate data set of the CPI.  Here’s a graph from that page to give you an idea.

As you can see, the official measure of inflation is about 2 – 3% below the CPI that Williams produces using the pre-1990 methodology.  Essentially, hedonic adjustments measure inflation after consumers have adjusted to inflationary price pressures.  Let’s say that a family eats steak twice a week.  Steak then goes up in price by 20%.  To stay within their budget, a family might substitute hamburger for one of those meals.  The old method of measuring inflation would capture the 20% rise in the price of steak.  The post-1990 method does not capture all of that rise because it allows for the substitution effect.

Several reasons have been given for the dramatic rise in corporate profits since 1990.  These include globalization, technology, and increased productivity of both labor and capital.  As I wrote about in August, multi-factorial productivity has only increased 12% in the 12 years from 2000 – 2012, an annual gain of less than 1%.  Technological progress occurred in almost every decade of the past century, yet average economic growth is about 3% over those one hundred years – a remarkable consistency.  Globalization has helped and hurt domestic companies, enabling them to reduce costs but also increasing the competition from firms around the world.  Have companies found some magic key in the past twenty years?

The magic key may be the change in the CPI methodology. What if the CPI understates inflationary pressures by 2 – 3% each year?  What effects would that have?  Interest rates would be reduced, lowering the costs of borrowing for companies.  There would be less pressure from labor for wage increases.  These two factors figure heavily in the profits of many large companies. (Interest expense for GE is more than a third of their operating income ).  There is yet another effect: real profits adjusted for this higher inflation rate, would simply not be so dramatic.

Since 1990, per capita corporate profits have risen about 7.6% per year.

Now let’s adjust per capita profits for inflation using the official CPI and a higher inflation rate that is closer to the inflation measures that SGS compiles.

What we see is approximately 3% real growth in per capita profits since 1990.  This is quadruple the .75% growth rate of corporate profits for the thirty year period from 1959 – 1989.

The 30 year average was hurt by the 4% decline in inflation and population adjusted profits during the 1980s.  This decline undermines the conventional narrative that the 1980s were a big growth boom for companies.  The 50 year average of this real profit growth is 2.5%.  As a rule of thumb then, we can guesstimate inflationary pressures on consumers as the nominal rate of profit growth less 2.5%.  Let’s look at a chart I showed earlier.

The 7.6% nominal growth rate of profits less 2.5% gives us an average inflation rate of close to 5% for the past 23 years.  This different methodology lends more credence to the higher CPI calculations that SGS presents. Compare this to the 2.5% average that the BLS calculates for this time period.

Small changes in methodology add up over time.  While this “back of the envelope” method of computing inflation does not meet the rigor that Williams brings to his calculations, it does illustrate the difference in inflationary pressures that many families feel.  Here’s a comparison of the two indexes.

Now comes the juicy part and I will keep my voice low.  There is a conspiracy theory floating around that, in the late 1980s, the politicians in Washington were pressured by businesses to have the BLS revise their methodology to reduce rising labor costs which were hurting profits. Another theory says that Congress wanted to curb the annual CPI increases in Social Security and Medicare payments and secretly ordered the BLS to come up with a way to revise the CPI down.  In 50 years, financial historians may discover that both of these theories have some substance.

Whatever the “real” reason for the change in methodology, those who are dependent on retirement income indexed to the CPI should keep in mind that unmeasured inflationary pressures may eat an additional  2 – 3% out of their retirement savings base and income.

Winter Wonderland

December 8th, 2013

The Bureau of Labor Statistics rode down like Santy Claus on the arctic front that descended on a large part of the U.S. The monthly labor report showed a net gain of 203,000 jobs in November, below the 215,000 private job gains estimated by ADP earlier in the week, but 10% higher than consensus forecasts.  Thirty eight months of consecutive monthly job growth shows that either:

1) President Obama is an American hero who has steered this country out of the worst recession – wait, let me capitalize that – the worst Recession since the Great Depression, or

2) American businesses and Republican leadership in the House have overcome the policies of the worst President in the history of the United States. 

Hey, we got some Hyperbole served fresh and hot courtesy of our radio and TV!

The unemployment rate dropped to 7.0% for the right reasons, i.e. more people working, rather than the wrong reasons, i.e. job seekers simply giving up.  The combination of continued strong job gains and a big jump in consumer confidence caused the market to go “Wheeee!”

***********

A broader measure of unemployment which includes those who want work but haven’t looked for a job in the past four weeks declined to 7.5%.  This is still above the high marks of the recessions of the early 90s and 2000s.

***********

Construction employment suffered severe declines after the collapse of the housing bubble.  We are concerned not only with the level of employment but the momentum of job growth as the sector heals.  A slowing of momentum in 2012 probably factored into the Fed’s decision to start another round of QE in the fall of last year.

********

Job gains were broad, including many sectors except federal employment, which declined 7,000. Average hours worked per week rose by a tenth to 34.5 hours and average hourly pay rose a few cents to $24.15.

Discouraged job seekers are declining as well.  The number of involuntary part time workers fell by 331,000 to 7.7 million in November.  As shown in graph below, the decline is sure but slow.

***********

There are still some persistent trends  of slow growth.  Job gains in the core work force aged 25 -54 are practically non-existent.

**********

The percentage of the labor force that is working edged up after severe declines this year but the trend is down, down and more down.

*********

The number of people working as a percent of the total population has flatlined.

**********

Let’s turn to two sectors, construction and manufacturing, which primarily employ men.  The ratio of working men to the male population continues to decline.  Look at the pattern over 60 years: a decline followed by a leveling before the next decline, and so on.  Contributing to this decline is the fact that men are living longer due to more advanced medical care and a fall in cigarette smoking.

************

The taxes of working people have to pay for a lot of social programs and benefits that they didn’t have to pay for thirty years ago.  Where will the money come from?  A talk show host has an easy solution: tax the the Koch Brothers, cut farm subsidies to big corporations and defense.  Taking all the income from the Kochs and cutting farm subsidies and defense by half will produce approximately $560 billion, not enough to make up for this year’s budget deficit, the lowest in 4 years.  What else?

***********

In a healing job market, those aged 16 and up who are not in the labor force as a percent of the total population  continues to climb.

********************************

A familiar refrain is the steady decline in manufacturing employment.  Recently the decline has been arrested and there is even slight growth in this sector.  Although construction is regarded as a separate sector, construction is a type of manufacturing.  Both employment sectors appeal to a similar type of person.  Both manufacturing and construction have become more sophisticated, requiring a greater degree of specialized knowledge.  Let’s look at employment trends in these two sectors and how they complement each other.

During the 90s, a rise in construction jobs helped offset moribund growth in manufacturing employment.

In 2001, China became a member of the World Trade Organization (WTO) , enabling many manufacturers to ship many lower skilled jobs to China.  At the same time, a recession and the horrific events of 9/11 halted growth in the construction sector so that there was not any offset to the decline in manufacturing jobs.

As the economy began recovering in late 2003, the rise in construction jobs more than offset the steadily declining employment in the manufacturing sector.  People losing their jobs in manufacturing could transition into the construction trades.

As the housing sector slowed, construction jobs declined and the double whammy of losses in both sectors had a devastating effect on male employment.

In the past three years, both sectors have improved.

Although the Labor Dept separates two sectors, we can get a more accurate picture of a trend by combining sectors.

*********************************

In the debate over the effectiveness of government stimulus, there is a type of straw man example proposed:  what if the government were to pay people to dig holes, then pay other people to fill in the holes?  Proponents of Keynesian economics and government stimulus argue that such a policy would help the economy.  Employed workers would spend that money and boost the economy. Those of the Austrian school argue that it would not.  Digging and filling holes has no productive value.  Ultimately it is tax revenues that must pay for that unproductive work.  Therefore, digging and filling holes would hurt the economy.

So, let’s take a look at unemployment insurance through a different set of glasses.  Politicians and the voters like to attach the words “insurance” and “program” to all sorts of government spending.  Regardless of what we call it, unemployment insurance is essentially paying people to dig and fill holes – except that the holes are imaginary.  IRS regulations state that unemployment benefits are income, that they should be included in gross income just as one would include wages, salaries and many other income.

If unemployment is income, how many workers do the various unemployment programs “hire” each year?  Unemployment benefits  vary by state, ranging from 1/2 to 2/3 of one’s weekly wage. (Example in New Jersey)  As anyone who has been on unemployment insurance can verify, it is tough to live on unemployment benefits. I used the average weekly earnings for people in private industry and multiplied that by 32 weeks to get an average pay, as though governments were hiring part time workers.  I then divided unemployment benefits paid each year by this average.  Note that the divisor, average pay, is higher than the median pay, so this conservatively understates the number of workers that are “hired” each year by state and federal governments.

What is the effect of “hiring” these workers?  I showed the adjusted total (blue) and the unadjusted total of unemployed and involuntary part time workers.  The green circle in the graph below illustrates the effect that extensions of unemployment insurance had on a really large number of unemployed people.

At its worst in the second quarter of 2009, the unemployed plus those involuntary part timers totaled 24 million, almost 16% of those in the labor force.  8 million were effectively “hired” to dig imaginary holes.  In the long run, what will be the net effect of paying people to dig holes and fill them?  First of all, a politician can’t indulge in long run thinking.  In a crisis, most politicians will sacrifice long run growth so that they can appease the voters and keep their own jobs.

In the long run, ten years for example, paying people to do nothing productive will hurt the economy.  The argument is how much?   Keynes himself wrote that his theory of stimulus and demand only worked when there was a short run fall in demand.  At the time Keynes wrote his “General Theory,” the world economy was floundering around in a severe depression.  The severe crisis of the Depression birthed a theory that divided the economists into two groups: the tinkerers and the non-tinkerers.  Keynesian economists believe in tinkering, that adjusting the carburetor of the economic engine will get that baby purring.  Austrian or classical economists keep asking the Keynesians to stop messing with the carburetor; that all these adjustments only make the economy worse in the long run.

***********************************

The November report from the Institute for Supply Management (ISM) showed strong to robust growth in the both the manufacturing and services sectors.  As I noted this past week, I was expecting the composite CWI index of these reports that I have been tracking to follow the pattern it has shown for the past three years.  Within this expansion, there is a wave like formation of surging growth followed by an easing period that has become shorter and shorter, indicating a growing consistency in growth.  The peak to peak time span has decreased from 13 months, to 11 months to 7 months.  The index showed a peak in September and October so the slight decline is following the pattern.   IF – a big if – the pattern continues, we might expect another peak in April to May of 2014.

To get some context, here’s a ten year graph of the CWI vs the SP500 index.

**********************************

As the stock market makes new highs each week, some financial pundits get out of bed each morning, saddle up their horses, load up their latest book in the saddle bags and ride through TV land yelling “The crash is coming, the crash is coming.”  Few people would listen to them if they shouted “Buy my book, buy my book.”  They sell a lot more books yelling about the crash.

How frothy is the market?  I took the log of the SP500 index since January 1980 and adjusted it for inflation using the CPI index.  I then plotted out what the index would be if it grew at a steady annualized rate of 5.2%.   Take 5.2%, add in 3% average inflation and 2% dividends and we get the average 10% growth of the stock market over the past 100 years.  The market doesn’t look too frothy from this perspective.  In fact, the financial crisis brought the market back to reality and since then, we have followed this 100 year growth rate.

Now, let’s crank up the wayback machine.  It’s November 1973.  Despite the signing of the Paris Peace accord and an act of Congress to end the Vietnam war, thousands of young American men are still dying in Vietnam.  The Watergate hearings continue to reveal evidence that President Nixon was involved in the break in of the Democratic National Committee and the subsequent attempts to cover it up.  Rip Van Winkle is disgusted.  “This country is going to the dogs,” he mutters to himself.  He lies down to take a nap in an alleyway of the theater district of New York City.  The SP500 index is just below 100.  Well, Rip doesn’t wake up for 20 years.  In November 1993, he wakes up, walks out on Broadway and grabs a paper out of nearby newspaper machine.  The SP500 index is 462.  Rip doesn’t have a calculator but can see that the index has doubled a bit more than twice in that time.  Using the rule of 72 (look it up), Rip estimates that the stock market has grown about 8% per year.  Which is just about normal.  But normal is what Rip left behind in 1973.  “Normal” is SNAFU.  So he goes back into the alleyway and goes back to sleep for another twenty years, waking up just this past month.  He walks out on Broadway and reads that the index has passed 1800.  “Harumph” Rip snorts.  That’s two doublings in twenty years, a growth rate of a little over 7%.  Rip reasons that eventually he’ll wake up, the country will have mended its ways and Rip will notice a growth rate of 9 – 10% in the market index.  He goes back to sleep.

In the 40 years that Rip has been asleep, we have had three bad recessions in the 70s, 80s and 2000s, a savings and loan crisis in the 80s, an internet bubble, a housing bubble, and the mother of all financial crises.  Yet the market plods along, slowing a bit, speeding up a bit.  Long term investors needs to take a Rip Van Winkle perspective.

***********************************

And now, let’s hop in the wayback machine – well, a little ways back.  Shocks happen.  During periods when the market is relatively well behaved as it has been this year, investors get lulled into a sense of well being.  From July 2006 through February 2007, the stock market rose 20%.  Steadily and surely it climbed.  Housing prices had already reached a peak and the growth of corporate profits was slowing. Some market watchers cautioned that fundamentals did not support market valuations. At the end of February 2007, the Chinese government announced steps to curb excessive speculation in the Shanghai stock market (CNN article).  The stocks of Chinese companies tumbled almost 10%, sending shocks through markets around the world.  The U.S. stock market dropped more than 5% in a week.

“Here comes the crash” was the cry from some. The crash didn’t come.  Over the next six months, the market climbed 16%.  Finally, continuing declines in home sales and prices, growing mortgage defaults and poor company earnings began to eat away at the market in October 2007.  Remember, there is still almost a year to the big crash in September and October of 2008.

**************

Next week I’ll put on a different shade of glasses to look at inflation.  Cold air, go back to the North Pole.

Investing, New Orders, Small Business

December 4th, 2013

This will be a mid-week post of various items I thought were interesting.  The private payroll processor ADP is showing private employment growth 215,000, about 15% above expectations.  This weekend, I’ll cover the employment situation and some long term trends.

***************************
When we buy bonds, we are buying someone’s debt. Really what we are buying is the likelihood that they will pay that debt.  When we buy stocks, we are buying someone’s profits – or the future prospects of those profits.  The S&P500 is an index of the 500 largest domestic corporations.  The BEA tracks the profits of all domestic corporations, not just the 500 largest, before tax adjustments. It is rather interesting to look at the ratio of the SP500 index to corporate profits, in billions.

Using this metric, the exuberance of the internet bubble is striking, far surpassing the housing bubble of the 2000s. It was a time when investment was high in the new digital economy.  The ingenuity of man had finally overcome the business cycle.   The ratio of stock prices to profits didn’t matter because profits were about to go through the roof, man!

Well, it would take a while but eventually profits did go through the roof.  It took a few years.  As a percentage of the nation’s GDP, corporation profits are near 11%.

So pick the story you want to tell.  1) Stocks are undervalued based on historical ratios of prices to profits.  2) Stocks are going to crash because corporate profits are too much a percentage of the economy, an unsustainable situation.  Both narratives are out there in the business press.

*************************************************

New orders for non-defense capital goods excluding aircraft has been declining of late.

Below is a chart showing the year over year percent gains in new orders and the SP500 index.  There is a loose correlation.  The stock market is usually responding to predictions of future activity as well as political and financial news.   I modified the changes in the SP500 by a little more than half to show the overall trend.

******************************************

In 2012, households finally surpassed 2007 levels of net worth.   In the past five years, household assets have risen by a third, more than $14 trillion dollars. More than half of that increase is the rise in stock asset values. In that same period, liabilities have decreased slightly from the $20 trillion.  All of the decrease and more is in mortgages.  This table shows the unsustainable growth in net worth during the housing boom.

Check out the growth in household debt during the housing boom.  Over 10% per year!  Now look at the growth in Federal debt.  There are only two years where it falls below 5%.  Someone once said something like “What can’t go on forever, won’t”.  How long can a government increase its debt 4x, 5x, 10x the rate of inflation or the rate of economic growth?

***********************************

A short and very informative book on investing by William Bernstein.

Deep Risk: How History Informs Portfolio Design (Investing for Adults)
William Bernstein

*************************************

Words of caution:

“A government big enough to give you everything you want is a government big enough to take from you everything you have.” – Gerald Ford

****************************************

Gallup’s survey of consumer spending in November was the strongest November in 5 years.  On the other hand, early reports of the y-o-y gains in retail spending over the 4 day Thanksgiving weekend indicated a meager 2.3%, barely above inflation.  Same store sales at department stores declined -2.8% in the Thanksgiving/Black Friday week, although they are up 2.5% year over year.  As I wrote about two weeks ago, online shopping is now a significant portion, 20%, of total retail sales.  A more complete feel for the consumer’s mood must include sales on Cyber Monday, the Monday after Thanksgiving.  These showed exceptional gains of 17% over last year’s numbers.

****************************************

ISM’s Manufacturing index was 57.3, the strongest in 2-1/2 years.  I’ll update the CWI after I input today’s numbers from the non-manufacturing report.  I was expecting a slight tapering in the composite.  As we saw a few weeks ago, there has been a positive wavelike action and it appeared as though the economy had hit a crest in October.

****************************************

In 2010, the Census Bureau reported that there were 5.7 million employers (those with payroll, as opposed to sole proprietors), a decrease of 300,000 from the 6 million employers the Census Bureau counted in 2007.  About 5.1 million employers had less than 20 employees and accounted for 14% of the $5 trillion in payroll. Those small to mid-size companies with 20 to 99 employees accounted for another 14% of payroll.  Mega-employers, those with 500 or more employees, paid out about 57% of total payroll in 2010 and constitute a little more than half of private employment.  These large employers naturally have more influence on policy makers in Washington and in state capitols throughout the nation.

 *****************************************

The National Federation of Independent Businesses’ (NFIB) recent monthly survey reported a fairly sharp decline in sentiment among small business owners. A hopeful sign in this report is the improvement in expectations for future sales.  Sentiment was particularly depressed over the shenanigans in Washington and pessimism towards the regulatory environmnent is near all time highs. A blend of small cap stocks has risen about 36% in the past year.  Small cap value stocks have soared 40%.

*****************************************
An interesting historical note from the Social Security administration.  As  preamble, Social Security taxes are collected and put in a “separate” accounting fund before they are immediately “borrowed” for the general spending needs of the Federal government.

 President Roosevelt strenuously objected to any attempt to introduce general revenue funding into the program. His famous quote on the importance of the payroll taxes was: “We put those payroll contributions there so as to give the contributors a legal, moral, and political right to collect their pensions and unemployment benefits. With those taxes in there, no damn politician can ever scrap my social security program.” 

In 1937, the Supreme Court ruled that the Social Security Act was constitutional.  The majority opinion, penned by Justice Cardozo: “The hope behind this statute [the Social Security Act] is to save men and women from the rigors of the poor house as well as from the haunting fear that such a lot awaits them when journey’s end is near.”

**************************************

Quite often, our auto or homeowner’s insurance company changes insurance plans on us.  The insurance company sends us a notice that, due to legislative changes or revised company policy, there is a new codicil to all insurance contracts.  Premiums may go up.  The insurance company’s liability may be reduced. Your old plan is being cancelled and reissued with a “-1A” after the policy number. Some of us may skim read the new changes, most of us shrug and sign the new contract and that is the end of the story.  Imagine the headlines: “MINIMUM DEDUCTIBLE RAISED TO 1% OF HOME’S VALUE.  ALL HOMEOWNERS’ INSURANCE CONTRACTS CANCELLED.”  This is what happens.  The old insurance contract is no longer available.

What is the response when the same thing happens to private health insurance  plans under Obamacare?  “Obamacare Forces over 800,000 in N.J. to change insurance plans” is the bold caption of one news story.  People who are unsympathetic to the new health care law will not make the distinction between “insurance plan” and “insurance carrier.”

Investment Allocation and Housing

December 1st, 2013

While cleaning up some old files, I found a 1999 “Getting Going” column by Jonathan Clemens in the Wall St. Journal.  That year was rather turbulent, rocked by Y2K fears that the year 2000 might play havoc with older computers still using a two digit date,  and a intensifying debate about the valuation of stocks.  Looking away from the hot internet IPOs of that year,  Clemens interviewed several professors about the comparatively mundane subject of home ownership.

 “A house is not a conservative investment,” says Chris Mayer, a real-estate professor at the University of Pennsylvania’sWharton School. “Any market where prices can fall 40% in three years is not a safe investment.” 

Remember, this is 1999.  At that time, what 40% decline is he talking about?  It would not be till 2009 or 2010 that house prices tumbled down the hill.  In the past, declines of this magnitude were confined to particular areas of the country where a fundamental shift  in the economy occurred.  The Pittsburgh area of Pennsylvania, the Pueblo area of Colorado and the Detroit area of Michigan come to mind. In the first two examples the collapse of the steel industry had a profound effect on home prices as people moved to other areas to find work.  In case a homeowner thinks “it can’t happen here,” I’m sure many homeowners in Detroit felt the same way during the 1960s when the car industry was at its peak.

“William Reichenstein, an investments professor at Baylor University in Waco, Texas, suggests treating your mortgage as a negative position in bonds.”  

What does this mean?  Let’s say a person has $100K in stock mutual funds, $100K in bond mutual funds, owns a house valued at $200K with $100K still left on the mortgage.  Subtract the remaining balance of the mortgage from the amount in bonds and that leaves $0 invested in bonds.  Why do this?  When we buy a bond we are buying the debt of a company, or some government entity.  A mortgage is a debt we owe.  So, if a person were to pay off the mortgage, trading one debt for another, they would sell their bonds to pay off the mortgage.

Should the house be included in the investment mix?  There is some disagreement on this.  An investment portfolio should include only those assets which a person could access for some cash flow if there was a loss of income or some other need for cash.  An older couple with a 5 BR house who intend to downsize in five years might include a portion of the house in the portfolio mix.

For this example, let’s leave the house out of the investment portfolio to keep it simple. Using this analysis, this hypothetical person has 100% of their assets in stocks, not a 50/50 mix of stocks and bonds.

Now, let’s fast forward ten years from 1999 to 2009.  An index mutual fund of stocks has lost a bit more than 20%.

A long term bond fund has gained about 100%.

[The text below has been revised to reflect the above bond fund chart.  The original text presented numbers for a different bond fund.]

Let’s say the mortgage principal has been paid down $60K over those ten years.  Assuming that no new investments have been made in the ten year period, what is this person’s investment mix now?  The stock portion is worth $80K, the bonds $200K less $40K still owed on the mortgage for a total of $240K, with a net exposure in bonds of $160K.  The person now has 33% (80K / 240K) in stocks and 67% in bonds, a conservative mix.  If we didn’t account for the mortgage as a negative bond, the mix would appear to be 29% (80K / 280K) for stocks and 71% for bonds.  What is the net effect of treating a mortgage balance as a negative bond?  It reduces the appearance of safety in an investment portfolio.

Now let’s imagine that this person is going to retire and collect a monthly Social Security check of $1500.  To get a 15 year annuity paying that monthly amount with a 3% growth rate, a person would have to give an insurance company about $220K (Calculator)   There are a lot of annuity variations and riders but I’ll just keep this simple.  Throughout our working lives our Social Security taxes are essentially buying Treasury bonds that we start cashing out during retirement.

If we were to add $220K to our hypothetical investment mix,  we would have a total of $460K: $80K in stock mutual funds, $200K in bond funds, -$40K still owed on the mortgage, $220K effectively in Treasury bonds that we will withdraw as Social Security payments.  The $80K in stock mutual funds now represents only 17% of our investment portfolio, an extremely conservative risk stance.  If we have a private pension plan, the mix can get even more conservative.

The point of this article was that many people in their 50s and 60s may have too little exposure to stocks if they don’t account for mortgages, pensions and Social Security payments into their allocation calculations.

*****************************

In October 2005, the incoming Chairman of the Federal Reserve, Ben Bernanke, indicated to Congress that he did not think there was a bubble developing in the housing market. (Washington Post Source)

In September 2005 – a month before – the Federal Reserve Bank of New York published a report on the rapid housing price increases of the past decade:

Between 1975 and 1995, real [that is, inflation adjusted] single-family house prices in the United States increased an average of 0.5 percent per year, or 10 percent over the course of two decades. By contrast, from 1995 to 2004, national real house prices grew 3.6 percent per year, a more than seven-fold increase in the annual rate of real appreciation, and totaling nearly 40 percent in one decade. In some individual cities, such as San Francisco and Boston, real home prices grew about 75 percent from 1995 to 2004, almost double the national average. 

Remember, these are real, or inflation adjusted prices.  Now it is easy, in hindsight, to go “ah-ha!” but it should be a lesson to us all that we can not possibly hope to consume all the information needed to mitigate risk.  There is just too much information.  A professional risk manager, Riccardo Rebonato, discusses common flaws in risk assessment in his book “Plight of the Fortune Tellers” (Amazon). Written before the financial crisis, the book is surprisingly prescient.  The ideas are accessible and there is little if any math.

*************************************
On Monday, the National Assn of Realtors released their pending home sales index. These are signed contracts on single family homes, condos, and townhomes. The index has declined for five months but is still slightly above normal (100) at 102.1.  At the height of the housing bubble, this index reached almost 130.  At the trough in 2010, the index was below 80.

This chart was clipped from a video by an economist at NAR (Click on the video link on the right side of the page).  The clear and simple explanation of trends in housing and interest rates is well worth five minutes of your time.  Sales of existing homes have surpassed 2007 levels and are growing.

Demographia surveys housing in m ajor markets around the world and rates their affordability.  Their 2012 report found that major markets in the U.S. are just at the upper range of affordable.  As Canada’s housing valuations have climbed, their affordability has declined and are now less affordable than the U.S.  Britain’s housing is in the severely unaffordable range.

*****************************
Next Friday comes the release of the monthly employment report.  I’ll also cover a few long term trends in manufacturing and construction employment that may surprise you.

Retail, Housing, The Fed And More

Last week I pointed to several contradictory outlooks for sales in the upcoming holiday season.  Bill McBride at Calculated Risk has several charts on the import and export volume at the port of Los Angeles.  The import data indicates that businesses were buying goods in late summer and the fall in anticipation of a good holiday season.  Both Home Depot and Best Buy reported better than expected earnings on Tuesday but Best Buy’s sales were less than expected.  The company cited increasing pressure from online retailers.  E-Commerce continues to take an ever increasing share of the retail sales market.

Amazon is now making more money selling other vendors’ products than it does its own.  Vendors typically turn over much of the sales, shipping and billing process to Amazon.  Businesses, including mine, are increasingly turning to Amazon for parts or supplies.  Why?  Amazon has become an easy to search portal for so many vendors and the prices are competitive.  Why spend time searching the web for long discontinued parts when Amazon has already done that?  What is even more surprising is the enormous volume of third party items that Amazon now stocks and, surprisingly, the items are received from Amazon, not the vendor.

On Wednesday, the monthly report of retail sales showed a .4% month on month gain, causing analysts at Morgan Stanley to reverse their earlier dour opinion of the coming holiday season.  The year over year gain is at 4% but retailers that target lower income consumers are experiencing some difficulties.  J.C. Penney reported sales and earnings that were disappointing.  After an earlier upbeat report from the home improvement chain Home Depot, Lowe’s reported strong sales and earnings, confirming the continuing strength in this sector.  Later in the week, Target issued a disappointing earnings report.  Will the ongoing decline in gas prices leave working class families with enough extra cash in their wallets this Christmas season?  Wal-Mart, Target and J. C. Penney hope so.

**************************
[Revised to clarify the two separate housing indexes below]

 October’s housing market index reading of 54 from the National Assoc of Homebuilders indicated continuing strength in the new home market.  This index is a composite of factors, including sales, inventory, builder expectations and traffic.  The series, like the industrial reports, is indexed so that 50 is the neutral mark, indicating no net growth.  Although the overall index has declined from the summer peak, both sales and expectations are in the strong to robust growth.

The Federal Housing Finance Agency tracks an index of home prices (only).  Major markets on both the east and west coasts are still below the bubble peaks of 2005 – 2006.

From 1983 to 1999, the average house cost 13 to 15 years worth of rent.  This baseline is a good rule of thumb when pricing out houses.  In 2006, at the height of the housing bubble, houses were selling for 25 years worth of the average monthly rental.  Los Angeles experienced a much greater price inflation during the 2000s than either SF or NYC.  Although the nationwide economy is growing steadily but slowly, Los Angeles has responded to the strong growth in manufacturing throughout the country. Asking rents for industrial properties in L.A. are rocketing upward this year, accelerating from the strong three year growth and exceeding the price levels of 2007.

http://www.loopnet.com/xNet/MainSite/Tools/WidgetHTML.aspx?WidgetType=50&CountryCode=US&StateCode=CA&State=California&CityName=Los+Angeles&SiteID=1&TrendTypeID=2&PropertyTypeID=40&ListingType=LEASE&PropertyType=Industrial&TrendType=Asking%20Rent Available Office and Industrial property in the LA area is at multi-year lows.

http://www.loopnet.com/xNet/MainSite/Tools/WidgetHTML.aspx?WidgetType=50&CountryCode=US&StateCode=CA&State=California&CityName=Los+Angeles&SiteID=1&TrendTypeID=5&PropertyTypeID=80&ListingType=LEASE&PropertyType=Office&TrendType=No.%20of%20Spaces

Los Angeles, CA Market Trends

**************************

http://www.loopnet.com/xNet/MainSite/Tools/WidgetHTML.aspx?WidgetType=50&CountryCode=US&StateCode=CA&State=California&CityName=Los+Angeles&SiteID=1&TrendTypeID=5&PropertyTypeID=40&ListingType=LEASE&PropertyType=Industrial&TrendType=No.%20of%20Spaces
The Consumer Price Index released Wednesday showed a tiny decrease in inflation for the month.  The year over year change was 1.7%, indicating that demand at many levels is positive but weak so that there is little pressure on prices.  On Thursday, the Producer Price Index (PPI) confirmed that the supply chain is experiencing very low upward pressure.

***************************

The PMI Flash Index, a preview of the upcoming report on the manufacturing sector, confirmed the continuing growth in the manufacturing sector.

***************************

The Job Openings and Labor Turnover Survey (JOLTS) by the BLS was released on Friday.  Unlike the timeliness of the monthly Employment report, this one lags by a month but does provide a more comprehensive analysis of the growth or decline in the labor market.  The BLS surveys employers at the end of the month, September in this case, for job openings and layoffs.  A job opening can be full time, part time, seasonal or temporary so the data can be skewed by seasonality factors.  The longer term trend, though, is apparent.

It may be several more years before job openings reach the level attained during the tech boom of the late ’90s.  Like the gold fever of the mid-19th century, investors poured money into a lot of ventures with little more than a napkin sized business plan.  This pattern of bubble and bust is fairly typical when game changing technologies emerge.  The spread of the telegraph and railroads led to horrific recessions in the late 19th century, culminating in the depression of 1893-94.  The rise of radio in the 1920s prompted speculative fever that contributed mightily to the crash of 1929, setting the stage for the bad monetary policy and haphazaard fiscal policies that fed the depression of the 1930s.  In the 1960s, a rush of investment in airlines and war funding helped fuel a frenzy of speculation that crashed in 1970.

******************************

In Washington this week, the Senate voted to change the rules for Senate confirmation of most executive and judicial appointments, the so called “nuclear option” that requires only a majority vote for confirmation.  This modification of the filibuster rule should have been done ten years ago when then Democratic Senate Minority Leader Tom Daschle led filibusters to block many of George Bush’s appointments.  Since then, the Senate has grown ever more dysfunctional, incapable of even ordering pizza.  Under the elitist filibuster rules, each Senator could act like a despot or one of the “Knights who say ‘Nee’!” in the comic movie “Monty Python and the Holy Grail.”  A Senator representing 300,000 people in Wyoming could nix or delay an executive appointment – this in a country of over 300 million. Sounds a bit like England in the 1770s. A lot of people died in the Revolutionary War so that America would not be a country ruled by a despot, be it a king or a Senator.

*******************************

The rule change makes the confirmation of Janet Yellen as the next chair of the Federal Reserve a near certainty. In a speech at the Cato Institute’s Annual Monetary Conference, Charles Plosser, President of the Philadelphia branch of the Federal Reserve, made a good case for some restraint by the Federal Reserve – not in the amount of debt the Fed purchases but the type of debt:

“[The Federal Reserve’s] purchase [of] specific (non-Treasury) assets amounted to a form of credit allocation, which targets specific industries, sectors, or firms. These credit policies cross the boundary from monetary policy and venture into the realm of fiscal policy.”

Mr. Plosser would rather see politicians, not central bankers, decide which industries to favor through bailouts or loan purchases.  In a democratic republic like ours, if the politicians in Washington want to bailout banks or the housing sector, they can do so by issuing general debt obligations, Treasuries, which the Federal Reserve can buy.  Gridlock in Washington has prevented them from reaching any consensus about these policies, leaving it up to the Federal Reserve to act in their place, to make political decisions which compromises the neutral stance that a central bank should have.

Now, we might say that the result is the same so what’s the big deal?  Knowing that Fed chairman Ben Bernanke would come to the rescue has allowed politicians to not make difficult compromises.  Why should they?   If Congress does less, the Fed does more.  Because it can be so difficult to enact their agenda through the political process, Presidents and political parties turn to the Fed as the fourth branch of government.

Plosser also questions the dual target of both inflation and unemployment that the Fed has assumed as its mandate.  The law states that the Fed should enact monetary policy that is “commensurate” with the “long run potential to increase production.”  Since the recession began in 2008, the Fed has adopted a series of “QE” short term measures designed to decrease unemployment and Plosser’s view is that these are not part of the job description.  Plosser will be a voting member in 2014.  His vote of restraint is unlikely to hold much sway with Janet Yellen, who is ready to keep the cornucopia money machine flowing.

****************************

In the Wall St. Journal’s Washwire Blog, Elizabeth Williamson writes that the White House is conducting a self-assessment in the wake of the health-law launch, “recognizing that administration officials missed warning signs and put too much trust in their management practices.”   What on earth has given this administration any reason to trust their management practices?  Was it their management of the attack on the U.S. consulate in Benghazi in September 2012?  Or perhaps the “red line” that President Obama drew with Syria, promising a military response if Syria used chemical weapons against its own people?  Or the terribly mismanaged mortgage relief program, HAMP, that former Treasury Secretary Tim Geithner put in place?

This is only a partial list of the persistently poor management practices that have marked this administration.  It began with the poor preparation in advance of the March 2009 meeting with the nation’s largest banks, leading Obama and Geithner to offer generous terms to the banks when the banks would have accepted any terms in order to stay alive.  The crafting of the stimulus bill was an example of indecisive leadership and management at one of those rare times in history when both houses of Congress were controlled by the President’s party.  Using a basketball analogy, the administration blew a layup.

Now comes the news that the Obama administration wants to exempt some union health care plans from a “reinsurance tax” – about $63 per person per year – that all plans under the ACA health care law pay.  How will they do this?  By a carefully worded exemption that applies only to self-administered health plans.  A little background.  Many big companies self-insure and hire an administrator like Blue Cross to take care of the details.  Under the Taft-Hartley act passed after World War 2, employers often in the same industry may collectively construct or join what is essentially a health insurance trust, offering their employees insurance through the trust.  These plans are called “Taft-Hartley Multi-employer Health and Welfare Plans” and are really a benefit in the construction trade because they enable smaller employers to offer employees – usually these are unionized employees – a health plan at more affordable rates, taking advantage of the larger pool of insured offered by the trust.  It also enables employees to move from one company to another and retain their health insurance.  The plans are defined as self-administered even though the trust may contract out the details of daily management to a third party.   So here is a plan that fills a need and offers a benefit to both employers and employees.  Labor unions, like everyone else, want special treatment, of course, so they have been lobbying for an exemption from this rather small tax.  In September the Huffington Post reported that the unions were having little success in lobbying for another exemption – the ability of these plans to qualify for subsidies as though they were individual health care plans.

With a history of spineless leadership from an Obama administration that can’t say no but can’t say yes either, unions will continue to press for special treatment.  Finally, even they may get disgusted with an administration that can’t take a stand.

Like the Durango-Silverton narrow gauge train, the stock market chugs up the hill.  Production, sales and employment reports are either strong or not too bad or neutral but not bad.  Short, mid and long term volatility measures are subdued.  Gold has been drifting steadily down, nearing the lows of July.  Of course, some say that the time to get worried is when no one is worried.

The biggest worry for many in the coming week may be a dry turkey, or a heated discussion about politics.  Do pass the sweet potatoes if asked even if that so-and-so relative of yours is dumber than the potato.  Happy Turkey Day!

Trends and Bubbles

November 17, 2013

This week the department store Macy’s reported sales growth that was above forecast.  Same store sales rose 3.5%, about 50% better growth than expected.  Macy’s attracts a higher income customer than Target, J.C. Penney or Wal-Mart.  On Thursday, Wal-Mart announced that their sales had declined for a third quarter in a row.  The holiday season depends on lower and middle working class folks, the kind who shop at Wal-Mart, to open their pockets.  Investment firm Morgan Stanley expects this retail season to be the worst since 2008 when the country was deep in recession. (Source)
What can we learn from a bird’s eye view of the growth in consumer credit?  At 5.6% year over year, it is stable.

Note the response time lag in this series.  The growth in consumer credit did not decline below 5% till months after the recession started.  Despite the loss of hundreds of thousands of jobs in the beginning of 2008, this net job loss represented less than 1% of the work force in mid-2008.  The job loss would mount into the millions but jobs are “sticky,” meaning that a downturn in the economy has a minor effect on most people most of the time.  After the fact, it is easy for us to point at some chart, arch our eyebrows in a knowing glance, and say “We can see the breakdown of the economy beginning here.”

On a long term chart, we can see a reduction in growth swings over the past thirty years.  Relatively flat income growth for a majority of workers has dampened the swings.  While good for household balance sheets, it means that we can expect less economic volatility but also muted growth for the next decade.

Expectations for the holiday season are not reflected in the price of retail stocks.  A basket of retail companies has grown about 40% this year and is up about 70% over two years.  It may be time to take a bit off the table in this sector.

The Consumer Financial Protection Bureau (CFPB) was created a few years ago to act as a watchdog over the credit practices of the largest banks.  On Tuesday, Richard Cordray, Director of the agency appeared before a Senate committee.  He confirmed that the agency collects a lot of anonymized data on 900 million credit card accounts each month as part of its supervisory role.  Questions should be raised whenever any government agency collects data on us.  How is the data protected?  Who has access to the data?  What about my privacy?

Mr. Cordray noted that several other agencies as well as private industry collect this data.  Because the data is anonymized, we are little more than a number to  the agency, but there are several concerns.  Federal agencies have a great deal of legal power, enabling them to get a warrant to access  the data on anyone.  Cordray repeatedly assured the committee that no one at the agency is interested in our personal data but left off one adverb – “now.”  In the aftermath of 9-11, anti-war protestors found themselves turned away at airports or flagged for additional screening.  How did federal agencies know the travel plans of many protestors?  It does not take a team of FBI agents to trace the activities of any citizen when several federal agencies have our monthly financial activity at their fingertips.  Secondly, there is the matter of security.  How many parties does our data go through on its way to the agency?  Where and at what stage in the process of data aggregation is the anonymizing done?  Is our personal credit card info transmitted first to a separate third party anonymizer before being transmitted to the various agencies?  Is the raw data being transmitted to an agency which then anonymizes the data using a third party program or process?  In any case, it was clear that our monthly card transactions are making the rounds in both private industry and various government agencies.

The stock market continues to rise, prompting talk of a bubble.  If you have access, try to read “Is This A Bubble” by Joe Light in this weekend’s edition of the Wall St. Journal.   It is both informative and measured in its assessment.

 In February 2012, I mentioned the Golden Cross which had occurred in late January.  This long term indicator of market sentiment is a crossing of the 50 day moving average of stock market prices above the 200 day average.

Since then the market has risen about 40%.  Man, if I had only taken my own advice and moved all my investments and money into the stock market!  As the market continues to rise, more and more investors catch the “if only” disease and start moving money from safer investments into stocks.  This is why many of us tend to buy high and sell low.  Instead we should stay with the fundamentals of diversify, diversify, and lastly – diversify.  A long term indicator like the Golden Cross is not a signal to dump all of our savings into stocks – unless we are in our 30s and have lots of time before we need the money.  A more sensible approach is to adjust allocation upwards towards stocks and this depends on a person’s age, needs, and fears.  If a person has a 50% stock allocation, with the remaining 50% in bonds and cash (I’ll leave alternate investments out for right now), that indicates a moderate tolerance for risk.  They might shift the allocation to 55% stocks or 60% when they see a Golden Cross.   A person who has a 70% allocation to stocks, indicating a high tolerance for risk, might start adjusting to an 85% to 90% allocation.  Using this more moderate approach, a person would have lightened up their stock allocation in December 2007 when a reverse Golden Cross happened.

So what if someone has been very scared of the stock market and has only 10% of their savings in stocks?  Should they move some money into the market now?  That depends.  If the thought of making even a slight change leads a person to lose sleep, then no.  Should someone change their allocation of stocks from 10% to 50% now?  That is a major allocation change and should be done using dollar cost averaging.  This is a process where one takes money from one investment basket every month and puts it in another investment basket. There is also a psychological advantage to this approach.  As a person’s allocation percentage becomes a bit riskier, they can adjust to the additional risk in a measured way.

Tolerance for risk is a composite of several components:  psychological or emotional, future liquidity needs, age, and assets as well as income sources.  Too often, people think of tolerance for risk as an emotional response only.  While it is true that our emotions can cloud our measured response to risk, it is important to keep in mind that it is only one of the components.

**************

In answer to calls from his own party members, President Obama announced an administrative change to the Affordable Care Act (ACA) that allows those with policies in the individual health care market to retain their policies even if the policies don’t meet the minimum standards of the ACA.  Politicians, pronouncements and podiums – stir them together and voila!  The President’s pronouncement was little more than political cover at this late stage in the transition to Obamacare.  Only if the states allow it and companies decide to offer the plans will an individual policy holder be able to “keep their plan,”  as the President promised on numerous occasions in the past few years.

On Friday, the Energy and Commerce Committee released emails subpoenaed from CMS, the agency that administers Medicare and the ACA.   The emails contradict previous testimony by both CMS head administrator Marilyn Tavenner and HHS Secretary Kathleen Sibelius that only routine problems with the healthcare.gov web site were anticipated before the launch of the web site.  Ms. Tavenner testified that there were enough problems that they decided to delay the implementation of the small business plans on the web site but it appears that the problems went much further and top officials were alerted.

Henry Chao, the deputy CIO at CMS, was made aware of many major security, transactional and design problems with the web site during the summer but decided – or was pressured to decide – that the site would go live on October 1st regardless.  President Obama’s repeated selling point has been what he calls “smart” government. The rollout of the federal health care website has  revealed – once again – that the government in Washington has become too big and too top down to be smart, or effective.  To keep their campaign coffers filled, too many in Washington must placate those companies which fund those coffers, including special favors and bailouts for the elite on Wall Street.  To get the votes, they must placate the poor with programs and promises.

A conflict of interests and a clash of incentives makes most of the Washington crowd ineffective.  Turn on C-Span and watch the faces of the House and Senate Budget Conference (House and Senate).  These are intelligent, committed people who feel the pull of these different puppet masters, those political interests that keep them in their respective seats.   Each one of them earnestly wants to fix the problem – and that is the problem.  Much of the time, they are fixing the previous fixes they implemented.  This approach makes Congress feel important. I would suggest that they do little more than enact incentives and let their constituents craft the solutions.  Sure, the solutions will not be crafted with the superior technical expertise that Washington promises. Instead, they will emerge in a stumbling, hodge-podge way that will disenchant those who believe in the romantic notion of omniscient experts who engineer elegant solutions to social and economic problems.  I hope that one day the Washington elite will let Main St. try to figure out the solutions to some of these problems. We can do better.

Up, Down, Round and Round

November 10th, 2013

Friday’s release of the monthly employment situation showed strong net job gains of 204,000 jobs and big upward revisions to the previously reported gains in August and September. The market should have reacted negatively to these positive numbers (yeh, go figure) in anticipation of the Fed tapering their stimulus program of monthly bond purchases.

But first we must go back to Thursday. The first estimate of real GDP growth in the third quarter came in above even the most optimistic forecasts at 2.8%, about a full percentage point above second quarter growth.  The primary reason for the gains though was the continuing build in inventories.  Inventory building is good in anticipation of robust sales but, as I’ll cover later, consumer spending has not been so robust.  The market reacted to the report with it’s largest daily loss in a few months.

On Friday, the employment report was released an hour before the market opened.  Trading began at the same level as Thursday’s close with little response to the strong job gains.  We can imagine that traders were twittering furiously to each other in the opening hour, trying to gauge the sentiment.  Buy in on strength in the employment numbers or sell on the strength in the employment numbers?  After the initial hesitation, the main index gained continuing momemtum throughout the day, with a final spike at the closing bell.

After digesting some of the numbers in the report, I think that traders realized how weak some of its components were, dimming the probability that the Fed will ease up on the gas pedal.  The Consumer Sentiment Survey, released a half hour after the opening bell, showed a continuing decline.  Within minutes, the market started trading higher.

The first number popping in the employment report is the 702,000 people who dropped out of the labor force.  To put that number in perspective, take a look at the chart below which shows the monthly changes in the labor force for the past ten years.  This is the second worst decline after the decline in December 2009, shortly after the official end of the recession.

This month’s .4% steep drop in the Civilian Force Participation Rate ties the record set in December 2009 when the economy was still on its knees.  The rate has now fallen below the 63% mark, far below the 66% rate of several years ago.

Employment in the core work force aged 25 – 54 actually dropped this past month.  Classifications of employment by age, sex, and education come from the survey of households, not employers, and may have been affected somewhat by the goverment shutdown. But the numbers of the past years show that there has been no recovery for this segment of the population.  In each lifetime, there are stages that last approximately twenty years.  This time of life should be  about building careers, building families, building assets and growing income.  I fear that for too many people in this age group, the slowly growing economy has not been kind.  This affects both a person’s current circumstances and dampens prospects for the future.

The headline job gains and classification of the types of jobs come from a separate survey of employers called the Establishment Survey.  Employers report their payroll count as of the 12th of each month.  Because they received paychecks, federal employees furloughed during the government shutdown in the first two weeks of October were still counted as employed in October.

There were some strong positives as well in this report.  Retailers added 44,000 jobs, above the average gains of 31,000.  This year’s gains have been the strongest in fifteen years.

The gains are about half of the eye-popping gains of the past fifty years, but they indicate a confidence among retailers.  Retail jobs are often the first job of many younger workers, who have endured persistently high unemployment during this recession. Here’s a glance at yearly job gains in the retail sector for the past fifty years.

As the holiday shopping season gets underway, all eyes will turn to the retail sector as an indicator of the consumer’s mood.  The U. of Michigan Consumer Sentiment Survey, released Friday, showed a continuation of an erosion in consumer confidence.  After peaking during the early summer at 85, this index has declined to 72, about the same levels as late 2009 when the economy was particularly weak.  The Expectations component of this survey, which reflects confidence in employment and income, has declined to about 63.  Gas prices have been declining, inflation has been near zero, and stock and home prices have been rising but this survey shows a steady decline in confidence.  The government shutdown probably had some effect on the consumer mood but the budget battles are not over.  This is the 7th inning stretch and few are standing up to sing “America The Beautiful.”

Professional Services and Health Care have been consistent leaders in job growth for the past few years but gains in these sectors have declined.  The unemployment rate notched up to 7.3% from 7.2%.

In a catch up effort after the recent government shutdown, the Dept of Commerce released data on factory orders for both August and September.  While the manufacturing sector as a whole has been strong, the weakness in new orders in these two months indicates a tempering of industrial production in the near future.

When adjusted for inflation, the level of new orders is still below the levels of mid-2008.

If we zoom out ten years, we can see that we at about the same levels as late 2005.

ISM released their monthly non-manufacturing survey, showing sustained and rising strong growth at just over 55, up a point for the previous month.  I’ve updated the CWI that I’ve been tracking  since June of this year.  A three year chart shows that even the troughs are part of a sustained growth pattern.  Furthermore, the span of the troughs keeps getting shorter, indicating a structural growth in the economy.

Let’s look back six years and compare this composite index of economic activity with the market.

The monthly report of personal income and spending released Friday showed less than 1% inflation on a year over year basis.  For the second month, incomes increased at an annualized rate of 6%, yet consumer spending remains sluggish.  The chart below shows the year over year growth in spending for the past twenty years.

A longer term graph shows the current fragility in an economy whose primary component is consumer spending.

Both the manufacturing and non-manufacturing portions of the economy continue to expand.  Employment has risen consistently at a level just above population growth.  Inflation is tame but so is consumer spending.  Income is rising.  Budget battles loom.  Expectations for holiday retails sales increases are modest.  Will the Fed ease or not ease?  The medium to long term outlook is positive, but with a watchful eye on any further declines in the momentum of consumer spending growth. The short term outlook is a bit more chaotic.  We can expect further wiggles in the stock market as traders rend their garments, struggling  with Hamlet’s dilemma: To buy or not buy?  To sell or not sell?

HealthCare.gum

November 3rd, 2013

In this week’s title is the new government top level domain name: gum for gummint or gummed up.  But before I get into that, a few side notes on the economy.

On Friday, the Institute for Supply Mgmt released October’s ISM manufacturing report, which again showed that the manufacturing sector of the economy is humming along.  The monthly report on Factory Orders will be released this coming Monday, followed by the non-manufacturing ISM report on Tuesday.  The non-manufacturing sector has slowed from robust growth readings during the summer but are expected to still be a strong 54 to 56.  I’ll update the CWI that I have been charting since the spring.

On Wednesday, the payroll firm ADP released their estimate of job growth in the private sector during October.  The 130,000 net job gains came in under expectations and ADP noted a downward revision of about 12% for the previous months employment gains.  Normally, the BLS releases their monthly employment report on the first Friday of each month but because of the government shutdown that report will not be released till this coming Friday. The disappointing growth in the private sector shown in ADP’s report and fallout from the government shutdown in October has diminished expectations of job growth in the coming BLS report.  Previous estimates of 160-180,000 job gains have shrunk to 120-140,000.  The economy has been expanding yet employment gains have been moderate, a puzzlement to a lot of economic models.  The stagflation of the 1970s contradicted several prominent economic models at that time and the current persistent weakness in employment growth has got to be causing some head scratching by labor economists.

The continuing computer dysfunctions at healthcare.gov have commanded the spotlight these past two weeks.  There are about 15 million people, or 5% of the population, who purchase individual health insurance plans. About 50% of individual plans are not renewed each year, either by choice of the insurance company or the insured.  In the industry, this is referred to as the “churn rate.”

The Affordable Health Care Act, a/k/a Obamacare, enacted minimum standards for health insurance plans.  Existing plans were grandfathered in with a few caveats, one of them being that there was no change in rates since the act was signed into law in 2010.  Of course, most plans have annual rate revisions, voiding any grandfathering provisions.  Some estimate that as many as half of all individual policy holders have received cancellation notices from their insurance carriers.

Only 18 states have set up their own health care exchanges and these have functioned fairly well over the past month.  The “hub” portion of healthcare.gov acts in the background to connect these state exchanges to data from various government agencies.  A majority of states, including all states dominated by Republican legislatures, opted not to set up their own exchanges but to use the federal health care exchange at healthcare.gov.  This much more visible portion of the health care IT infrastructure has been a disaster since it opened on October 1st. Many individual plan policy holders in states without an exchange must access this web site to shop for insurance policies and apply for federal insurance subsidies.  For many the web site has been inaccessible or there were long delays in creating accounts on the site or they were constantly dropped off the site.

There was little to no support for Obamacare among Republicans and this dysfunctional web marketplace underscores a lack of faith in the big government that Democrats extol.  Note to Democrats:  a crippled web site is not the way to win friends and influence people.

In control of the House, Republicans control the agendas of the various committees and subcommittees.  Note to Democrats:  don’t screw up when the other party has control.  In congressional hearings, Republican reps presented numerous examples of constituents angry over the largely non-functioning federal health care site.  Democrats were angry as well – less so at agency officials appointed by a Democratic President and more so at Republicans, arguing for everyone to come together to solve these problems.

After failing to make their point by shutting down the government for a few weeks, House Republicans have taken a more moderate stance of letting the Democratic health care insurance apparatus implode.  Had the Republicans – and Democrats – not been posturing at their podiums during the shutdown, Republicans might have paid more attention to the healthcare.gov site problems during the first week of the government shutdown and adopted this more moderate stance sooner.   Note to Republicans: get out of the way when your opponent is falling on his sword.

In the political wrangling over the passage of the Affordable Care Act, President Obama famously repeated, “If you like your insurance, you can keep it.”  What he should have said was “Nothing in the new health care act will force you to change plans,” but that indicates some nuance.  Nuance is the first soldier to fall in political campaigns.  Words are daggers; as kids we learn that lesson well.  To pass the Politician Exam, candidates learn three things about the use of words:  how to conceal, cajole and cut with them.  In Politician School they learn “Keep It Simple, Stupid” and think that the Stupid are the voters.  In sales, the quip is aimed at the salesperson, a “memo to self” reminder that the more one becomes practiced in the art of selling a particular good or service, the more complicated and less effective one’s presentation can become.

Politicians tend to talk to voters at the level of the least intelligent among them, so it comes as no surprise that President Obama kept it beguilingly simple, to the point of an almost falsehood.  Yes, if an insurance company kept a policy exactly as it was three years ago, then it was grandfathered in.  An insurance carrier has little incentive to keep a person or family in the same risk pool when the carrier can cancel the policy, issue them a new policy at higher rates justified by the fact that the person or family is now in an unrated risk pool.  President Obama might have thought that the subject of risk pools was just too complicated for simple minded voters.  Several years ago, politicians in Colorado found that voters were very interested in and could comprehend risk pools when it involved changes to auto insurance.  In response to legislative changes, I have had at least two policy cancellations and reissues by my auto insurance carrier.  Because the market for auto insurance is very competitive, rate changes were small.  Not so in the market for individual health insurance.

My state, Colorado, has set up its own exchange.  In Estes Park, a husband and wife with a family of four kids will save almost $600 a month with a health insurance plan they purchased on the exchange.  Their deductible will drop from $12,500 a year to zero.

For each anecdote illustrating the benefits of Obamacare, there will be at least one example of financial hurt.  For 14 years as a self-employed person I carried an individual health policy, so I am well aware of the benefits and problems of these policies.  To get an initial policy, I answered a lot of questions about myself, my habits, my family’s medical history, and my family’s parent’s medical history.  I peed in a cup and had blood taken to get a policy renewal.  Applications are an average of 23 pages according to testimony in recent hearings.  Contrast that length with the typical two page application for an employer-sponsored health care plan. In short, there were and are a lot of very big and persistent problems in the individual health insurance market.

Many individual plans are sold to small business owners or self-employed professionals, an independent lot who do like being able to pick and choose an affordable plan that meets their needs. Despite the negatives, individual plans did not suffer the onerous burden of government regulation.  Media attention to the problems in individual plans has been scant because almost 90% of people with health insurance get their insurance through an employer or through Medicare or Medicaid.

A week ago, a Congressional oversight committee questioned CGI, the general contractor for the healthcare.gov web site, and OSSI, a contractor for the backbone of the system.  This past week, another Congressional committee questioned Marilyn Tavenner, the head administrator for CMS, the government agency that administers Medicare and Medicaid, and Katherine Sebelius, the Secretary of HHS.  Both have apologized for the fiasco and have promised a tireless effort to get it right, bringing in teams of experts from private industry, including Google and Facebook, to work on the problems.

Ms. Tavenner worked for 25 years in the big hospital chain HCA, then a four year stint in Virginia’s HHS, before becoming a Deputy Administrator, then the head Administrator at CMS.  Congresspeople on both sides of the aisle gave her a lot of respect.  During the hearing with Ms. Tavenner, there were several points raised.  While I took notes, I did not fact  check the claims.

CMS projects an enrollment of 7 million by March 2014.  Of these 7 million, approximately 2.3 million need to be younger to make the policies actuarially sound.
Before the web site launch on October 1st, the CMS conducted small scale tests of the site for two weeks in September that showed no major problems.  In testimony the week before, both CGI and OSSI said that a project this size requires several months of testing before launch.
CMS made the decision not to release initial application or enrollment numbers on healthcare.gov till mid-November, claiming that the numbers were unreliable.  Republican members of the committee claimed that this was a delaying tactic to hide the fact that the numbers of enrollees so far is very low.
Ms. Tavenner insisted that their goal was to have the site running smoothly by the end of November, giving those who have had policies cancelled effective on Jan. 1st ample time to sign up for new plans.
If a person is not concerned about the availability of subsidies, they do not have to sign up, i.e. create an account on the web site, simply to find out what plans are available and at what rates.
Health care costs and coverage over the next twenty-five years are the primary concerns of small businesses.  (Side note: for most of the 2000s, premiums in the Colorado small business market were increasing by 9 – 15% each year.)
In August, CMS decided to delay the “Shop and Browse” rollout of insurance plans for small businesses on healhcare.gov till later in the year.  They also decided to delay the Spanish version of the web site as well as the capability of Medicare and Medicaid transfers.  Even with the delayed implementation of some of these components of the web site, the site has been dysfunctional.
On October 24th, Mother Jones reported that it was possible that social security numbers could be hacked on the healthcare.gov web site.
Charley Rangel, a Democratic Congressman from New York, stressed the need for health care access for children, reminding Republicans that they need a stock of healthy children to fight their wars.  An example of the verbal tennis match that ensues at some Congressional hearings.
Under the medical loss ratio clause of Obamacare, $3.4 billion has been returned to policyholders by insurance carriers.
17 million children with pre-existing conditions can no longer be denied coverage.
Medicare patients have saved $8.3 billion by the closing of the “donut hole” in Part D prescription drug coverage.
Lloyd Doggett, a Democratic rep from Texas (Texas has everything, including Democrats), continues to ask for Navigator progress reports.  Navigators are licensed by CMS to help people sign up for Obamacare and it was not clear how much supervision CMS has over these Navigators.
Ms. Tavenner denied reports that Navigators are not required to undergo criminal background checks.
Current Medicare claims are 18% below CBO projections from a few years ago.  There has been a slowing of medical costs for the past few years.  If someone leans to the left, they attribute that to the enactment of the ACA.  If someone leans to the right, they attribute the reduction to the recession.

I noticed a pattern during the hearings and the distinction has been confirmed in some polling.  Democratic voters and their representatives focus on health care access, while Republicans focus on health care costs.  This difference in focus helps explain why each side often talked past the other during the hearings.

The longer that the web site is not functioning properly, the more that voters will punish Democratic reps in the 2014 elections.  Many districts are rigged – er, engineered – to be no contest for one party or the other.  Democratic reps in contested districts are hoping that the current problems are fixed asap and praying that no more problems emerge before the election.

And finally, a side note on food stamps.  The House reduced food stamp benefits by 5% this week.  Lest you think that Republicans are all about smaller government, think again.  Yahoo reported  that Republicans want to impose restrictions on what foods and drinks a person can buy with food stamps.  Whatever became of the Party of Personal Responsibility?  Although President Obama has said he would veto the plan, it indicates that Republicans as well as Democrats are parties of Big Gummint.  Put your money in the gumball machine and hope your flavor comes out.

Jobs, Spending and Income

October 27th, 2013

Before I take a short look at the delayed release of the employment report this week, let’s look at the growth in personal income and spending, which move in tandem.  This is the y-o-y percent change in nominal after tax income and spending.

Income growth can be a bit more erratic than spending, bouncing around the more stable trend of spending.

The anemic growth in both income and spending has dampened hopes of a strong rebound of consumer spending.  The ratio of an ETF composite of retail stocks versus the overall SP500 market index shows the recent doubt.  Retail stocks have not participated in the larger market rebound.

A wholesale clothing sales rep I spoke with a week ago has noticed the caution in her buyers since mid-August.  In September, some in the industry laid the blame at the prospect of a government showdown.  For those of us in private business, the political shenanigans only muddy the water and make it difficult to read the consumer mood.  Reports of sales at major retail centers – about 10% of retail sales – showed strength this week after a month of lackluster growth.  Maybe it was the government shutdown.

However, the U. of Michigan Consumer Sentiment Index released this past Friday showed a sizeable drop in sentiment.

Was this decline in confidence due primarily to the shutdown or is this a forewarning of less than cheery holiday shopping season?  The knuckleheads in Washington are like people who stand up at a concert, blocking the view of those seated behind them.  The business community in general must plan around the politicians on both sides of the aisle in Washington who relentlessly pursue an anti-job agenda.  Politicians can puff and posture on their principles – like so many in government service, they are not subject to the constraints and discipline of profit and loss.  Sure, there are some whose intentions are good, who give their best effort but, unlike private business, their efforts and intentions are voluntary – a sense of personal virtue.  Most will not lose their jobs because of a lack of performance.  There are few incentives to improve efficiency.  In fact, it is the reverse.  The incentives are to promote more regulations, more layers of bureaucracy, as a program of job security and job growth in Washington at the expense of the rest of the country. Many of us in the private sector have the same sense of personal virtue but we also have that profit and loss whip.

Since the temporary resolution of the government shutdown and the raising of the debt ceiling, the market has shot up over 6% in twelve trading days.  The late release of September’s labor report showed less than expected net job gains of 148,000, which dashed any further fears that the Fed might ease their bond buying program this year.  The trends of employment growth have been fairly stable, with a few exceptions – health care, for one.

After six months of little growth, employment in construction rose by 20,000 this past month.

The rise in construction jobs helped the labor force participation rate for men, reversing a decline.

But the participation rate for the core labor force, those aged 25 – 54, shows no signs of reversing the decline of the past four years.

Demographic changes, combined with persistent job weakness among younger workers, is silently eroding the foundations of the Social Security system.  The older half of the population, particularly the Woodstock generation, are growing faster than the younger population, as this table from the Census Bureau shows.

From the Census Bureau report: “the population aged 65 and over also grew at a faster rate (15.1 percent) than the population under age 45.”  At the end of 2012, the Federal Government owed the Social Security trust fund $2.7 trillion (SSA Source)

The number of workers in the core labor force has declined by 5 – 6 million.

Let’s do some math.  [5 million fewer workers paying into Social Security each year] x [$8000 guesstimated combined annual contribution] = $45 billion per year not  collected.  This is just the Social Security taxes, not including the income taxes, on a portion of the population that represents two thirds of the work force.  That $45 billion represents the benefits paid to over 3 million people in 2012. (SSA Source) To put that figure in perspective, Congress is arguing over the medical device tax clause of Obamacare which is projected to raise just $29 billion over the next ten years.

It will take five to ten years for the crisis of funding to develop.  In the meantime, the budget debates will grow more contentious, politicians will pontificate at their podiums with more frequency and the clouds of these dusty debates will make it more difficult for business people to plan ahead.