March 31st, 2013
From its catatonic state the housing market continues to make headlines. On Tuesday came a somewhat disappointing report on new home sales for February; at 411,000 it was a bit below expectations of 425,000. A real estate saleswoman told me this week that it’s now a seller’s market in Denver. I presume that means that buyers are now having to offer the asking price or above when submitting a sales contract to a seller.
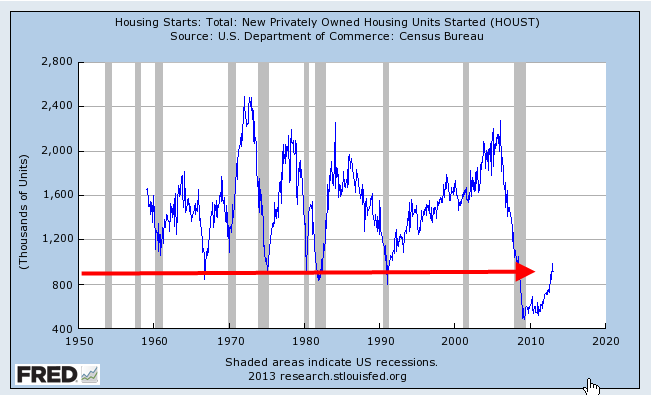
For a long term perspective, let’s zoom out fifty years. Home sales are at past recession bottoms BUT they are better than last year and the year before and the housing and labor markets are hoping.

Will the patient stir, starting to rise, only to fall back on the bed? PUH-LEEZ DON’T!

Housing Starts, which include multi-family dwellings, are on an upswing but are also coming from a deep trough.
What is more telling for the labor market is the ratio of home sales to housing starts, which continues to decline as more and more multi-unit apartment buildings and condos are being built.

Construction of multi-unit dwellings takes less labor per family unit and the type of construction is often skewed to a different kind of labor force than the construction of single family homes. There is more steel, concrete and masonry work in multi-unit construction, employing trade skills unfamiliar to some in single family residential construction. This shifting emphasis of skills in the work force may damper growth in the construction labor market.
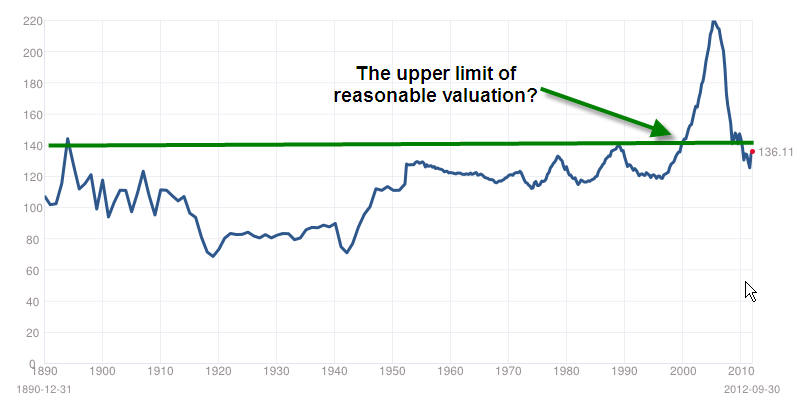
Let’s go up in our hot air balloons and take a gander at home valuation for the past 130 years. The Case-Shiller Home Price index surveys home prices throughout the nation and adjusts for inflation. The homes of today offer more than the homes of 100 years ago, both in convenience, comfort and safety. However, the index is approaching an upper range that may be less attractive to potential buyers.
Let’s look at housing evaluations from an affordability perspective. The National Association of Realtors offers an affordability index based on a composite of mortgages. I prefer a different measure, one that is based on disposable income – income after taxes. For many of us, buying a house is the biggest purchase of our lives. Before we make such a big commitment, we need to have some savings (except during the housing boom) to make a down payment, and we need to feel some certainty about our future income. Mortgage payments will probably take the largest bite out of our income.
When we look at a long term history of the growth of the home price index (purchases only) and the growth of inflation adjusted disposable income, they track each other closely – until the housing boom really took off in 2000. Below is a graph of the past 20+ years, showing the relationship between the two.

The upturn in home prices is still above the trend line growth of disposable income and until personal income can resume or surpass a 3% growth rate, any rise in home prices will be constrained.
