February 9th, 2014
The ISM manufacturing report for January reported a severe decline from the robust readings of past months. New orders suffered the most, dropping from a strong reading of almost 65 in December to just a bit above the neutral reading of 50. Prices jumped significantly. Manufacturing’s drop off in new orders comes on the heels of a similar decline in the service sector in December. This is the third report in the past thirty days that came in below even low estimates, the other two being pending home sales and December’s employment gains. At mid week, ISM released their January estimate of the health of the service sector which is the bulk of the economy. Happily, this showed continued growth, helping to offset concerns about a broad slowdown in the economy.
The CWI that I have been tracking continues to show an overall strength, declining slightly to 58 from the rather vigorous reading of 60 last month. As I noted a few weeks, this index anticipated a winter lull before picking up energy again in early spring.
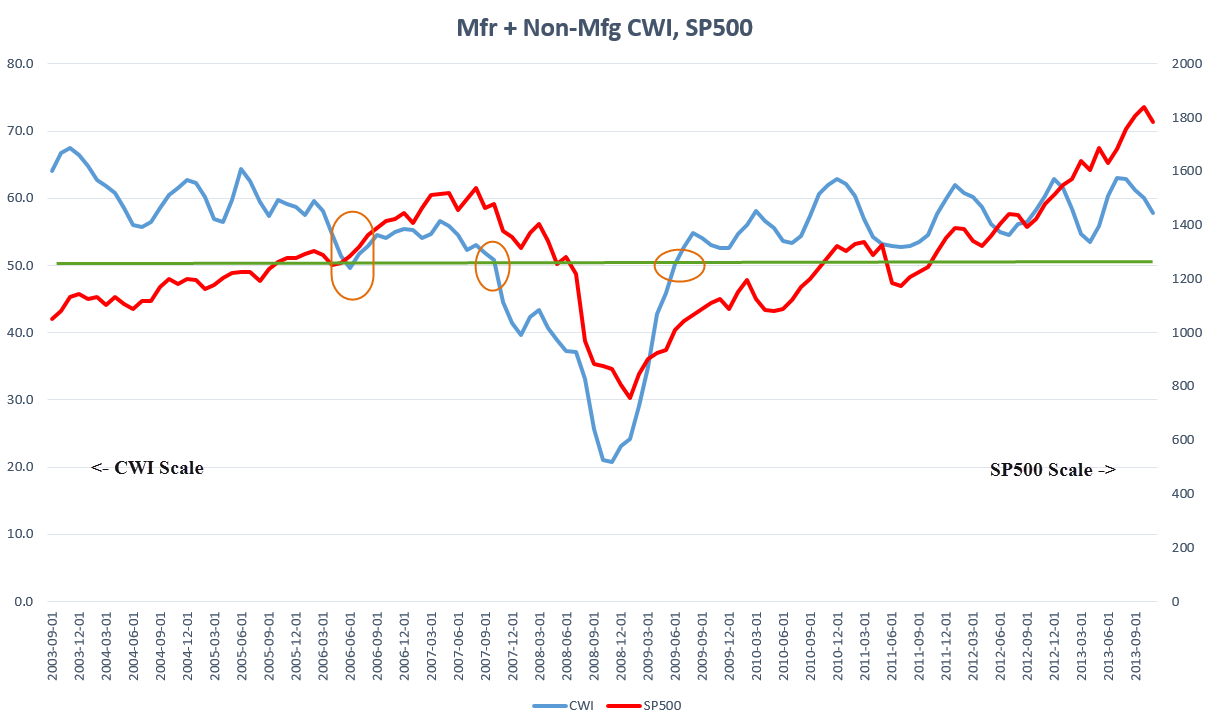
A reader had difficulty understanding the wave like graph of the CWI. I indexed it to a starting base then indexed that to the SP500 average in 1997. Perhaps this will help visualizing the long term response of the SP500 to underlying economic activity.

*******************************
ADP reported a gain of 175,000 private jobs in January, below the strong 227,000 job gains of December. There was only a slight revision to ADP’s previous report, confirming the suspicion of some that the greater flaw lies in the BLS figures for December.
On Friday, the Bureau of Labor Statistics (BLS) released their estimate of 113,000 job gains in January, far below the consensus of about 180,000. Here’s a story from the Atlantic that captures some of the highlights. Forgive some of the misspellings, if they are still there by the time you read it.
As I did last month, I’ll show the average of monthly job gains estimated by the BLS and ADP. ADP does not report government jobs so I’ve just added those in from the BLS report.
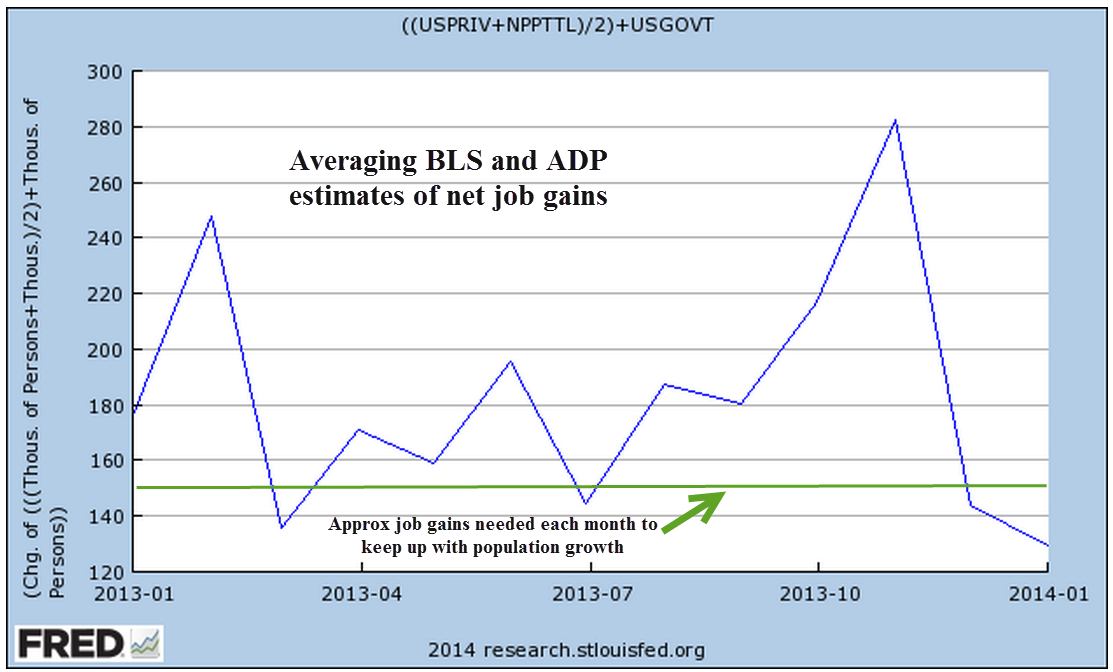
The decline below the replacement level of 150,000 may be a temporary response to severe weather conditions in the populous east coast and Chicago region.
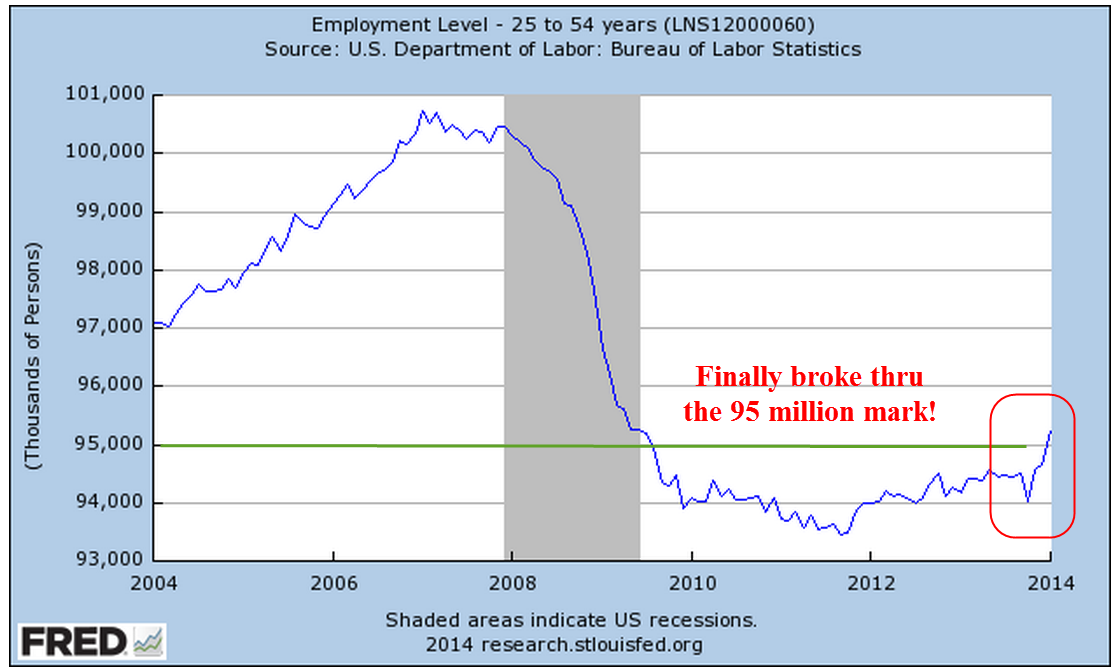
The market responded quite favorably to this labor report. A slackening labor market prompted hopes that the Federal Reserve will not accelerate their easing of bond buying. A large revision of job gains in November was a big positive in the report. Another positive was the half a million increase in the core work force, those aged 25 – 54. Men accounted for most of this increase.
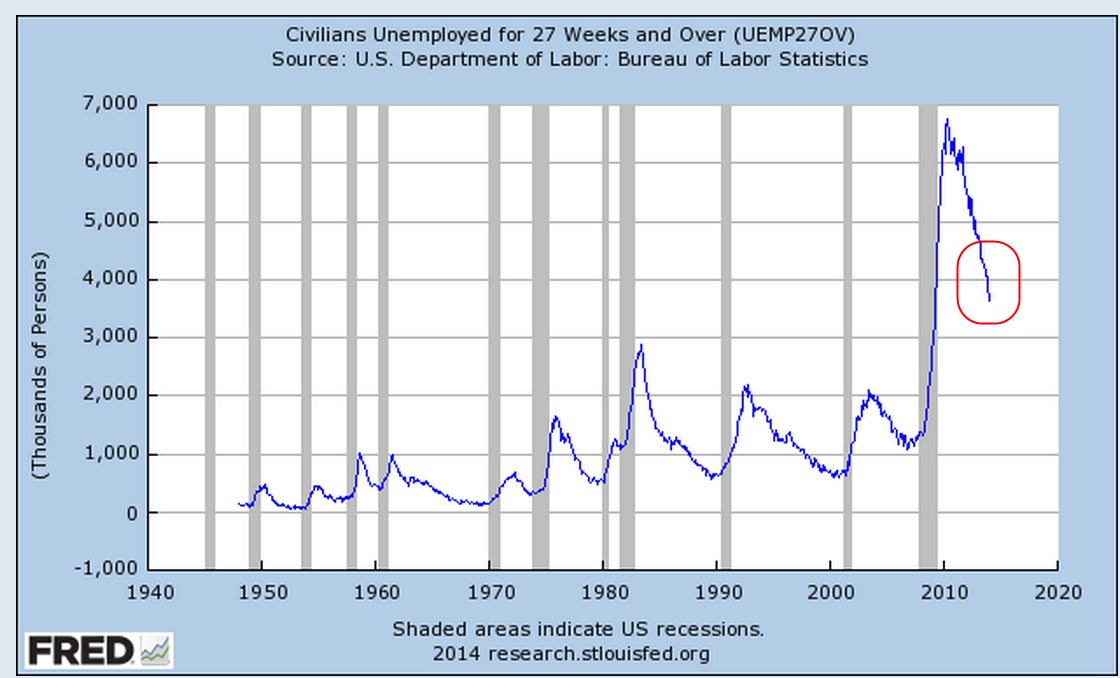
The number of people working part time because they can’t find a full time job dropped by a half million but there are still more than 7 million people in this situation. A 232,000 decrease in the number of long term unemployed was heartening although many lost their unemployment benefits at the end of the year and may have had little choice but to take whatever job they could find.
*****************************
Doug Elmendorf is the head of the Congressional Budget Office (CBO) that advises the Congress in constructing the budget, making appropriations, and the anticipated or actual economic effects of policy. In advance of his testimony before the House Budget Committee this past week, the CBO released the highlights of their report. Some talk show hosts and conservative media were trumpeting a loss of 2.3 million jobs due to Obamacare. In his testimony, Mr. Elmendorf explained that the 2.3 million jobs mentioned in the CBO report are not lost jobs because the CBO does not estimate any reduction in the demand for employees because of Obamacare. The CBO estimated the number of hours that employees would voluntarily reduce their hours in order to meet qualifications for subsidies under Obamacare and divided those total hours by what a full time employee would work in a year. Since there is a surplus of labor in this country, this voluntary reduction would help those who are either looking for a job or want to work more hours. The CBO sees no impact on part time jobs that can be attributed to Obamacare.
*******************************
Republicans and some Independents have repeated the claim that the rich are paying most of the personal income taxes in this country. IRS 2010 data (Table 2 ) doesn’t seem to support that contention. The top 5% of taxable returns with taxable incomes greater than $200K had taxable income of $1.9 trillion, or 36% of the total $5.3 trillion in taxable income. On that income, the top 5% paid $513 billion in Federal income tax, 49% of the total. In a flat tax system, the top 5% would have paid a bit more than $360 billion.
When Republicans use the code words “broaden the tax base” what they mean is that they want a flat tax so that rich people pay the same percentage of tax as poor people. Several states have such a flat tax system. To Democrats, a broadening of the tax base means making more of the income of rich taxpayers subject to progressive tax rates.
When Democrats use the code words “paying their fair share” they mean that the rich should pay proportionately more than the additional load of about 32% that they are currently paying. To Republicans “fair share” means a flat tax.
What the IRS data shows is that the rich are not paying most of the income taxes in this country. Often tax policy and social benefit programs are lumped together, confusing the issue in the minds of many. The Tax Foundation did an analysis of the net benefit and expense of taxation and benefit programs. They report that:
As a group, the bottom 60 percent of American families receive more back in total government spending than they pay in total taxes.
Government tax and spending policies combine to redistribute more than $2 trillion from the top 40 percent of families to the bottom 60 percent.
The methodology that the Tax Foundation uses presumes that everyone benefits equally from public spending like defense, police and the courts. An alternative assumption that people benefit according to their income results in a $1.2 trillion redistribution, about 40% lower, according to the Tax Foundation. (Kudos to the Tax Foundation for making both computations.)
What the report does not do – because it is just so hard to do – is calculate age and circumstance related movements of taxpayers from the top 40% to the bottom 60%. Consider a taxpayer – I’ll call her Linda – making $100,000 who is in the top 40%. She loses her job and starts collecting unemployment for several months. Her income now puts her in the bottom 60%. “Past Linda” was supporting the bottom 60% but “present Linda” is now part of the bottom 60%, according to the methodology used by the Tax Foundation. Yet if we isolate this one taxpayer, we can say that “past Linda” was actually supporting “present Linda.” When Linda was making $100K, she presumably paid a lot in income and other taxes, including unemployment taxes paid by her employer. The Federal Government does not keep records that would allow this kind of inter-temporal analysis. As a result, we get a distorted view of what is actually happening.
Let’s look at an older taxpayer – I’ll call him Sam – who retires. Sam was making $80K before he retired and was in the top 40%. With social Security income and income from savings, Sam now makes $36K in retirement, which puts him in the bottom 60%. Is Sam being supported by the top 40%? Statistically he is. However, most of us would say that Sam is simply living off the benefits that he paid into during his working life.
I appreciate the exhaustive work that the Tax Foundation does but the problem is more complex than they present. Furthermore, many people are not aware of the difficulties and complications of calculating who supports whom. Some use this analysis to present the case that the majority of Americans are sucking on the teats of the few well off. Presidential contender Mitt Romney’s unguarded comment about “the 47%” who are living off the efforts of others did not serve him well in the past election yet a sizeable percentage of voters believe this.
The 16th Amendment passed a century ago allowed the Federal government to tax the income of individuals directly and it was intended to be progressive. Relatively few paid any income taxes in the first decades after the enactment of the income tax. Whether one likes the progressivity of the tax code, one has to recognize that the law was intended to be that way when it was passed.
I would like to see the repeal of the 16th Amendment for two reasons: 1) protect individuals from the power of the Federal government; 2) slow the consolidation of money in Washington. Money brings power and power begets patronage, if not downright graft. We can never get rid of patronage, only retard the concentration of patronage. Studying 5000 years of history, we have learned that the concentration of power in any political institution ultimately leads to the downfall of that institution. Only corporations can exist with such a concentration of power and even they sometimes fall when top leadership in a company becomes resistant to change.
Perhaps we could adopt a taxing system where the Federal government taxes the states based on the population in each state. If a state has 10% of the country’s population, then they would owe 10% of any tax used to replace the current income tax. Let the states determine how they will collect the money. Racism has been a constant nemesis of this country and legal protections could be enacted which would prevent states from taxing citizens based on race or sex. Head taxes have a tawdry reputation because they were often used to disenfranchise poorer voters. If the population count of a state was simply used as an allotment mechanism and not applied directly to each citizen, I think that this could be a fairer and safer system of taxation. Certainly, legislation could be passed preventing the denial of rights to a citizen based on a tax.
Could Doug Elmendorf and his cohorts at the CBO build a model based on such a system?
*******************************
Tidbit:
And we’re talking about nine million individuals who are eligible for both Medicare and Medicaid. They are responsible for a significant amount of spending in both programs — approximately 46% of Medicaid and close to a quarter of Medicare spending annually. Estimates range that that is anywhere from 300 to $350 billion a year total that we’re [CMS] spending.
Melanie Bella, Director of the Federal Healthcare Office at the Centers for Medicare and Medicaid Services, Federal Coordinated Healthcare Office Conference 11/1/2010
