March 1, 2015
There are several popular methods to evaluate stocks. The P/E ratio is probably the most quoted metric. This is a stock price divided by its current earnings. A conservative variation of this popular methodology is Professor Shiller’s Cyclically Adjusted Price Earnings (CAPE) ratio. The basis for this metric is the observation that all data reverts to its mean. Professor Shiller’s method adjusts the past ten years of reported earnings for inflation, then averages those earnings and divides the current price by that average to get a CAPE ratio.
Any well-regarded valuation method has its detractors. This Economist blog points out objections to the Shiller CAPE ratio. In a 2014 blog I tackled an objection to Shiller’s methodology: a ten year average can include a severe downturn in earnings that does not reflect current conditions. I massaged away the 2008 to 2010 downturn to show that Shiller’s CAPE ratio was little changed by the downturn.
Some object that the CAPE ratio uses reported earnings, which includes depreciation (lowers earnings) and interest (increases or decreases earnings). Operating earnings exclude these items and more accurately reflect the profits generated by ongoing operations. Operating earnings may be a valid basis for evaluating a single company and Warren Buffet uses this method, among others, to get a sense of sustainable earnings.
Some prefer to use forward operating earnings, which are estimates of profits for the next twelve months. These estimates come in two varieties: top down and bottom up. Top down estimates are calculated by estimating a growth percentage of profits for the coming year and applying that percentage to the sum of current profits. Bottom up estimates are painstakenly compiled by taking the forward earnings guidance given by each company. Top down estimates tend to be optimistic and are usually revised downward with the passage of time.
I prefer Shiller’s method as a more realistic approach for a long term investment in a stock index like the SP500. Successful businesses should be able to generate enough profit in their operating margins to account for depreciation, which is included in reported earnings.
Another valuation method is the flip side of the Price Earnings or P/E ratio – an E/P ratio, or earnings yield. As of a week ago, the current earnings yield was 5.02%. This is then compared to the 10 year Treasury rate, 2.13%, as of Feb. 20, 2015. The difference between the earnings yield of stocks and a risk-free investment like U.S. Treasuries – currently about 3% – is called the risk premium for owning stocks. Often, this risk premium is quoted in basis points, which are 100ths of a percent. So 3% = 300 basis points. In 2007, the risk premium was over 4%. The average from 2002 – 2006 was about 2% as stocks climbed out of a prolonged slump following the dot com bust and 9-11. So, using this method, we could say that stock valuations are somewhere in the middle, neither frothy or pessimistic.
************************
Housing
Sales of New Homes remained brisk at just under 1/2 million. The supply of new homes on the market indicates historically strong demand.

The latest Case-Shiller home price index increased 4.3% year-over-year, below the 4.7% growth curve of the past forty years. From 1975-2000, home prices increased 5.5% annually. During the boom years of the 2000s housing prices surged above that growth curve only to fall swiftly in the crash of 2008. The bust in the housing market has more than taken out the excess, bringing the forty year growth curve to 4.7%.
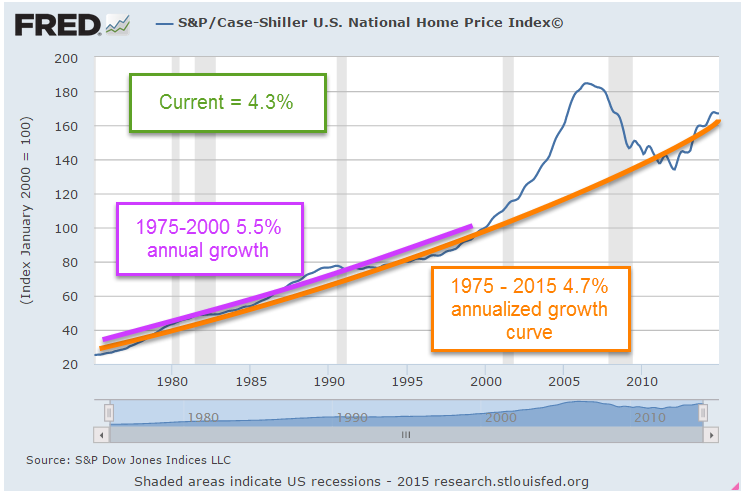
The home price index does not take into account the larger homes being built over the past two decades. The median square footage of new homes has grown from 1555 SF in 1975 to 2457 SF in 2013. (Census Bureau data)
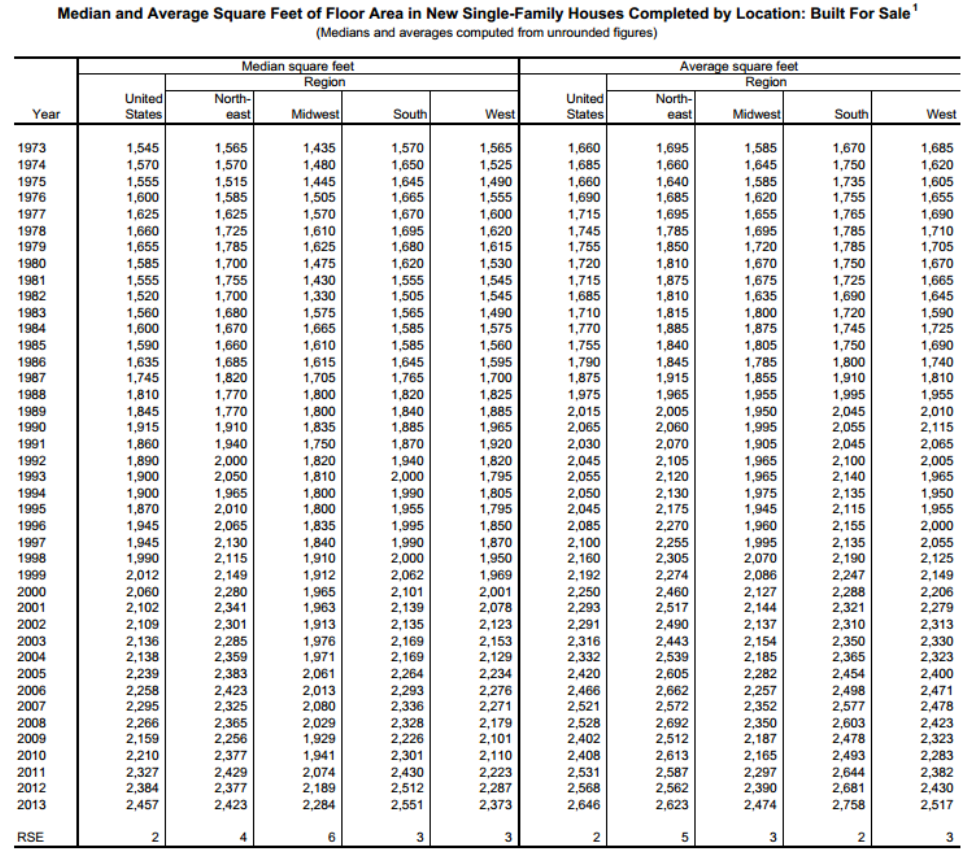
A greater percentage of today’s homes include air conditioning, extra bathrooms and other amenities that the homes of forty years ago did not have, skewing the long term effective growth curve even lower. While some metropolitan areas on both coasts may be overvalued, national averages suggest that housing prices are fairly valued.
***********************
Economic Summary
Twice a year the chair of the Federal Reserve testifies before the Senate Banking Committee. Chair Janet Yellen’s testimony this past week was a concise distillation of economic trends. Investors bombarded with an avalanche of articles and blogs may sometimes find it difficult to synthesize all the information they absorb. Ms. Yellen’s initial summary cuts through the clutter:
The unemployment rate now stands at 5.7 percent, down from just over 6 percent last summer and from 10 percent at its peak in late 2009. The average pace of monthly job gains picked up from about 240,000 per month during the first half of last year to 280,000 per month during the second half, and employment rose 260,000 in January. In addition, long-term unemployment has declined substantially, fewer workers are reporting that they can find only part-time work when they would prefer full-time employment, and the pace of quits–often regarded as a barometer of worker confidence in labor market opportunities–has recovered nearly to its pre-recession level. However, the labor force participation rate is lower than most estimates of its trend, and wage growth remains sluggish, suggesting that some cyclical weakness persists. In short, considerable progress has been achieved in the recovery of the labor market, though room for further improvement remains.
At the same time that the labor market situation has improved, domestic spending and production have been increasing at a solid rate. Real gross domestic product (GDP) is now estimated to have increased at a 3-3/4 percent annual rate during the second half of last year. While GDP growth is not anticipated to be sustained at that pace, it is expected to be strong enough to result in a further gradual decline in the unemployment rate. Consumer spending has been lifted by the improvement in the labor market as well as by the increase in household purchasing power resulting from the sharp drop in oil prices. However, housing construction continues to lag; activity remains well below levels we judge could be supported in the longer run by population growth and the likely rate of household formation.
