January 10, 2016
Happy New Year!
Wait, get rid of the exclamation point.
Happy New Year.
After this week! What are you kidding me?! Get rid of the Happy.
New Year.
Ok, that’s better. The New Year was not so happy when the market started its first day of trading last Monday. For the tenth consecutive month, manufacturing activity in China contracted, which weighed down commodities (DBC down over 4%), energy stocks (XLE down 7%), emerging markets (EEM down more than 8%) and the broader market, which was down 6%. Even stocks (Johnson and Johnson, Coca-Cola) regarded as relatively safe dividend paying equities suffered losses of more than 3 or 4%. Investors and traders were re-pricing future profits and dividends.
December’s powerful employment report buoyed the mood for a short time on Friday morning but traders soon turned their attention again to China and the broader market fell about 1% by day’s end.
Given the decline in stocks, one would guess that the price of bonds, hard hit during the past few weeks, had showed some strong gains. TLT, a popular ETF for long term Treasuries, gained more than 2% during the week but remains range bound since last August. Treasuries are a safe haven for risk averse money, but the prospect of rising interest rates mutes the attractiveness of long term bonds.
Growth in the core work force aged 25 – 54 remains strong, up over 1% from last year. The number of people not in the labor force dropped by 277,000 from last month, a welcome sign. However, we need to put aside the politics and look at this in a long term perspective. For the past twenty years, through good times and bad, the number of people dropping out of the workforce each year has grown.

This demographic trend is more powerful than who is President, or which party runs the Congress. Depending on our political preferences, we can attribute this 20 year trend to Clinton, Bush, Obama, Democrats or Republicans. The job of the good folks running for President this year will be to convince voters that their policies and prescriptions can overcome this trend. Our job, as voters, is to believe them.
The Bureau of Labor Statistics recently released a report of a ten year comparison of the reasons why people have left the work force. Based on this BLS analysis, a Bloomberg writer who had not done their homework mistakenly reported that there has been a dramatic increase in the number of 20-24 year olds who had retired.
This “statistic” points out a flaw in BLS and Census Bureau data. BLS data is partially based on the Current Population Survey, or CPS. Interviewers are not allowed to follow up and challenge the responder. Both the BLS and the Census Bureau have been aware of the problem for at least a decade but I don’t think anyone has proposed a solution that doesn’t present its own challenges.
Looking at Chart 3 of the BLS report, the percentage of retired 20-24 year olds was .2% in 2004, .6% in 2014. The number of retired 16-19 year olds was .2% in 2004 and .2% in 2014. Do we really believe that there are almost 200,000 retired 16-19 year olds in this country? See page 16 for the BLS discussion of this problem.
Now, let’s put ourselves in a similar situation. We are 22 and have recently graduated from college and are having trouble finding a job that actually uses our education. Because of this, we are staying at our parent’s home. We answer our parent’s landline phone (Census Bureau is not allowed to call cell phones). Somebody from the Census Bureau starts asking us questions. In response to the question why we are not working, we are presented with several choices, one of which is that we are retired (see pages 16 and 17) Sarcastically we answer that yeh, we are retired. The questioner can probably tell by our tone of voice that we are being sarcastic but is required to simply record our response. How valid is that response?
Understand that problems of self-reporting and questionnaire design underlie all of the data from the monthly Household Survey, including the unemployment rate. This gives those with strong political views an opportunity to claim that government statistics are part of a conspiracy. Claims of conspiracies can not be disproved, which is why they are so persistent throughout human history.
Each year some research firms predict a global recession. Ominosity is the state of sounding ominous and this year is no different. Adam Hayes, a CFA writing at Investopedia, gives some good reasons that he believes such a widespread recession is possible. All of these risks are present to some degree.
What makes me less convinced of a global recession is the strength of the U.S. economy. Just as China “saved” the world during the financial crisis, the U.S. may play the role of the cavalry in this coming year. Let’s look at some key data from the recent ISM Purchasing Manager’s index. This is the new orders and employment components of the services sectors which comprise 85% of the U.S. economy. Growth remains strong.

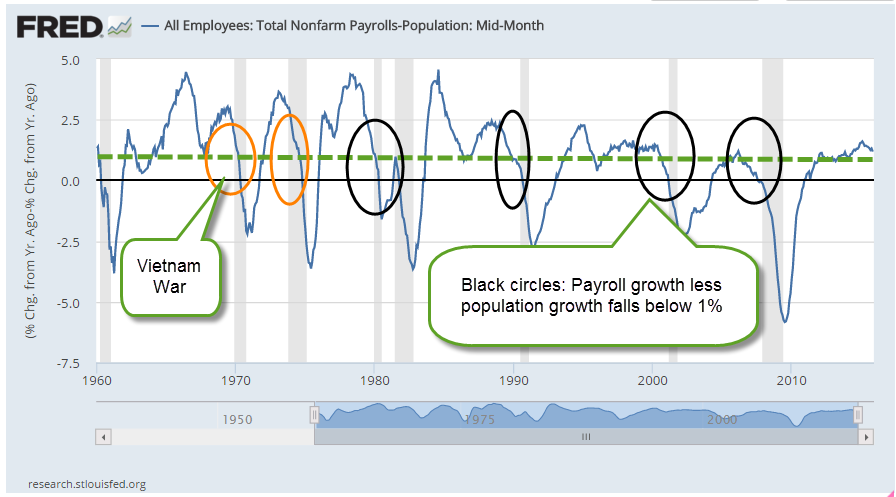
Recessions are preceded by a drop in new orders and by a decline in employment. When payroll growth less population growth is above 1%, as it is today, a recession is unlikely.
Let’s climb into our time machines and go forward just 11 months. It is now December 2016 and the IMF has enough data to make a post-facto determination that the entire world’s economy went into recession in March 2016. We look at the SP500 index. Holy shit! We climb into our time machines, go back to January 2016 and sell all of our stocks. Missed that cliff.
What about bonds? Should we sell all those? Darn it, we forgot to check interest rates and bond prices when we were ahead in the future. Back into the time machine. Go forward again. U.S. Fed halted rate increases in March 2016, then lowered them a 1/4 point. The ECB had kept interest rates negative in the Eurozone and bond prices have stayed relatively flat. OK, cool. We get back in our time machines and go back to January 2016 and decide to hold onto our bond index funds. The interest on those is better than what we would get on a savings account and we know that we won’t suffer any capital losses on our investment during the year.
We take all the cash we have from selling our stocks and put them entirely in bonds. Wait, could we make a better return in gold, or real estate? Back in the time machine and back to the future! But now we notice that the SP500 index in December 2016 is different. So is the intermediate bond index. What’s going on? The future has changed. Could it be the Higgs boson causing an abnormality in space-time? Maybe there’s something wrong with our time machine. But where can we find a mechanic who can diagnose and repair a time machine? Suddenly the thought occurs to us that a lot of other investors have gone into the future in their time machines, then have returned to the present and bought and sold. That, in turn, has changed the future.
The time machine is called the human brain. Each day traders around the world make decisions based on their analytical and imaginative journeys into the future. The Efficient Markets Hypothesis (EMH) formulated by Eugene Fama and others postulates that all those journeys and decisions essentially distill all the information available on any particular day. Therefore, it is impossible to beat a broader market index of those decisions.
Behavioral Finance rests on the judgment that human beings are driven by fear and greed which causes investors to make mistakes in their appraisals of the future. An understanding of the patterns of these inclinations can help someone take advantage of opportunities when there is a higher likelihood of asset mispricing.
Each year we read of those prognosticators who got it right. Their time machine is working, we think, and we go with their predictions for the coming year. Sometimes they get it right a second year. Sometimes they don’t. Abby Cohen is a famous example but there are many whose time machines work well for a while. If I could figure a way to fix time machines, I could make a fortune.
