January 17, 2016
The ever-strengthening dollar and growing inventories of crude led to a plunge in the price of a barrel of West Texas Intermediate (WTI) which fell below $30. I remember hearing some analyst on Bloomberg about a year ago saying that oil prices could go as low as the $20 range. HaHaHaHa! A popular basket of oil stocks, XLE, is about half of it’s July 2014 price, falling 25% in the past two months and almost 10% in the two weeks. Here’s a tidbit from the latest Fact Set earnings brief: “On September 30, the estimated earnings decline for the Energy sector for Q1 2016 was -17.7%. Today, it stands at -56.1%.” Ouch!
Volume in energy stocks this week was more than double the three month average. It smells like capitulation, that point when a lot of investors have left the theater. Investors who do believe that the theater is on fire, as it was in 2008, should probably stay away.
What the heck is going on? This Business Insider article from June 2015 (yes, six months ago) explains and forecasts the money outflows from China and emerging markets. Pay particular attention to #4. This Bloomberg article from this week confirms the capital flight from China as investors anticipate a further devaluing of the yuan.
4th quarter earnings reports will begin in earnest in the following week. If there are disappointments, that will magnify the already negative sentiment.
**********************
Death Cross
No, it’s not the title of a Fellini movie. The merits of technical analysis can be more controversial than a Republican Presidential debate, but here goes. The 50 day average of the SP500 crossed above the 200 day average, a Golden Cross, at Christmas, then crossed back below the longer average this week, a Death Cross. A Golden Cross is a positive sign of investor sentiment. The Death Cross is self-explanatory. A crossing above, then below, happens infrequently – very infrequently. The last two times were in 1960 and 1969 and the following months were negative. After January 1960, the market stayed relatively flat for a year. In June 1969, it marked the beginning of an 18 month downturn. There was an almost Golden Cross followed by a Death Cross in May 2002. A similar 18 month downturn followed.
Longer term investors might use a 6 month short term average and an 18 month longer average, selling when the 6 month crosses below the 18 month, buying back in when the one month (or 6 month average in the case of more volatile sector ETFs) crosses back above the longer average. Like any trading system, one takes the risk of losing a small amount sometimes but avoids losing big.
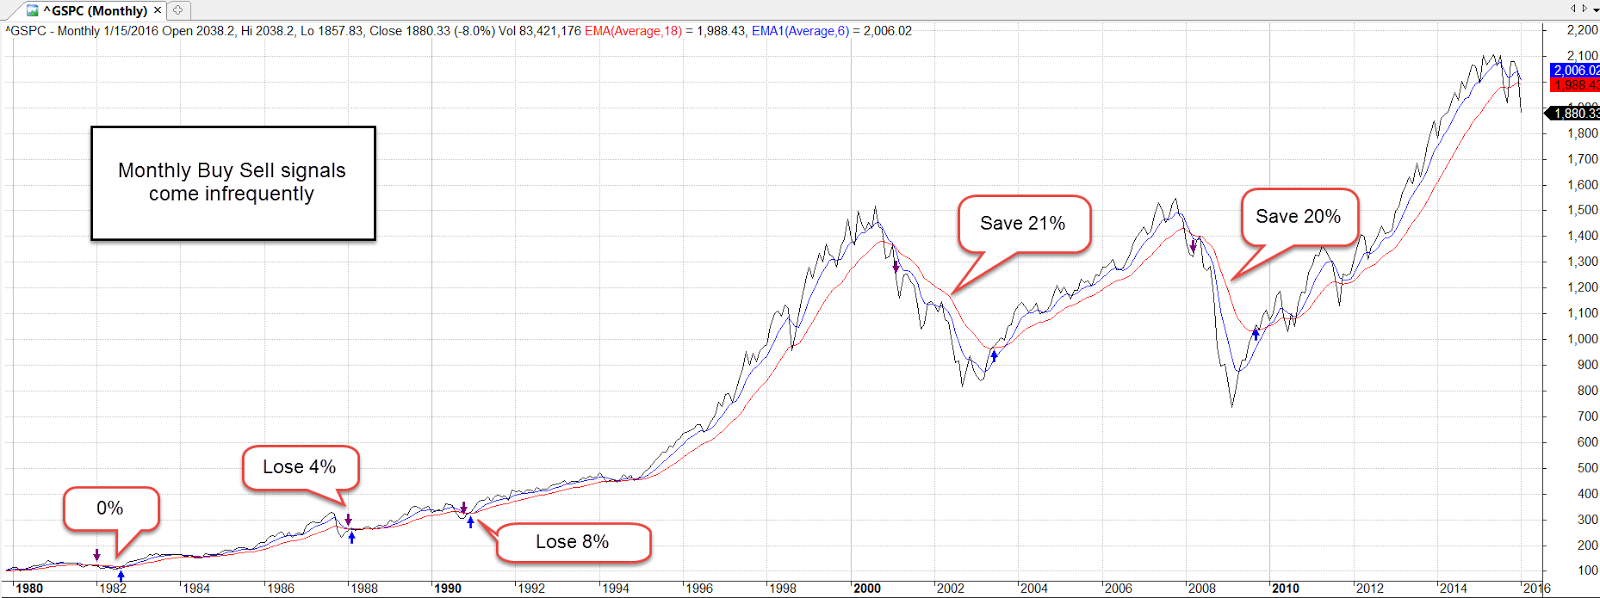
Trading signals are infrequent using monthly average prices. Note that the sharp downturn of the 1998 Asian financial crisis did not trigger a sell signal. The six month average of the SP500 as a broad composite of investor sentiment is above the 18 month average but several sectors have been sells for several months: Emerging markets (June and July 2015), Energy stocks (January 2015), and European stocks (August 2015). Industrials (XLI) have taken a beating this month and will probably give a sell signal at the end of the month.
John Bogle, founder of Vanguard, recommends that long term investors look at their statement once a year and rebalance to meet their target allocation, one that is suitable for their age, needs and tolerance for risk. In that case, don’t look at your January statement. As I wrote a few weeks ago, it could look ugly.
********************
CPI
In 1998, the Boskin Commission estimated that the Consumer Price Index (CPI) over-estimates the rate of inflation by an average of 1.1%. In 2000, the NBER (the agency that determines recessions) revised their methodology and their estimate of the over-statement to .65%. In 2006, Robert Gordon, a member of the original committee, re-examined subsequent CPI data and the methods used by the committee. His analysis re-asserted that the over-statement was at least 1%.
Although this academic debate might seem arcane, the implications are enormous, particularly in an election year. Presidential contender Bernie Sanders is gaining momentum on Hillary Clinton (HRC) by repeatedly asserting that the inflation-adjusted incomes of working families have declined since 1973. Although Mr. Sanders makes no proposals to stimulate economic growth, he has many redistribution plans to achieve economic justice. If inflation has been overstated for the past few decades, then Mr. Sanders’ argument is logically weak but emotionally strong. More importantly, neither side of the political aisle can even agree on a common set of facts. The other side is not evil, or stupid, or disingenuous. The disagreement over methodology is legitimate and ongoing.
