July 10, 2016
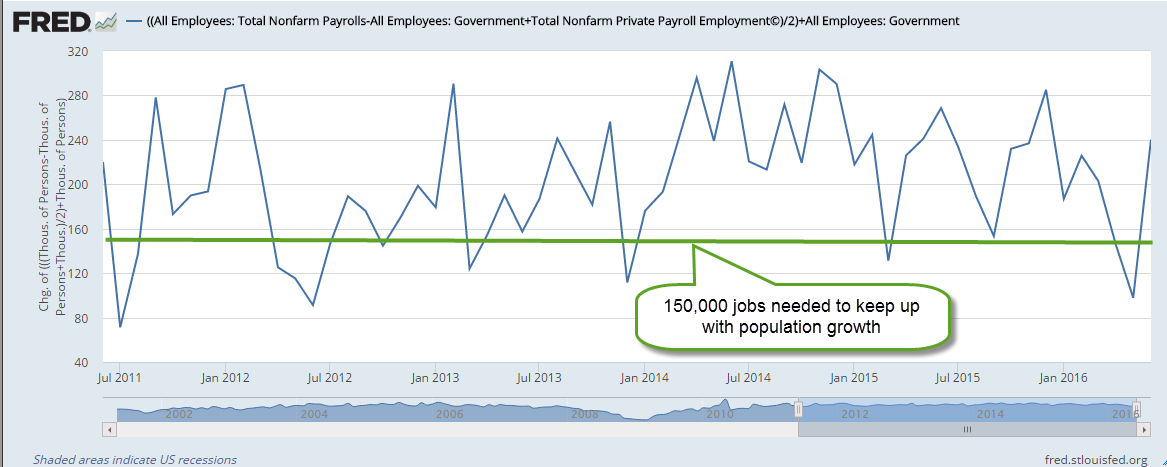
The horrific news from Dallas on Thursday night and Friday morning understandably drowned out this month’s extraordinary employment report. No one anticipated job gains of 287,000 that were far above the consensus average estimate of 170,000. Like last month, the BLS numbers are way off from those from the private payroll processor ADP, which reported gains of 172,000.
The strike at Verizon that started in May and ended in June involved 38,000 workers and skewed the BLS numbers down in May, then reversed back up again in June. BLS methodology does not adjust for a strike involving so many workers, leading some to criticize such a widely followed methodology. Because these estimates are prone to error, I think we get a more reliable picture by averaging the two estimates from the BLS and ADP. As we can see in the graph below, economic growth during the past five years has been strong enough to stay ahead of the 150,000 monthly gains needed to keep up with population growth.
Those working part time because they couldn’t find full time work have dropped by 1.4 million in the past year – a positive sign. Although the supposed recovery is seven years old, it is only since the spring of 2014 that the ranks of involuntary part timers have consistently decreased. Today’s level is almost 7 million less than it was two years ago but is still 2/3rds more than pre-Crisis levels.
This month’s 1/10th uptick in the participation rate was a welcome sign that more people are coming back into the workforce. Although the unemployment rate ticked up two notches to 4.9% this was probably due to more people actively looking for work. An important component of the economy is the core work force aged 25 – 54, which continued to show annual growth in excess of 1%, a healthy sign.
////////////////////////////
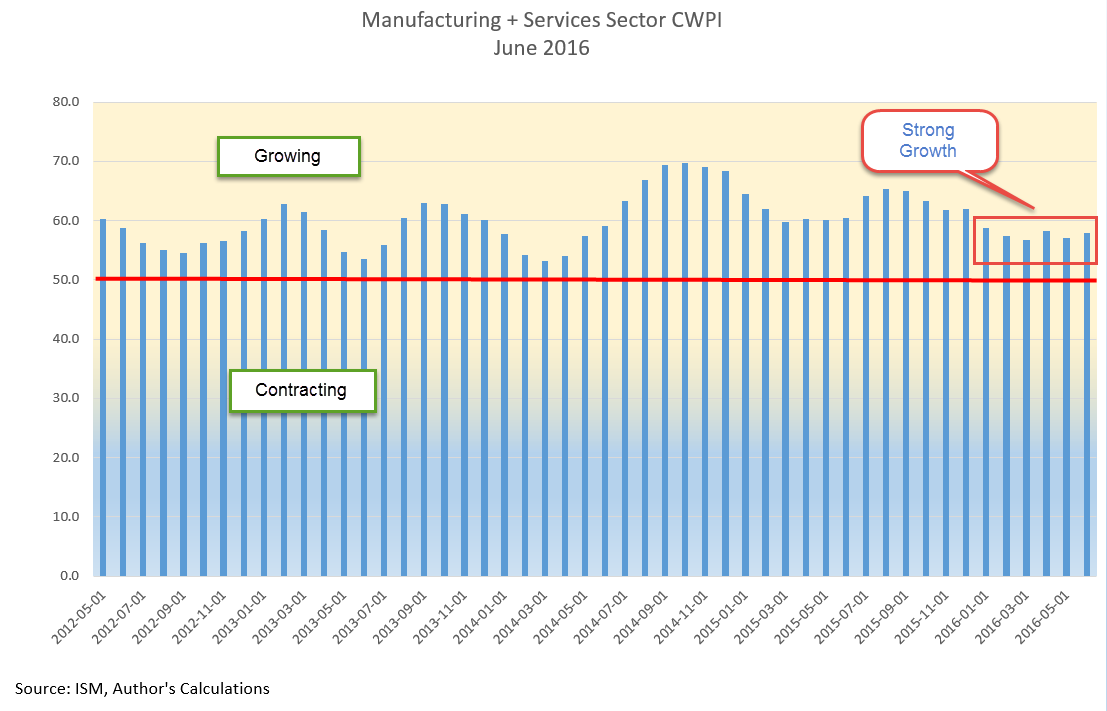
CWPI (Constant Weighted Purchasing Index)
Earlier in the week, the monthly survey of Purchasing Managers (PMI) foreshadowed a positive employment report. A surge in new orders in the services sector and some healthy growth in employment helped lift up the non-manufacturing PMI to strong growth. The Manufacturing index grew as well. The CWPI composite of both surveys has a reading of almost 58, indicating strong growth. The familiar peak and trough pattern that has continued during the recovery has changed to a steadier level. New Export Orders in both manufacturing and services reversed direction this month. The strong dollar makes American made products more expensive to buyers in other countries and presents a significant obstacle to companies who rely on exports.
Last month’s survey of purchasing managers in the services sector indicated some worrying weakness in employment. This month’s reading suggests that a surge in new orders has reversed the decline in employment, a trend confirmed by the BLS report later released at the end of the week.
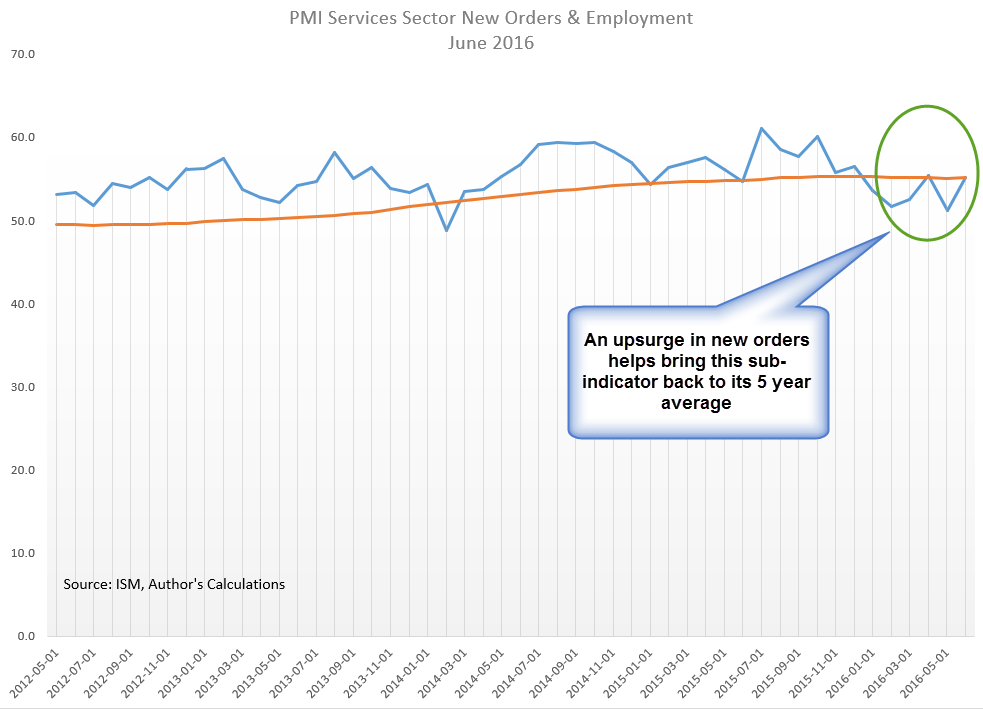
A few months ago I was concerned that the familiar trough that had developed in the spring might continue to weaken. This month’s survey put those fears to rest.
//////////////////////////
Housing Bubble?
Soaring home prices in some cities has led to speculation that, ten years after the last peak in the housing market, we are again approaching unaffordable price levels. Heavy migration into the Denver metro area has made it the third hottest housing market in the U.S., just behind San Francisco and Vallejo (northeast of SF) in California (Source). Despite bubble indications in these hot markets, the Case Shiller composite of the twenty largest metropolitan areas does not indicate that we are at excessive levels.

In the period 2000 through mid-2006 when housing prices peaked, annual growth was more than 10%. Ten years have passed since then. In the 16.5 years since the start of 2000, annual growth has averaged 4%. While this is almost twice the 2% rate of inflation, it is approximately the same as the rate of growth during the past century.
//////////////////////////////
In the past two weeks following the Brexit vote in the U.K. the S&P500 has rebounded 6%, recovering all the ground lost and then some. It is near all time highs BUT so are Treasuries. When both “risk on” (stocks) and “risk off” (Treasuries) both rise to new highs, it creates a tension that usually resolves in a rather ugly fashion as the market chooses one or the other.
