June 4, 2017
I’m scratching my head. No, it’s not dandruff. The BLS released their estimate of job gains in May and it was 100,000 less than the ADP estimate of private payroll growth. We’d all like to see these two monthly estimates track each other closely, which they tend to do. In an economy with 146 million workers, a 100,000 jobs is only 7/100ths of a percent, but this discrepancy comes just two months after a HYUUUGE spread of 200,000 job gains in the March estimates.
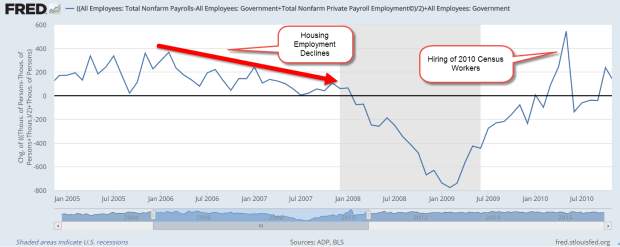
A simple solution to multiple surveys? I average them. The result is 191,000 job gains in May, close to that healthy growth threshold of 200,000. In the chart below I’ve shown the average of the two estimates for the past five years and highlighted the downward trend of the peaks. Reasons include a decline in oil and gas industry jobs, and a natural feature of a mature recovery.

We saw the same pattern of declining job gains from the early part of 2006 through late 2007 before the average dipped below zero. Boosted by a hot housing market in the early part of the decade, construction employment began to cool in 2006.
Some areas of the country are particularly hot. Denver’s 2.1% unemployment rate is absurdly low as is the state’s rate of 2.3%. Both are at historic lows, less than the go-go years of the dot-com boom. Colorado’s rate is the lowest among the 50 states (BLS). While income inequality has been rising in other hot metro areas like San Francisco, it has fallen in the Denver metro area.
There is a downside to strong growth. Back in “ye olden days,” like the 1970s and 1980s, I was introduced to a rule of thumb. It stuck with me because it seemed too simple. Here’s the rule: whenever the unemployment rate gets below 5% in an area, the price of some key component of the economy is rising much faster than its long term average. Lower unemployment leads to a mispricing of some asset.
Let’s turn to the other component of this credit cycle: loan delinquency. The institutions who loan money expect that a certain percentage of borrowers will default. Lenders include the cost of those defaults when they calculate interest rates and loan service fees. The non-defaulting borrowers pay for the defaulters. During recessions, the delinquency rate on consumer loans usually rises above 4%. When unemployment is low and growth is strong, the delinquency rate goes below 3%. Lower delinquency leads to a mispricing of credit risk.
Let’s review these two mispricings. The price of an asset is a price on some future flow of use or income that will come from the asset. The interest rate on a loan is the price of money and the price of risk. Let’s put these two mispricing together and we have another rule of thumb: as the difference, or spread, between the unemployment rate and the delinquency rate on consumer loans gets closer to zero, the more likely that the economy is overheating. A rising spread indicates a coming recession because unemployment responds faster than the delinquency rate to economic decline and increases at a faster rate. The spread changes direction and grows.

Here’s the process. As the unemployment rate decreases, lending terms and loan criteria become more favorable. When we buy stuff on credit, we commit a portion of our future income stream to a creditor. When an economy begins to decline and unemployment increases, some income streams become a trickle or stop altogether. A loan payment is missed, then another, and those in more fragile economic circumstances default on their loans.
As the delinquency rate rises, lending policies begin to tighten again, making it more difficult to qualify for loans. Many businesses depend on the flow of credit, so this tightening causes a decline in sales, which causes businesses to lay off a few more people, which further increases both the unemployment rate and the delinquency rate. This reinforces the downward trend.
The NBER is the official arbiter of the beginning and end of recessions but often doesn’t set these dates until several years later. This change in the direction of the spread is a timely indicator of trouble ahead. An understanding of the credit cycle is crucial to an understanding of the business cycle, which influences the prices of our non-cash assets.
Next week I’ll take a look at the cycle of asset pricing.
