September 17, 2017
Lloyd Blankfein, the CEO of Goldman Sachs, commented recently (CNBC) that the length of this bull market has worried the traders at Goldman. Being a curious sort, I wondered how this bull market compared to previous ones. Wanting a big picture, I looked at the quarterly data for the SP500 index for the past sixty years. A lengthening sequence of quarterly closes above the three-year average is a reliable indicator of a bull market.
In the 1980s, the SP500 had a run of 19 consecutive quarters above its three-year average. That streak ended in the 3rd quarter of 1990, at the start of a mild recession that lasted until March 1991. The animal spirits of the stock market could not be contained for that long. After one quarter down, the market began another streak in the 4th quarter of 1990, a monster bull run of 40 consecutive quarters above the average until the first quarter of 2001.

The end of the dot-com boom, the start of a mild recession, then 9-11, the Enron and accounting scandals – all of it led to a 50% drop in the index. Almost three years later, the market finally closed above its three-year average. That began a 17-quarter bull run that ended March 2008.
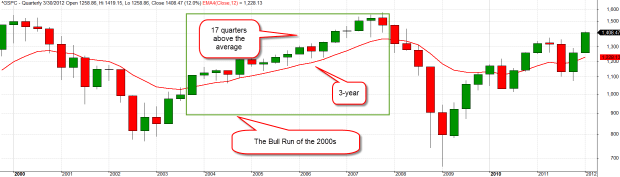
People were getting woke to the reality that housing prices can go down. The neighbor living in the house behind my folks in NYC said to me, “I don’t know what’s going on. Housing prices are not supposed to go down.” As though housing prices obeyed a fundamental physical law like gravity. The bailout of Bear Stearns that first quarter of 2008 was just the beginning of a developing financial crisis that would cripple the global economy. In 2010 and 2011, market prices clawed their way above the 3-year average only to fall back.
Finally, in the last quarter of 2011, after the fitful resolution of the budget crisis, the SP500 broke again above its 3-year average. Since then the market has notched 24 consecutive quarters above that average. This latest bull run has beat every previous SP500 streak except for the 1990s run up.
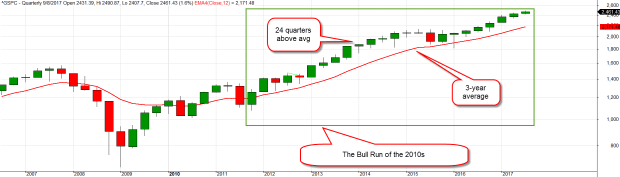
This is what is worrying Blankfein and the traders at Goldman. Long bull runs in the past have ended horribly. Like the bull run in the 1990s, there have been few negative, or corrective, quarters during this run. Those are the quarters in red in the chart above. Some negative sentiment acts as a constraint on ever climbing asset prices. For now, investors are convinced that inflation and interest rates will remain low, a prime environment for stocks.
