September 10, 2017
I’ll review a few notes from last week’s employment report and highlight some long-term trends. There’s good news and bad news. Figuring out the future is tough because it hasn’t happened yet. Heck, scholars still haven’t figured out what went on in the past.
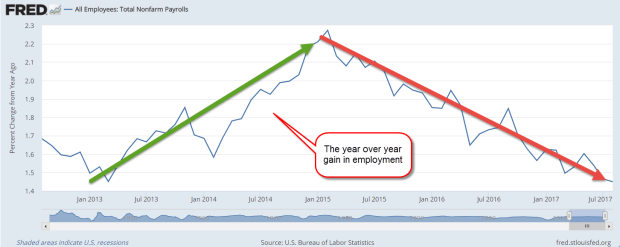
The unemployment rates are computed from a Household Survey and is a self-reporting statistic. The answers of survey respondents are not verified. The monthly job gains come from a separate survey of businesses and the data is more reliable. One of the recession indicators I use is the change in employment from the business survey. I regard a 1% year-over-year gain as a minimum threshold for a stable or growing economy. 1% is about the rate of population growth. If our economy cannot keep up with population growth, that is a pretty sure indicator of a coming recession. Here is a chart of the past five years. Growth is still above 1% but there is a definite downward trend.
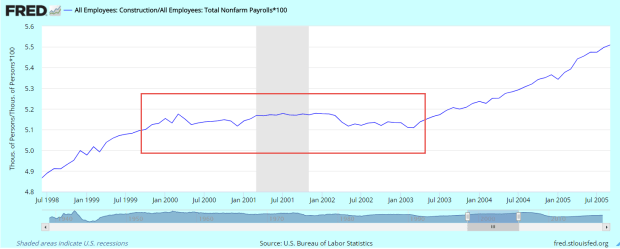
Here’s a graph of the past two recessions showing that crucial decline below the 1% threshold.

Due to higher manufacturing employment and higher population growth during the 1960s – 1980s, the recession threshold was closer to 2%. Here’s a graph of the 1970s to 1990s. The exception that broke the rule was the economic shock of the 1973 Arab-Israeli war. The oil embargo that followed straightjacketed the U.S. economy.

The NAFTA agreement signed in the early 1990s began an erosion of the manufacturing base and employment in this country. Still, the decline was rather mild until China was admitted into the WTO in 2001. The streamlining of ocean shipping and land transport of goods by cargo container reduced costs and catalyzed a mass migration of manufacturers and supply chains to China and southeast Asia.
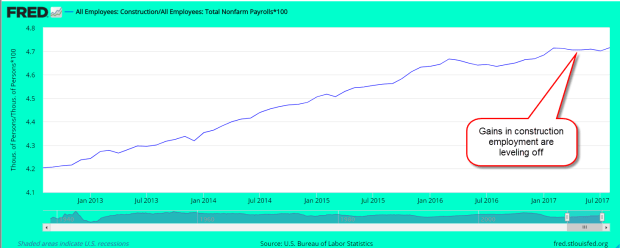
Gains in construction employment are waning. A sustained plateau followed by a decline precedes every recession. Notice that the growth is not in the actual number of construction employees but in the percentage of construction employment to total employment.
A plateau in construction employment began in April 2000 and persisted through one recession till the spring of 2003. In late 2002, there was talk of another recession. Fed chair Alan Greenspan continued to push rates down to 1% to ward off the boogie man of recession.
With unemployment as low as it is, wage growth should be stronger. In the latter part of 2016 and earlier this year the hourly earnings of private employees sometimes pushed toward 3% annual growth. Since April, growth has stayed rock steady at a mild 2.5%. It’s like some joker is laughing at the dominant economic models.
Speaking of predictive models, the Fed has discontinued the Labor Market Conditions Index (LMCI), a broad composite of 19 employment indicators. As a general picture of the employment market, it was satisfactory. As a predictive tool of developing trends, the Fed thought it was too sensitive. For those readers who would like a deeper dive, Doug Short of Advisor Perspectives examines the Feds remarks on this index.
/////////////////////
Lloyd Blankfein, the CEO of Goldman Sachs, commented recently (CNBC) that the length of this bull market has worried the traders at Goldman. Next week, I’ll compare this bull run with those of the past.
