February 18, 2018
by Steve Stofka
The stock market did not go down 4% this past Wednesday. It could have. The annual inflation reading for January was above expectations and confirmed fears that inflation forces are heating up. January’s retail sales report was also released Wednesday. It showed the second weakest annual increase in the past two years. If consumers are moderating their spending a bit, that would counteract inflation pressures. Instead of dropping 2 – 4% on Valentine’s day, the SP500 went up 2.7%.
The labor report and the retail sales report each month have a significant sway on the market’s mood because they measure how much people are working and getting paid, and how much they are spending.
On a long-term basis, I think (and hope) that consumers will remain relatively cautious in their use of credit. Families today carry a higher debt burden relative to their income. By 2004, household debt levels had surpassed their annual level of income. As housing prices continued to rise, many families overextended themselves further and paid a horrible price when jobs and housing prices declined during the recession.
Families during the 1960s and 1970s carried far less debt relative to their income. People saved their income and bought many items when they could afford it. High inflation in the late 1970s and more relaxed lending standards in the 1980s helped cause a shift in thinking. Why wait? Charge it. Businesses learned that consumers are more likely to spend plastic money than real money. Consumers were encouraged to take another credit card. Buy that new car. Your family deserves it. We have a good interest rate for you.
Following the recession, families have kept the ratio of debt to income at a steady level, so that their debt is slightly below the level of their annual income. Prudent consumers will help keep inflation in check. Here’s a chart of the debt to income ratio. See how low it was during the decades after World War 2.

/////////////////////
Housing
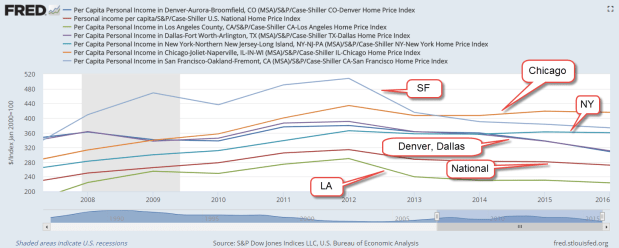
In the past year, tenant groups in California have been lobbying to loosen rent control laws in that state. You can read about it here (Sacramento Bee). To illustrate the economic pressures on many middle-class California residents, I’ll show you a few graphs. The first one is per capita income in six cities. All of them are above the national average. San Francisco and New York top the income list, followed by Denver, Chicago, Los Angeles and Dallas.

Now I’ll divide these income figures by an index of housing costs, the largest expense in most household budgets. In the past few years Chicago has edged into the top spot. San Francisco is still in the top 3, but has shifted downward as housing costs have climbed. The housing adjusted income of Los Angeles has dropped even further below the national average.
Feeling the fatigue of keeping up with escalating costs, some Angelenos are reaching out to their local politicians for help. Some have thrown up their hands and left the state.
