July 1, 2018
by Steve Stofka
There is a close correlation (see end) between the trend in equity prices and Federal tax receipts, as we can see in the chart below. Occasionally, the market gets too optimistic or pessimistic. When it does it inevitably corrects back to the trend in tax collections.
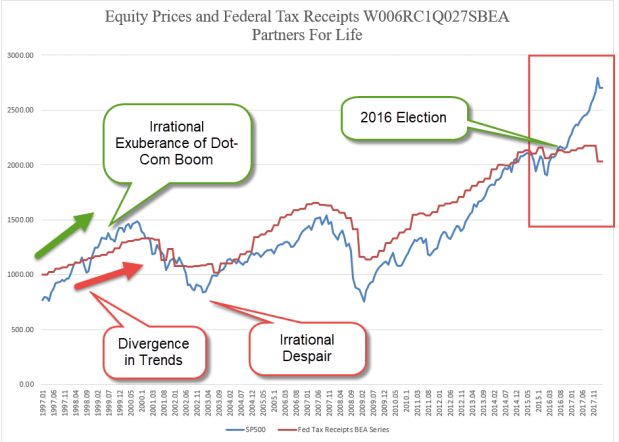
Note the strong divergence between stock prices (blue line) and tax collections (red line) since the 2016 election. Tax collections grew modestly in the first year of the Trump administration; from $2.133 trillion in the first quarter of 2017 to $2.178 trillion in the fourth quarter of last year. Following the tax cuts passed at the end of last year, tax revenues in the first quarter of 2018 fell $150 billion to $2.033 trillion. In fifteen months, the trend is negative for tax collections. In that same time frame, the SP500 rose 20% on the hope – or for some, the faith – that Trump policy will spur economic activity. That greater growth should lead to greater tax collections. It hasn’t.
Some say that the taxes during the previous administrations were too high. “Lowering the rates will raise the revenue,” is the prayer of supply-siders and tax cutters. “Just wait, revenues will rise as strong economic growth kicks in,” they promise. But this correlation of equity prices and tax revenues transcends administrations: the Obama years, and the Bush years and the Clinton years and into the H.W. Bush presidency. We could go even further back. When equity prices mis-estimate future growth, they correct back to the hard trend of tax revenues. It doesn’t happen overnight. The market had been correcting for more than a year before September ‘s implosion of Lehman Brothers in 2008.
George Soros became one of the most successful traders by constructing a story in advance of his trades. The story is a prediction of what he thinks will result if event A happens. When event A doesn’t happen within a set time, or when event A does not lead to B result, he gets out of the trade. He doesn’t fall in love with his story as so many of us do. Economists and politicians fall in love with their theories and stories the way fans do a baseball or football team. This year we’re going to go all the way!
For the long-term investor, the important thing is an allocation commensurate with one’s risk tolerance, time horizon and income needs. Secondly, have patience.
/////////////////////
Since 1990, the correlation is .96. Since 1997, it is .91. Since 2008, it is .94. Since the 2016 election, it is -.45.
