Smackdown

February 4, 2018

by Steve Stofka

We tell ourselves stories. Here’s one. The stock market fell over 2% on Friday so I sold everything. Here’s another story. After the stock market fell 2+% on Friday, the SP500 is up only 21% since 2/2/2017. Wait a second. 21%! What was the yearly gain just a few days earlier? 24%! Yikes! How did the market go up that much? Magic beans.

Here’s another story. Did you know that there has been a rout in the bond market? Yep, that’s how one pundit described it. A rout. Let’s look at a broad bond composite like the Vanguard ETF BND, which is down 4% since early September, five months ago.  The stock market can go down that much in a few days. Bonds stabilize a portfolio.

Two stories. Story #1. The Recession in 2008-2009 produced a gap between actual GDP and potential GDP that persists to this day. To try to close that gap, the Federal Reserve had to keep interest rates near zero for almost eight years and is only gradually raising interest rates in small increments.

Story #2. The Great Recession was an overcorrection in a return to normal. The GDP gap was closed by 2014. Here’s a chart to tell that story. It’s GDP since 1981. I have marked the linear trends. The first one is from 1981 through 1994. The second trend is an uptick in growth from 1995 to the present.

GDP1981-2018

What do these competing narratives mean? For two years the economy has been growing at trend. Should the Federal Reserve have started withdrawing stimulus sometime in 2015, instead of waiting till 2017? Perhaps chair Janet Yellen and other members were worried that the economy might not sustain the growth trend. A do-nothing incompetent Congress could not agree on fiscal policy to stimulate the economy.  The extraordinary monetary tools of the Federal Reserve were the only resort for a limping economy during the post-Recession period.

Ms. Yellen’s last day as Fed chair was Friday. She served four years as vice-Chair, then four years as chair. During her tenure, she was the most powerful woman in the history of this country. She was even-tempered in a politically contentious environment. She kept her cool when  testifying before the Senate Finance Committee.  A tip of the hat to Ms. Yellen.

////////////////

Performance

Vanguard recently released a comparison of their funds to the performance of all funds.

///////////////

Good Times

January 28, 2018

by Steve Stofka

Since the passage of the tax bill about a month ago, the stock market has risen 8%. Some people are convinced that only those at the top own stocks. Any market gains go only to the rich, they say. In the most recent of an annual Gallup survey, 54% of households reported that they directly owned stocks and stock mutual funds (Gallup).  Before the financial crisis, 65% reported direct ownership of stocks.

Private and public pension plans, as well as variable annuity life insurance plans, invest a great deal in stocks. When indirect ownership is added to the mix, a whopping 80% of the stock market is owned by households (Business Insider ). The fortunes of the stock market affect most people, even those on the margins of our economy.

A quarter of companies in the SP500 have reported earnings this month. Annual earnings growth is 12% (FactSet ). In response to the new tax law, companies are bringing home their overseas cash profits and paying Federal taxes on the repatriated profits. Most are predicting strong profit growth for the coming year. Home Depot announced that they are paying bonuses to all their employees.

Since the tax law was signed, the dollar has dropped 5% against the euro. This will make U.S. exports cheaper and more attractive to overseas markets. A euro of profit earned in the Eurozone market was worth $1.07 a year ago when Donald Trump took the oath of office. That same euro is now worth $1.24. Half of the profits of SP500 companies come from overseas, and investors are betting that the dollar will not strengthen substantially in the coming year, despite Trump’s insistence that he likes a strong dollar.

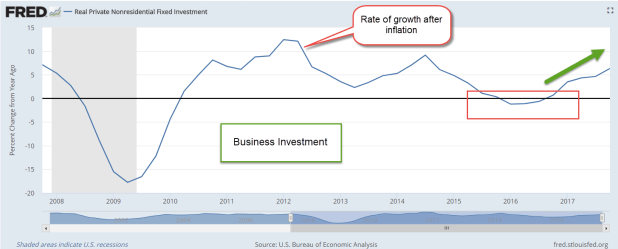
The first estimate of GDP growth, announced Friday, was 2.6%, down from the above 3% performance of the 2nd and 3rd quarters but much better than the 2% and lower rate of growth during 2015 and 2016. The growth of business investment has accelerated over the past four quarters and is nearing 7%.

NonResInvest

Consumer spending grew by 3.8% in the final quarter of 2017, and confidence is near twenty-year highs. Accelerating business investment and a rising stock market help those on the margins of the economy. Unemployment is low. As companies struggle to find employees, they turn to those that they might have turned away a few years ago.

My checker at Target last week had a slight speech defect.  A few years earlier, Target management might have put this person on some duty that did not have such frequent contact with the public, if they hired such a person at all.  Unless there is a specific outreach program, many companies are reluctant to hire those with impediments when there are many able-bodied candidates to choose from.  I was glad to see this twenty-something man employed.

At my local Home Depot a few weeks ago, a guy in a motorized wheelchair helped me locate an item. I got my question answered. Good for him, good for me, good for Home Depot.

A rising tide lifts all boats.  Every day the ever-upward stock market convinces scores of people that they are really smart investors. Many who buy “on the dip” are rewarded as they take advantage of a short term price decline. Some who timidly stayed in cash become convinced that they were too conservative.  They may listen to the market gains enjoyed by their co-workers, family and friends, and feel left out.  How to catch up?  They could take out a home equity loan and use the cash to buy stocks, some leveraged ETFs, or maybe some bitcoin.  Some of those have been on a tear lately.  Hmmmm…

Here’s the thing about a rising tide. A lot of ideas make sense while riding a good tide.


Free Stuff

January 21, 2018

by Steve Stofka

I like the 21st century. I get a lot of free stuff. Opinions, news and information, and directions to anywhere on the planet. Free apps and games for my phone. Free porno and free sermons.

I get so much free stuff that I can afford to pay for fancy coffee and smart phones, television and internet access. I can now afford a personal guru to align my chakras. My personal assistant, Alexa, listens to me and answers my questions.

Goodbye and good riddance to the 20th century with its clunky records, cassettes and DVDs. I say “Alexa, play me blankety-blank song,” and millions of tiny electrons do my bidding, and out comes my song!

My real personal income has doubled since 1973 (Average per capita income ) so I got all this extra free money. I’m getting paid more at work than 45 years ago. My total compensation has gone up 44% (Total real compensation per employee ). My employer provided benefits have doubled (Real employee benefits ). My employer kicks in more free money into my retirement program, and into my health care insurance. That’s real dollars, after inflation.

I got so much extra free money coming in that I’m living like royalty. My income has gone up 100% in 45 years, but my spending has increased 137% because I’m a first class 21st century person that banks want to loan money to.

Outlays1973-2017

Since 2000, I eat out a lot more – like 75% more (Real restaurant sales ). I deserve it cause I’m making all this extra money and I’m too busy to cook. In 2000, I was spending $11.50 a day for shelter but I needed more personal room and modern conveniences. Now I got more room but I’m spending $16 a day.

HousingCostRealPerCap2000-2017

Living first class means that I’m saving a lot less of my free extra money.  45 years ago, I was saving 12% of my income.  Now it’s 3%. But there’s an easy fix to that. More free stuff!
//////////////////////////////

Farming Communities

This past summer, my wife and I joined the many thousands of solar eclipse watchers who visited western Nebraska, where the totality and length of the eclipse was near its peak.  At hotels, shops and restaurants we were greeted with a cordiality that is typical of Nebraskans.  They worked extra hours to accommodate the influx of visitors. At one restaurant, our waitress remarked that the extra business would make up for the slack earlier in the year.  The reason?  Not the food and service, which were both excellent. The locals weren’t eating out as much. And why was that?

Last week, I wrote about the seven-year downturn in commodity prices that has affected many rural communities.  Although agriculture contributes about 6% to GDP (USDA) the changing fortunes of the people who produce our food gets little attention in urban areas.

A few hundred miles away, Denver is booming.  Gentrification and rising housing costs have stressed the pocketbooks of some families.  In Nebraska, it is declining prices that have caused stress fractures in the community (Denver Post ). Land values declined 4% in 2015, and another 9% in 2016 (U. of Nebraska-Lincoln report).

Despite a strong export market for corn, soybeans and other agricultural products, Iowa has had falling land prices for three years. In a recent survey, 40% of responding Iowa farmers reported lower sales in 2017.  However, there was a slight uptick in land values this past year and the hope is that the Iowa agricultural community may be turning a corner.

As land values decline, banks lower lending limits, refinancing terms become more strict.  Families sit at the kitchen table and try to pay higher bills with less money.  Property taxes decline so that there is less money for schools and other public infrastructure.  Seeing the stress that their parents face, younger folks are attracted to urban areas where there is more economic opportunity.  Farms that have been in the family for several generations get sold to large farm management companies.

The governors of western states must understand that they serve all the people of their state.  As people concentrate in the urban centers, they demand more resources from the state.  Those in rural areas feel as though they are being left out.  They will form elective coalitions within state legislatures to offset the growing urban power.

To those in the dense population centers of the coastal states, the shifting political and economic alliances in the fly-over states might earn a shrug.  Our federalist system of voting was a grand bargain to offset the dominance of high population states.  The 2016 election was a good lesson in the power of electoral federalism.  State and federal politicians must build a bridge that crosses the divide between the fortunes of those in urban and rural areas.

Ten Year Review

January 14, 2018

by Steve Stofka

To ward off any illusions that I am an investing genius, I keep a spreadsheet summarizing the investments and cash flows of all my accounts, including savings and checking. Each year I compare my ten year returns to a simple allocation model using the free tool at Portfolio Visualizer. Below is a screen capture showing the ten-year returns for various balanced allocations during the past several years.

10YrReturn20180112
The two asset baskets are the total U.S. stock market and the total U.S. bond market. A person could closely replicate these index results with two ETFs from Vanguard: VTI and BND. Note that there is no exposure to global stocks because Portfolio Visualizer does not offer a Total World Stock Asset choice in this free tool. An investor who had invested in a world stock index (Vanguard’s VT, for example) could have increased their annual return about 1.3% using the 60/40 stock/bond mix.

I include my cash accounts to get a realistic baseline for later in life when my income needs will require that I keep a more conservative asset allocation. An asset allocation that includes 10% cash looks like this.

10YrReturnStkBondCash20180112
In the trade-off between return and risk, a balanced portfolio including cash earns a bit less. In 2017, the twenty-year return was not that different from the ten-year return. From 2009 through 2011, ten-year returns were impacted by two severe downturns in the stock market.

//////////////////////

The Hurt

Falling agricultural prices for seven years have put the hurt on many farmers. This decade may turn out to be as bad as the 1980s when many smaller farms went belly up because of declining prices. Remember the Farm Aid concerts?

The Bloomberg Agriculture Index has fallen about 40% over the past five years. While farmers get paid less for their produce, the companies who supply farmers with the tools and products to grow that produce are doing reasonably well. A comparison of two ETFs shows the divergence.

DBA is a basket of agricultural commodity contracts. It is down 33% over the past five years.
MOO is a basket of the stocks of leading agricultural suppliers. The five-year total return is 31%.

The large growers can afford to hedge falling prices. For family farmers, the decline in agricultural prices is a cut in pay. Imagine you were making $25 per hour at the beginning of 2017 and your employer started cutting your pay bit by bit as the year progressed? That’s what its like for many smaller farmers. They work just as hard and get paid less each year.

Long-Term Trends

January 7th, 2018

by Steve Stofka

This week I’ll look at a few long-term trends in the marketplace for goods and labor.  Millennials born between approximately 1982 – 2002 are now the largest generation alive. Their tastes will dominate the marketplace for the next twenty years at least.  In the first eighteen years of the new century, change has been a dominant theme.

Some businesses drowned in the rush of change. A former member of the Dow Jones Industrial Average, the film giant Eastman Kodak is a shadow of its former self after it emerged from bankruptcy in 2013.

Some in the music business complain that the younger generations don’t want to pay for music. Much of YouTube music is pirated material and yes, Google, the site’s owner, does remove content in response to complaints. There’s just so much of it. Album sales revenue in the U.S., both digital and physical, fell 40% in the five years from 2011 to 2016. Globally, the entire music business has lost 40% in revenues since the millennium and is just now starting to grow again (More).

Some in the porn industry make the same complaint as those in the music business. As online demand for porn grew, the industry helped pioneer digital payment security. Now there is too much free porn on the internet. Producers and distributors pirate each other’s content. Who wants to invest in good production values only to see their work ripped off? (Atlantic article/interview on the porn industry) Will the lack of quality reduce demand? ROFL!

An ever-diminishing number of city newspapers struggle to survive. Some complain that people don’t want to pay for local news. Local reporters have long been the bloodhounds who sniff out the corruption in city halls and state capitols around the country. There are fewer of them now.  Think that corruption has been reduced?  ROFL!

Surviving bookstores glance over their shoulders at Amazon’s growing physical presence in the marketplace. This year Amazon became the 4th largest chain of physical bookstores. The large book publishing houses try to preserve their hegemony as readers turn to a greater variety of alternatively published books.

As online sales grow, brick and mortar stores struggle to produce enough revenue growth to sustain the costs of a physical store.  During the past three years, an ETF basket of retail sector stocks (XRT) is down almost 10%.

Hip-hop music was a fad of the ‘80s and ’90 until It wasn’t. Rock ‘n Roll was a fad that has lasted sixty years. In the early 60s, the Beatles were told to make it rich while they could, and they worked hard to capitalize on their success before it fizzled. Never happened.

How are we going to predict the future if it is so unpredictable? Some standards fade while some fads become standards. We face the past, not the future, as the future sneaks up on us from behind.

//////////////////////////////

Employment

A few notes on what was the weakest employment report of the past year. Job gains were only 150K as reported to government surveyors but the percentage of businesses responding to the survey was particularly low. Expect the BLS to revise those job gains higher next month when more of the survey forms come in. I have long used an average of the BLS numbers and ADP’s estimate of private job gains. That average was 200K – a healthy number indicative of a growing economy.

The long-term trend remains positive. The annual growth of total employment should be at 1.5% or above. We are currently holding that threshold despite the loss of jobs to automation and the growing number of Boomers retiring.  Growth in construction jobs  remains at or above the growth in total employment – another healthy sign.

ConVsPayemsGrowth

The employment market faces a long-term challenge as the largest generation of workers in history is retiring. In January 2000, 69 million adults were out of the labor force. That figure now stands at 95 million. As a ratio, there were 53 adults not in the labor force for every 100 adults with a job. Now there are 65 adults for each 100 workers.

NotInLabForceVsPayems

Although growth in hourly wages is at 2.5%, weekly paychecks have grown 3% as part-time workers get more hours or find full-time jobs. Look for inflation to approach that growth in paychecks.

WeeklyEarnVsInflation

When inflation rises above paycheck growth, workers struggle more than usual to balance their income with spending.  I’ll use that same chart to highlight some stress points during the past decade.

WeeklyEarnStressPoints

As the economy continues to improve, the Fed is expected to continue increasing interest rates either two or three times in the coming year.  After a decade of zero interest rates (ZIRP), those with savings accounts may have noticed that their bank is paying 1% or more in interest.  It is still a far cry from the 4% to 5% rates paid on CDs in the ’90s and 2000s.  This past decade has been particularly worrisome for older folks trying to live off their savings.

Years Past

December 31, 2017

by Steve Stofka

This past week, I found a July 2008 Wall St. Journal used as shelf liner. On the eve of 2018, a look back has some useful reminders for a casual investor.

Journal20080703

Most of us remember the financial crisis that erupted in September 2008. What we may not remember is that the first half of that year was very volatile. In reporting about the first half, there were “warnings of the collapse of the global financial system.”

In the first six months of 2008, 703,000 jobs had been lost. The job losses continued until March of 2010 and totaled a staggering 8 million. In early July 2008, the stock market had lost 16% from its high mark in October 2007 but a balanced portfolio of 60% stocks and 40% bonds had lost only 8%. To prepare for a difficult second half of 2008, investors were cautioned to:
1) Balance
2) Diversity
3) Spend less and invest more
4) Don’t pay high investment fees
5) Don’t get greedy and chase get rich investments

The advice is timeless.

/////////////////////////

Tax Reform

In a holiday week, thousands of residents in coastal states lined up at their local tax assessor in order to pre-pay 2018 property taxes in 2017.  Most of these residents have annual property taxes that exceed the $10,000 cap on all state and local taxes that can be deducted on 2018 Federal taxes.

The IRS said that they would not allow deductions for prepaid taxes unless the local district had assessed the tax by December 31, 2017.  We may see lawsuits over the definition of the word “assess.” When is a homeowner assessed a property tax?  When they receive a bill?  When the district announces the rate for the following year?

In their battle against the IRS, Republicans have cut the agency’s funding so much that the IRS does not have the resources to perform audits on several hundred thousand to determine the status of assessment.  The courts will likely weigh in on the question.  Come next November, voters will register their opinions.

The New York Times featured a several question calculator  to estimate the effect of the tax bill on your 2018 taxes.

///////////////////////

Income

Economists have noted the decades long decline in inflation-adjusted wages.  Since 1973, the share of national income going to wages and salaries has declined by 14%.

WagesSalariesPctGDI

Employee benefits as a percent of gross domestic income have grown by a third since the 1970s. Of course, a person cannot spend benefits.

BenefitsPctGDI

Even after the increase in benefits, total income is down. In 1973, 50% of Gross Domestic Income (GDI) went to wages and salaries + 7.5% to benefits for a total of 57.5%. In 2016, 42% went to wages + 10% to benefits = 52%.  Total compensation is down 10%.

As the wealth of the affluent continues to grow, the ratio of net wealth to disposable income has reached an all-time high.

WealthPctInc
It is inevitable that extreme imbalances must revert to mean.  The last two peaks preceded severe asset repricings.

Taxes, Bitcoin, and Housing

December 24, 2017

by Steve Stofka

Merry Christmas! Because of the holidays, I’ll keep it short. A few notes on the tax bill passed this week and some odds and ends I’ve collected.

In the final version of the tax bill, the state and local tax (SALT) deduction was limited to $10,000.  This limitation will hurt those in the coastal “blue” states.  As a group, these states already pay more in Federal taxes than they receive in various Federal programs.  The limit on the SALT deduction will take even more money from blue states and give it to red states. There is a second transfer taking place intra-state.

There are several components to SALT: income, sales and property taxes. According to the Census Bureau’s American Community Survey, almost 50 million households own a home with a mortgage.  Under current tax law, they get to deduct whatever mortgage interest they pay. Rich homeowners take the bulk of the mortgage interest deduction on their million-dollar homes.  50 million households rent. They get to deduct zilch.

For decades, homeowners have been in a protected class and able to deduct their property taxes. Renters have enjoyed no such deduction.  The owner of the building gets the deduction.  Think the owner is sharing that tax largesse by lowering rents?  No. For years, renters have effectively subsidized the tax deduction for their homeowning neighbors. The new tax bill transfers some of that tax burden from renters back to homeowners, putting both types of households on a more even level.

The density of coastal populations requires more infrastructure supplied by states, cities and towns.  Unless there is a natural resource like oil that can be taxed, local jurisdictions need higher taxes to pay for the added infrastructure. Secondly, the population density leads to more competition for land and housing, which causes higher property prices.  Even if New Jersey and Colorado charged the same property tax rate, the higher home prices in New Jersey would result in higher taxes.  But the two states don’t charge the same rate.  New Jersey averages almost twice the property tax rate charged by counties and towns in Colorado.

If you would like to compare property taxes in your state, county, or zip code with others, you can click here (https://smartasset.com/taxes/new-jersey-property-tax-calculator)

Democrats have long championed a graduated income tax, and the more graduated the better. The limit on the SALT deduction effectively levies more tax on those with higher incomes. That is the core principle of a graduated tax. Isn’t that what Democrats want?

//////////////////////////

Bitcoin Bumps

After surging more than 2000% this year, bitcoin has fallen 40% this week, but is still up more than 1400% for the year. 80% of the trading volume this year has come from Asia. Japanese men have turned from leveraged forex trading to bitcoin and other digital currencies. (WSJ article)

As an exchange of value, currencies should be stable. When they are not, they have failed, and it is invariably due to a failure of government policy. Venezuela is a current example. From 2007-2009 Zimbabwe’s currency failed, and even today, they use the U.S. dollar. Germany in the 1920s is probably the most egregious example of a failed currency.

Bitcoin is not a currency. Bitcoin is an asset but barely that. Buyers of bitcoin and other digital “currencies” are buying a share in the “greater fool” theory. Yes, the concept is brilliant. Ledger transaction chains solve many problems in international exchange. But digital transactions take too much energy to serve as a currency. In the time that it takes to validate the transfer of one bitcoin, hundreds of credit card transactions take place.

Bitcoin is not secure. A South Korean bitcoin exchange went bankrupt this month when it was hacked, and its reserves stolen. (CNN article) . Mt. Gox is the most well-known bitcoin hack victim, but there are others (Top 5 Bitcoin Hacks ).

//////////////////////////

Housing Prices to Income Ratio

New home sales in October were 10% above estimates. The average price of a new home hit an all-time high of $400K. The median price is $316K, more than five times the median household income. Here’s a graph of that housing price/income ratio for the past thirty years.

HomePriceIncomeRatio

The ratio first broke above 4 in 1987 and steadied for the next 13 years. During the housing bubble in the 2000s, the ratio rose swiftly and crossed above 5. As the bubble popped in 2007 and millions of people defaulted on their loans, the ratio fell as fast as it rose. Since the Financial Crisis, low interest rates have helped fuel another bubble.

The recent Case-Shiller housing index was higher than expected. Home prices are going up 6% per year, twice the rate of increase in incomes.

/////////////////////////

I’ll have more next week on long-term trends in income and inflation. Have a merry and take care of year ending stuff this week! Those with high SALT deductions might consider paying 2018 property taxes in 2017 but there is some question whether the IRS will allow the deduction. See this L.A. Times article.

Tax Reform Is Calling

by Steve Stofka

December 17, 2016

On our journey on the sea of life, we sometimes hear the siren call of politicians who promise simple taxes. “File your taxes on a postcard” their voices echo across the waters as they invite us to their island. Our journey is long and treacherous, so we are drawn to the prospect of simple tax filing.

Some taxpayer boats weave through the sharp rocks that lay just off the sandy shores of the simple tax island. They are greeted by the politicians who give them postcards to celebrate their arrival. Many boats are caught in the turbulent waters and are swallowed up by the tax monsters lurking in the sea.  “Alas!” they wail as they curse themselves for their attraction to the politicians’ call.

So the story goes with the tax bill that Republicans hope to pass next week. I didn’t think that the bill would get this far.

Many paycheck employees will find the new tax rule simpler. Student loan interest will continue to be an “above the line” deduction from income. The child tax credit will be doubled to $2000. To satisfy Republican Sen. Marco Rubio’s demands, more of this credit will be refundable to those taxpayers who pay little or no income tax.

Those in high tax states will suffer under the new tax bill, which allows only $10,000 in combined deductions for state, local and property taxes (SALT). Deductible mortgage interest will be capped as well. Tax policy has long subsidized homeowners over renters and favored those in coastal states (NY Times article).

Many taxpayers will find it more advantageous to take the newly doubled standard deduction of $24,000.  Under the new law, 529-college funds can now be used for K-12 tuition and qualified expenses.

Caught in the rocks and turbulent waters are professionals and business owners, who have adopted “pass-through” ownership structures to legally minimize taxes under current law. This group accounts for 30% of all business income. As this Journal of Accountancy article notes, court rulings and IRS guidance can be complex and contradictory. The new tax bill only complicates the familiarity of the existing complexity.

These non-paycheck earners receive all or part of their business income through a Sub-S corporation, an LLC, or partnership. Unlike a conventional C-corporation, these businesses “pass through” their profits to the owner/partners who pay at a personal tax rate. Under the new tax bill, some of that income may be subject to a 20% exclusion from taxes.

Under the new tax bill, the tax rate for C-corps will be reduced to 21%. Depending on individual circumstances, some owner groups may find it advantageous to adopt a C-corp ownership structure.

25 million sole proprietors  account for 11% of non-farm business income. Many are low-profit or part-time businesses which will remain sole proprietors. Higher volume businesses may want to revisit their ownership strategies with their accountants.

Corporations will benefit from the reduced tax rate but the accountants for publicly held corporations are dreading the prospect that the new tax law will be signed before the new year. Under GAAP accounting rules, those corporations must estimate the effect of the tax changes and present those estimates at the next earnings announcement which are scheduled for late January or February. Number crunchers can cancel that Cabo vacation during Christmas week.

The rich benefit because they pay an outsize portion of income taxes. According to the IRS (2016 tax stats on this page) , taxpayers with adjusted gross incomes (AGI) above $500K were only .8% of the 150 million individual returns. Their AGI was 19.4% of the $10 trillion in income reported, but they paid 36.5% of the $1.4 trillion in Federal income taxes.

TaxSumByAGI2016

These high incomes will get a reduction in taxes from 39.6% to 37%. The very rich – those with an AGI above $10 million – get half of their income from capital gains, which are not affected by the new tax law. Despite promising to do so, lawmakers did not reduce or repeal the 3.8% Obamacare tax on investment income for high income taxpayers. Based on 2016 tax data, they probably could not forgo the tax revenue and keep the ten-year cost of the bill under $1.5 trillion.

In short, the new bill will create two classes of taxpayers – the postcard and non-postcard payers. Some tax preparers and accountants may worry that the new law will reduce their business. Rest assured – Congress does not know how to write tax laws that are not complex. Thank God for politics!

Trump To The Rescue

by Steve Stofka

December 10, 2017

This blog post goes to what may be a dark place for some readers. The election of Donald J. Trump may have stopped a year-long slide into recession. I didn’t start out with that conclusion. I meant to point out some interesting correlations in the velocity of money. Yeh, yawn. By the time I was done, not yawn.

If I mention the change in the velocity of money, do you groan at the prospect of a wonky economics topic? Take heart. Anyone who has slowed down from 65 MPH on a highway to 15 MPH in rush hour traffic is familiar with a change in velocity.

The velocity of money measures the amount of time that money stays in our pockets. It signals the willingness of buyers and sellers to make transactions. When buyers and sellers can’t agree on price, transactions fall and the change in velocity goes negative. In the chart below, the change in the velocity of money (blue line) often has a similar pattern to the change in real GDP (red line).

VelocityVsGDP

Both recent recessions were preceded by declines in GDP growth and the speed of money. Following the financial crisis, the Fed began to inflate the money supply in a series of policies dubbed “QE,” or Quantitative Easing. In 2011, after two rounds of QE, the Fed worried that the recovery might stall out.

Let’s turn to the green square in the chart labelled Operation Twist. Obama and a do-nothing Republican Congress were at odds so there was little chance of Congress enacting any fiscal policy to come to the economic rescue. That task was left – once again – to the Federal Reserve to use its monetary tools.

In Congressional hearings, then Fed Chairman Ben Bernanke advised the Senate Finance Committee that the short term interest rate was already zero and the Fed was out of monetary tools. The Congress should step in with a stimulative fiscal policy. The Committee members somberly hung their heads. We are incompetent, they said, so the Federal Reserve will have to rescue the country.

If it expanded the money supply further, the Fed was concerned that they would spark inflation. In hindsight, that fear was unfounded, but none of us has the luxury of making decisions while looking in the rearview mirror. Economic identities like M*V = P*Q (notes at end) are just that – looking in the rearview mirror.

The Fed resurrected a monetary tool from the 1960s dubbed Operation Twist, after the dance craze the Twist (Fed paper).  Early Boomers will remember Chubby Checker. The Fed began selling the short-term Treasuries they owned and buying long term Treasuries. By increasing the demand for long term Treasuries, the Fed drove down long-term interest rates as an inducement for businesses and consumers to borrow. Despite the low rates, consumers continued to shed debt for another year. How effective was Operation Twist – maybe a little bit (Survey).

As the price of oil declined in late 2014 and the Fed ended yet another round of QE (QE3), there was a real danger of moving into a recession. Notice the decline in GDP growth (red) and money velocity (blue).

The downward trend barely reversed itself in the 3rd quarter of 2016, just before the election, but not by much.

MoneyGDPGrowth2013-2017

The election of Donald J. Trump and a single party controlling both houses of Congress kindled hope of a looser regulatory environment and tax reform. Only then did the speed of money turn consistently upward. But we are not out of the woods yet. A year later, in late 2017, money velocity is still negative. As I said earlier, buyers and sellers still cannot agree on price. There is a mismatch in confidence and expectations. Until that blue line turns positive, GDP growth will remain tepid or turn negative.

///////////////////

M*V = P*Q is an identity that equates money supply (M) and demand (V) to inflation (P) and output (Q).


Expectations

by Steve Stofka

December 3, 2017

What can I expect from my portfolio mix? Portfolio Visualizer has a free tool  to analyze an asset mix. We can also get a quick approximation by looking at a fund with that mix.
An investor with a 40/60 stock/bond mix might go to the performance page of Vanguard’s Wellesley Income fund VWINX. It’s 50-year return is close to 10% but that includes the heady days of the 1970s and early 1980s when both interest rates and inflation were high. The ten-year performance of this fund includes the financial crisis and is close to 7%.

An investor with a slightly aggressive 65/35 stock bond mix could look to Vanguard’s Wellington Fund VWELX, which has a similar weighting. It’s 90-year return is 8.3% but that includes the Great Depression and WW2. It’s 10-year return is – wait for it – close to 7%.

Two funds – a conservative 40/60 and a slightly aggressive 65/35 – both had the same ten-year returns. All it took was one bad year in the stock market – 2008 – to even up the returns between these two very different allocations. On a year-by-year comparison of the two funds we see a trend. During the two negative years of this fifteen period, I charted the absolute value to better show that trend. Also, compare the absolute values of the returns in 2008 and 2009. The collapse and bounce back was about the same level.

VWELX-VWINXComp

During this fifteen year period, the cautious mix earned 88 cents to the $1 earned by the slightly aggressive mix. Looking back thirty years, cautious made only 75 cents. In the past fifteen years, the difference between positive and negative years was important. In good years, cautious earned 20 cents less. But in negative years, like 2002 and 2008, cautious made 73 cents more by losing that much less.

////////////////////////

Personal Saving Rate

The savings rate is near all-time lows. We’ve seen a similar lack of caution in 2000 and 2006. As housing and equities rise, families may count those gains in their mental piggy bank. Asset gains are not savings. Asset prices, particularly equities, will decline during a recession. Jobs are lost. Without an adequate financial cushion, families struggle to weather the downturn. The rise in bankruptcies and foreclosures further exacerbates the downturn.
SavingsRate1998-2017

///////////////////////////////

Annuity

A good explanation of the various types of annuities.  The graphics that the author presents might help some readers understand the role of annuities, and the advantages of deferred vs. immediate annuitues.  I have also posted this on the Tools page for future reference.

http://www.theretirementcafe.com/2017/11/income-annuities-immediate-and-deferred.html