March 11, 2018
by Steve Stofka
Today time springs forward. Tufts of grass turned green, and some trees are beginning to bud. It was still light after 6 P.M. even before the time change. Great flocks of cranes fly north. In the springtime evening we can hear the siren call of the booby headed tax deadline. 2017 IRA contributions are due by April 15th.
This is a good time to check our game plans. Are we saving enough? In the accumulation, or pre-retirement, phase, 10% or more of our income is a good savings goal. 5% is an absolute minimum. Savings should be used to pay down any debt that has an interest rate more than 5%. High interest rate loans are a weight we must drag around with us. Consider working part time for a while and using that money to pay down high interest rate debt.
New car loans now average over $30K with an average maturity (length of payment period) of 67 months. The average interest rate is 4.21% but anyone with less than a FICO score of 690 is paying 5% or more. This article has breakdowns by credit score, lending institution, length of loan, and other factors.
Of the money we have saved – any annual portfolio realignments to be done? This is a good time to not only think about it but to do it.
In the distribution phase of a portfolio, we begin to withdraw funds from the portfolio that we have accumulated through a lifetime of saving. Using Portfolio Visualizer, I’ve compared two portfolios with a 60/40 mix – 60% stocks, 40% bonds and cash. These backtests include an annual rebalancing that may be more difficult for funds in a taxable account because buying and selling may generate taxable capital gains.
Let’s pretend a person retired in May of 1998 at the age of 68 and just died last year. During this twenty years, there were two times when the stock market fell 50%. The beginning year 1998 is near a high point in the stock market. The ending year 2017 was the 8th year of the current bull market. The test begins and ends at strong points in the market cycle, a key feature of a test like this. Beginning a backtest with a trough in the market cycle and ending with a peak only distorts the results.
Portfolio
At the time of retirement, our retiree had a $1 million portfolio, although the amount could have been $100,000 or $10 million.
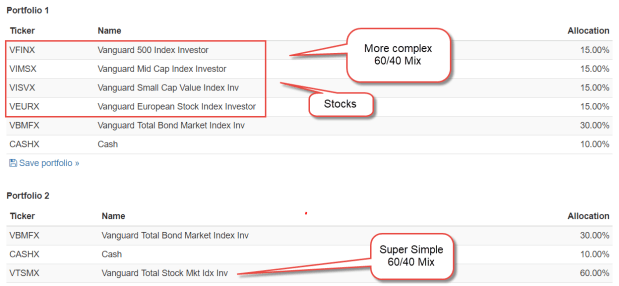
Although the stock allocation is the same for both portfolios, Portfolio 2 is totally simple. Put all the money in Vanguard’s Total Stock Market fund and forget about it. Portfolio 1 manually diversifies the 60% stock portion of the portfolio among four classes: Large capitalization, mid cap, small cap value stocks in the U.S., and European large cap stocks. Think of Goldilocks sitting down to a table with four bowls of soup – big, medium, small and European. If that person retired today, a diverse stock portfolio would include an emerging markets index fund like Vanguard’s VEIEX. In 1998, emerging markets were not part of a core portfolio as they are today. For this test, I left out emerging markets.
The bond portion of the portfolio is an index fund of the total bond market. Both portfolios hold 10% in cash for emergencies and living expenses.
Income
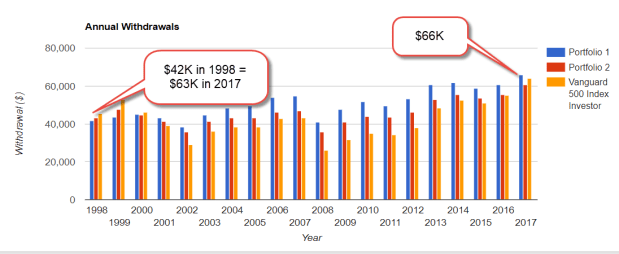
A portfolio is like snow in the Rocky Mountains that melts and flows toward the Pacific Ocean. Will the water make it to the ocean? Each year this retiree withdrew 4% of their portfolio balance for expenses. That percentage is considered safe during most twenty-year retirement periods. Note that some advisors are using a thirty-year retirement period to test a portfolio mix. As the years go by and the purchasing power of a $1 erodes, will 4% be enough to meet a retiree’s income needs? The more diverse portfolio allowed the retiree to withdraw a larger amount every year, and the annual withdrawal did keep up with inflation. Secondly, the ending balance was about the same as the beginning balance after adjusting for inflation.
Return
The more diverse Portfolio 1 (marked complex in graphic below) has a better return over this twenty-year period. See the Internal Rate of Return (IRR) column, which adjusts for the withdrawal amounts each year.

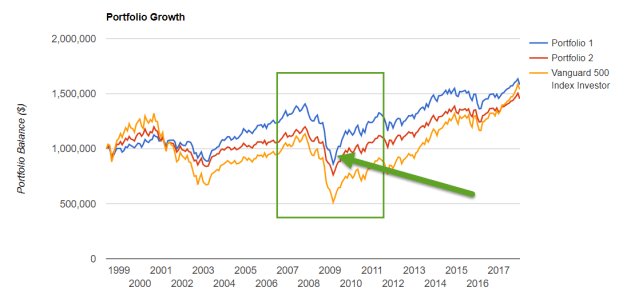
The drawdown, or greatest decline in value, in the time series is a critical test of a portfolio mix. The retiree needs that portfolio to generate a certain amount of income every year. If the portfolio falls to zero, the income stream has dried up. In the chart below, look at the dip in the portfolio value during the 2008 Financial Crisis. The more diverse Portfolio 1 (blue line) dipped below the starting $1 million figure, but not by much. The investor who was 100% invested in the stock market, the 500 Index portfolio (yellow line), fared the worst during most of the twenty-year period. In a sign that the bull market has matured, the 500 Index has overtaken the simple 60/40 mix (red line) and is about to overtake the diversified 60/40 mix (blue line).
The diverse portfolio is not complex. There are no gold or commodity assets, no energy or natural resource funds, and no real estate REITs to manage. If emerging markets were added to the Goldilocks mix, there would now be five equal bowls of soup, each of them taking 12% of the portfolio. This portfolio would have earned 4/10% better each year.

We could add a Pacific stock index like Vanguard’s VPACX to the mix, but when do we stop adding indexes? In this time period, that index had a slight negative effect on returns. As the number of indexes grow, we are less likely to adjust our allocation.
Our portfolios can get cluttered and too complicated to be effective and easily managed. Can we simplify? It’s worth a look see. In taxable accounts, de-cluttering and re-balancing can generate taxable capital gains, so it might not be advisable to make any changes.
