JPMorgan Hedge

The recent scandal involving JP Morgan’s hedging loss of $2.3 billion (and is growing by $100 to $150 million per day),  has refocused attention on the Volcker rule, a key provision of the 2010 Dodd-Frank bill that initiated a new set of regulatory restrictions on the banking industry.  At more than 800 pages, the law spawns millions of new regulations, many of which won’t be finalized until July of this year, when the Federal Reserve is to start supervising the banking industry to bring them into full compliance with all the regulations by 2014.  The Volcker rule was ostensibly designed to curb the gambling type of hedging that brought the banking industry and the economy to its knees in 2008.  The JPMorgan fiasco has ignited a debate among politicians and pundits, bankers and regulators as to whether this trading strategy would have fallen under the purview of the Volcker rule.

As always, the devil is in the details.  Section 619 of a draft version of the bill stated that banks might initiate hedging trades “in connection with and related to individual positions.”  The banking lobby wanted to insert two small words “or aggregated” so that the final version of the bill would read “in connection with and related to individual or aggregated positions.”  They may have argued that banking and/or investment firms do aggregate a position over time through a series of trades, a common practice to avoid “moving the market” with a single large trade.  This, in fact, is the final language of the Dodd-Frank law (pg. 249)
Some argue that these two simple words effectively negates the effect of the Volcker rule because it allows an investment bank to engage in any hedging strategy as a tool to ameliorate the risk of any portion of the banks portfolio of investments.  The entire bank’s portfolio is, after all, an aggregated position in the market.  In effect, the language of the law allows investment banks to engage in the same kind of risky bets that the Dodd-Frank law is supposed to curtail. Jamie Dimon, the Chairman and CEO of JP Morgan, insists that the failed hedge would not have fallen under the Volcker rule.  There are about 150 bank regulators who work in the home offices of JP Morgan, constantly monitoring the operations of the largest bank in the U.S.  Either those regulators did not know of the hedge or did not understand the risks involved.  The trades were initiated in London so it might be feasible that the regulators did not know of the trades – except that both Bloomberg and the Wall St. Journal had called attention to the risky trades in April and Jamie Dimon had dismissed any concerns about the risks.  This example should refute the arguments of those who champion ever more regulation and more regulators of all business activity as the solution to keep the public safe.  The housing, securities, banking and insurance industries are all heavily regulated yet the confluence of poor risk management in these industries led to the debacle of 2008.  Regulations too often morph into a job programs for regulators and lawyers without achieving the desired goal of protecting the public from grievous harm.

The voters elect representatives to go to Washington to write competent laws.  Instead, the voters get poorly written laws written by a mish-mosh of inexperienced lawyers, industry lobbyists and passionate but impractical partisans.

JPMorgan gives the impression that Bruno Iksil, the London trader responsible for these aggressive trades, was a rogue trader  –  that the bank’s risk management team should have supervised him more closely.  What JPMorgan doesn’t readily disclose is that Mr. Iksil made the bank almost a half billion in profit just six months ago using equally aggressive trades.  Why supervise someone who apparently has the golden touch?

Where does JPMorgan get the money to engage in this risky gambling?  Your money.  JPMorgan had about $1.3 trillion in deposits from small depositors and large customers on its books but only about $700 billion in loans, leaving it with a lot of extra money, insured by the taxpayer, to gamble with.  They lost.  For now, the stockholders are the ones who have paid the price.  The stock has lost 24% of its value since the trading loss was confirmed by Jaime Dimon.  The amount of money lost so far is less than 1% of JPMorgan’s assets.  But it raises the question raised so alarmingly just a few years ago:  WTF????!!!  When I put my money in a bank, I expect them to keep it safe.  I don’t want the bank to take my money and gamble it.

Employment – April 2012

This past friday, the Bureau of Labor Statistics (BLS) released their monthly assessment of labor conditions in this country and the headline figure was a disappointment.  The survey of businesses showed a seasonally adjusted 115,000 net jobs added in April, below the 150,000 expected by economists.  The unemployment rate dropped to 8.1% as almost 350,000 people simply dropped out.  Some of this was due no doubt to early retirees but the Federal Reserve estimates that retirees account for about 25% of the drop out rate.

As I have done in the past, I’ll take a deeper look at some numbers behind the headline numbers.  The core work force of people aged 25 – 54 continues to show gains but the chart below shows the comparative weakness of this segment of the work force.  This age demographic is the “middle”, when people accumulate both earning and buying power and form the primary demand of a consumer economy like the U.S.

The year over year job gains continue to climb upwards.

Late last summer, the larger work force of those aged 25 and older began showing year over year job gains several months before the core work force, revealing an underlying structural weakness of both the workforce and the recovery.

Some of the workforce is graying, moving from the core 25 – 54 age demographic into the older 55+ demographic, where workers are trying to save for retirement or taking jobs because their social security and retirement income is not adequate.  With a natural propensity for saving, older workers do not create the needed demand for the economy to grow strongly.  In the chart below is the year over year job gains for those aged 55+ and this is a key metric for it shows which age group have enjoyed the bulk of job gains in this recovery.

Throughout this recession and the massive loss of jobs, older workers have continued to show gains.  Strengths in the labor force statistics have been in retail, business services and health care.  Experienced older workers can be attractive to employers offering business services.  In retail and health care, it may be that older workers have less family responsibility, show a greater reliability and are thus more attractive to employers who enjoy a “buyers” market.  This past month was the first month that gains slowed while the gains of the core work force continued to climb.

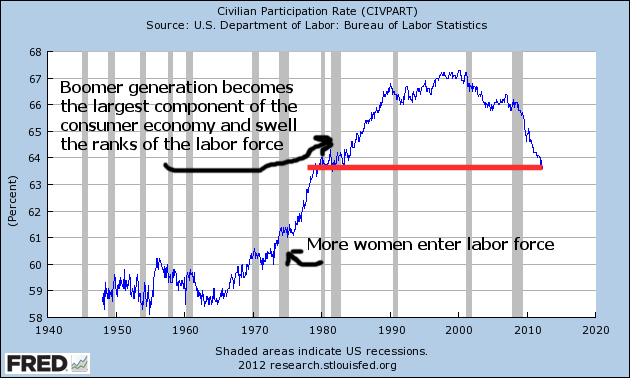
As I have noted before, the demographic bell curve of the past three decades is coming to a close.  The participation rate, the number of workers as a percent of the working age population, has declined to 1981 levels, nearing the closing of an upswell brought on as the post WW2 boomer generation entered their prime working years.

The 1980 Census shows that, there were 25.5 million people 65 and older in 1980 (11.3% of the total population), an increase of 5 million from the 20.0 million count (12.3% of total) in 1970.  While the numbers climbed, the percentage stayed stable in that 10 year period.  Those aged 50 – 64 numbered 33.4 million, or 14.7% of the population.  In 1970, it was 29.7 million or 14.6%.  Again, the numbers were stable.  The median age of the U.S. population was 30.

Fast forward to the 2010 census and the percentage of those aged 65+ is still relatively stable at 40.3 million or 13.0% of the population.  Despite all the medical advances of the past 30 years and the trillions of Medicare dollars spent on the elderly, the percentage of older people is still about the same as it was in 1970 and 1980.

But the juggernaut of Boomers is waiting in the wings.  The 2010 Census shows that those aged 50 – 64, the “meat” of the Boomer generation, numbered 58.8 million, or 19% of the total population.  In thirty years, they have increased from 15% to 19% of the population.  The median age of the population is now 37 years, an increase of seven years.

The 25 – 54 age group funds the social contract that provides health insurance and retirement income for older Americans.   For this core work force, the increasing job gains of the past four months have been a welcome sign but, as the chart above shows, this core has suffered huge job losses in the past 3+ years and are climbing out of a deep hole.  I hope that April is the beginning of new trend, where the job gains increasingly go to the core younger segment of the work force and not to older Americans.  Only then will we see sustainable economic growth.

Unemployment and Recession

As the political machine of both parties gears up for the Presidential election less than seven months away, we will hear a lot of rhetoric about the unemployment rate.  Depending on the talk show, TV program or publication we will hear many different unemployment figures and the Bureau of Labor Statistics (BLS) does publish several different figures each month.  The headline number published each month is the U3 rate – those people who are not employed but have looked for work in the past four weeks.  Other rates include discouraged unemployed (U4), marginally attached workers (U5) and those who are working part time because they could not find a full time job (U6).  Wikipedia has a pretty good overview on the rates in this country and countries around the world.  The BLS has a detailed explanation of the various categories of unemployment with concrete examples of who they put into each category.  Below is a chart of the U3 rate and the U6 rate.

Some will argue that a particular unemployment rate is the “true” rate.  On a conservative talk show a few weeks ago, I heard a caller quote a “true” employment rate of close to 11%.  Neither I, the host of the show or the caller knew where the caller had come up with that figure.  In response to questions from the host of the show, the caller showed that he did not know the various unemployment rates.  Like many voters, this caller simply heard or read about this “true” figure.

In the ongoing political debate, Democratic leaning voters will use the lower U3 rate, currently 8.2%.  Republican leaning voters may use the U6 rate, the broadest measure of  unemployment, currently 14.5%.  Here’s someone who figures the “true” unemployment rate at 36%.  We tend to believe what we want to believe and our mental squirrels are good at finding the facts that fit our beliefs. 

This past month several economic reports, including the monthly unemployment report, indicated that the economy may once again be stalling – as it did in 2010 and 2011.  The recent rise in Spanish government bond yields shows yet another sign of an underlying lack of confidence in the ability of the European market to avoid slipping into a deeper recession.  In the past six months, China’s growth has slowed as they try to transition from an export economy to a consumer economy.  The Bush tax cuts and the debt ceiling are due to expire at the end of the year.  We can expect more political turmoil as that deadline and the election approach.  Weakening economic data in the coming months could exacerbate fears that the U.S. will fall back into recession, escalating the Republican rhetoric that their party needs to be given the presidential reins to turn the economy around.

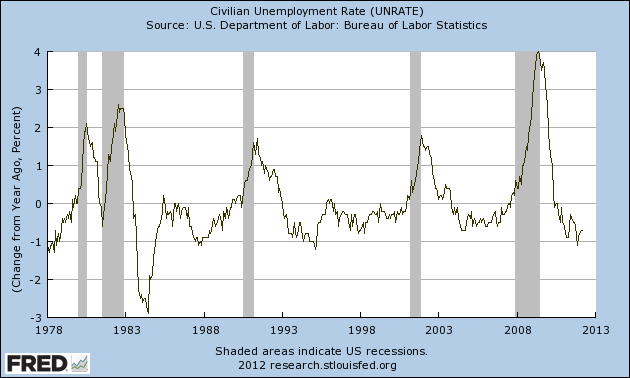
Readers of this blog know that I have been especially skeptical of seasonal adjustments to labor figures in the past few years, preferring to use the non seasonally adjusted figures from the monthly Household Survey that the BLS uses to collect employment data.  But for the chart I’m about to show you, there is not much difference between the seasonally adjusted figures and the non seasonally adjusted figures.  The chart compares the percent change in the data and the seasonally adjusted figures are easy for you to get in the future.

If we begin to hear the economic and political pundits raise worries of recession in the coming months, the data in the chart below is a really reliable predictor of recessions.  There was a slight delay in a minor recession in the 1950s and two false signals in 1986 and 1995 when the economy faltered. Here’s the key:  when the percentage change in the unemployment rate from a year ago goes above zero, it is highly likely that we have either just started a recession or will start one shortly.

In the coming months you can pull up this same chart by going here at the Federal Reserve  or entering “Fred Unemployment” in Google search bar and selecting the top pick.  The Federal Reserve does all the work for you.  Click “Edit Graph” just below the graph.  On the next screen, change the “Observation Date Range” below the graph to start with a more recent year to make the chart easier to read.  Go down to the “(a)” section and select “Change from Year Ago, Percent”.  Below that, click “Redraw Graph”.  Now you too can know the future.

March Labor Repot

This past Friday the Bureau of Labor Statistics (BLS) released the monthly labor report, showing job gains of 120K, far below the 200K expected.  The unemployment rate dropped 1/10th percent to 8.2% as over 100K people quit looking for work.  Contrary to a popular myth, when someone runs out of unemployment benefits they do not drop out of the workforce as long as they are continuing to look for work.

Although this report was a disappointment, the economy has added 247K jobs per month over the past quarter.  As I have done the past few months, I will look beyond the seasonally adjusted headline numbers to the unseasonally adjusted year-on-year job gains of the core work force.  These core figures tempered my enthusiasm in January and February and, as you will see, temper my disappointment in March’s headline numbers.

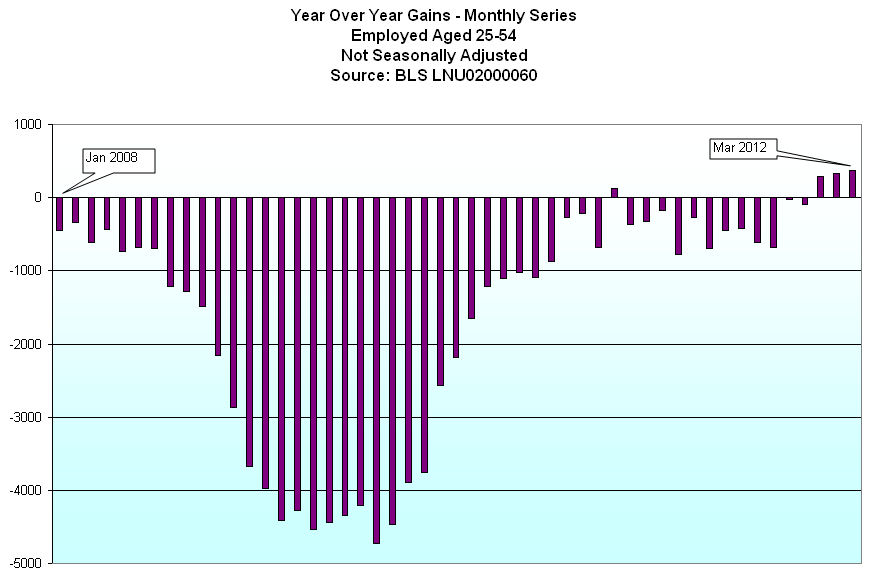
The core work force, men and women aged 25 – 54 years old, continues to show accelerating job gains.  In February, the year over year (y-o-y) gain was 350K.  In March, the gain was 374K, a modest gain but still gaining. A decline in that gain would be cause for worry.

This core work force metric is a powerful leading indicator of the health of the economy, as I will show below in this monthly chart of y-o-y job gains or losses.  January 2008 was the first month that year over year gains slipped below 0 and proved to be the canary in the coal mine that the economy was weakening.

Let’s expand the picture as I have done the past few months, looking at the larger pool of workers aged 25+. The March y-o-y gain did decline somewhat from 2079K to 2048K.  While job gains are strong, the acceleration has reversed.  Did the record breaking warm winter weather push spring hiring forward into January and February?  Could be. Does the March 34K loss in retail jobs largely account for this slight dip in job gains?  Could be.

There are several long term trends that are cautionary, revealing some structural weaknesses in the economy and the recovery.  The number of people who want work but have not looked in the past four weeks, referred to as discouraged workers, was  essentially unchanged. The number of long term unemployed was unchanged.  The average work week fell .1 hours and the income gains of workers shows an annual increase of only 2.1%.  However, the number of people working part time because they could not find a full time job fell almost 10%, an encouraging sign.

In short, this is a mixed report but one that I see, on balance, as more encouraging than discouraging.

Health Care Puzzle

Here is a WSJ guest opinion piece (article was accessible without an online subscription) by a finance professor with the Cato Institute who summarizes the many failings of the health care industry.  They include what amounts to racketeering by the AMA and Congress, an insurance system geared to raise costs in the health care industry, the lack of consistency in the tax treatment of insurance policies, and the lack of individual choice or portability – to name but a few.

Health care is one area where libertarians meet liberals in some agreement.  

Here is a 2007 thought piece by Brad DeLong on some rather simple solutions to the problem of catastrophic health care costs.  Can you imagine a world in which a person who makes $50K a year can rest secure that no matter what illness or accident happens to them, their out of pocket expense will be no more than $10K for that year?

Many years ago, I got a piece of metal in my eye and scored up my eyeball trying to get it out.  It was evening and my doctor’s office was closed so I went to the emergency room at a nearby hospital.  I had catastrophic health insurance with one of the largest insurance carriers in the country, but I had a deductible on the policy that wasn’t meant to cover the rather small cost of an ER visit for an eye injury. 

With my hand covering my painful eye, I presented my ID and insurance card to the ER admitting clerk.  “We don’t accept that insurance,” she said. 
“I’m not expecting this insurance policy to cover the cost of the ER visit,” I replied, “because of the deductible.” 
“No, we don’t have an agreement with this insurance company,” she replied. 
“What do you accept?” I asked.  She mentioned Blue Cross and one other. 
“Well, how do I get care?” I asked. 
“You pay [$560 in today’s dollars] and we will have a doctor see you as soon as possible,” she said.
“Do I get a discount for paying cash?” I asked.
“No, there are no discounts,” she said.
Having nowhere else to go for after hours care, I said “Ok, where do I sign?” 
“You have to pay first,” she said.
“What if it doesn’t cost this much?” I asked.
“The hospital will mail you a refund,” she said.
“What if it costs more?” I asked.
“The hospital will send you a bill,” she said.
“Just out of curiosity,” I asked, “what if I had a Blue Cross policy with a deductible like the one I have?”
“Then the hospital would bill you, she said.
“Would it be the same price?” I asked.
“It would be at the price set by the insurance company and the hospital,” she answered.

The care was excellent and done quickly with little waiting. I was out of there in less than an hour.  The hospital did bill me for a small amount in addition to what I had already paid. 

Over twenty years later, does a similar story still play out in emergency rooms around this country?

Piggy Banks

The Bureau of Economic Analysis (BEA) keeps track of our “piggy banks” in a metric called the Personal Savings Rate (PSR).  This is a measure of disposable income less spending on consumption items.  The rate is a percentage of savings to disposable income.  Below is a graph of the past 60 years, showing the steady decline in personal savings that began in the 1980s. (Source)

The stock market has cheered the recent rise in consumer confidence and spending but – a word of caution.  As the graph shows, the PSR was at 4.7% in December 2011.  This past Friday, the BEA reported that the PSR had declined to 4.3% in January and declined again in February to 3.7%.  In real inflation-adjusted dollars, personal incomes declined slightly at the beginning of this year, making it doubtful that the recent rise in consumer spending can be sustained.

ObamaCare and the Supremes

This past week the Supreme Court (court) listened to oral arguments on the constitutionality of the individual mandate provision of the Affordable Care Act, the health care law often referred to as ObamaCare.  There were several aspects of the law that were argued in separate sessions. These arguments are available in written form  and oral form in mp3 format.  I have included links to the audio below and a link to one of the written transcripts but you can select the transcripts for any of the arguments using the topic list number for each argument.

The first question the court heard was whether the individual mandate was a tax (11-398 Monday Argument).  If the court rules that it is a tax then the 26 states that brought suit against the federal government, which I’ll refer to as the government, have no standing to sue at this time because no one can bring suit against the government before they pay the tax.  In that case, no one could bring suit until 2015 when someone actually pays the tax.  The court would not rule on the constitutional aspects of the mandate till that time.  Wanting a resolution to the constitutionality of the health care law, neither the government or the states wanted to argue that the individual mandate was a tax.  Since neither party wanted to argue the point, the court invited Michael Carvin as separate counsel to argue the case that the mandate is a tax.  The government argued that the mandate is a penalty under the taxing authority of Congress.  Understanding that the health care law is a contentious issue before a Presidential election, the court will probably side with the case that the mandate is not a tax so that they can take up the constitutional questions that the law raises.

The second session (oral or written ) consisted of oral arguments for and against the constitutionality of the individual mandate (11-398 Tuesday Argument).  The third session argued whether the court can strike down the individual mandate and let the rest of the law stand, referred to as the “severability” of the individual mandate, i.e. can the mandate be severed from the rest of the law (11-393 Argument).  The fourth session took up the question: can the federal government withdraw existing Medicaid funds it provides to the states if the states do not want to follow the new additional Medicaid guidelines that ObamaCare imposes (11-400 Argument)

Justice Scalia summarized the concerns of the court’s conservative justices: “An equally evident constitutional principle is the principle that the Federal Government is a government of enumerated powers and that the vast majority of powers remain in the States and do not belong to the Federal Government.”

Is the individual mandate within the scope of Congress’ power?  In Article 1, Section 8 of the Constitution, the Federal government is given a list of enumerated powers.  The Tenth Amendment asserts that “The powers not delegated to the United States by the Constitution, nor prohibited by it to the States, are reserved to the States respectively, or to the people.”  Amendments to the Constitution are the  definitive way to give the federal government an additional enumerated power; the Sixteenth Amendment to collect taxes on income is an example.  Since the federal government’s power is limited to what is allowed under the Constitution, it must argue for an expanded interpretation of the authority given to it by the Constitution.   It does this under the “Basket Clause” power enumerated in Article 1 which gives Congress the power “To make all Laws which shall be necessary and proper for carrying into Execution the foregoing Powers, and all other Powers vested by this Constitution in the Government of the United States, or in any Department or Officer thereof.”

One of those “foregoing powers” is the Commerce clause in Article 1: “To regulate Commerce with foreign Nations, and among the several States, and with the Indian Tribes.”

The intent of the Constitution regarding the federal government is to put limits on the power of that government.  In any case involving the authority of the federal government, the court often wants to hear a limiting provision so that their judicial decision does not open the floodgates for unlimited government authority.  The subject of limits was raised frequently by the conservative justices on the court.  Congress has enumerated powers; the states have plenary powers.  The states can force an individual to buy car insurance; the federal government does not have that authority.  In many areas, the states have coercive powers over the individual that the federal government does not have.

In this case the government argued that the individual mandate is within its power to regulate interstate commerce.  The individual mandate to buy insurance is needed in order to require insurance companies to write policies with community rating, i.e. risk is spread throughout a large community, and guaranteed issue, i.e. no denial because of medical history or condition.  The states argued that the law’s individual mandate to buy insurance is unconstitutionally forcing people to buy a product, thus creating an insurance market.

Justice Breyer cited a lower court opinion (Sutton) that an earlier precedent setting case, Wickard v. Filburn, effectively allowed the government to force a farmer to buy wheat. Other justices disagreed with this interpretation of the Wickard case. 

The government advocate, Donald Verrilli, made what is its primary point:  health care insurance is simply a financing mechanism for health care services which all but a few will consume at some point in their lives. Since all people are or will be in the market for health care services, the government has the authority to regulate the payment for those services.

Justice Alito asked Verrilli, the government advocate, whether the government could require people to buy burial insurance since everyone will need to be buried or cremated.  Verrilli made the argument that burial expenses do not involve cost shifting the way that paying for health care insurance does.  Justice Alito countered that the government does pick up the expense of burying or cremating someone who cannot pay but Verrilli argued that this comes out of general tax revenues and these costs are miniscule when compared to the unreimbursed costs of health care.  Justice Scalia asked the rhetorical question: why couldn’t Congress just pass a tax to cover the costs of unreimbursed care?  There would be no question of constitutional authority since Congress has the express power to levy such a tax.  Although many liberals disagree with much of Justice Scalia’s opinions, they have asked this same question.

Justice Kennedy noted that the court has an implied presumption that a law is constitutional but that the government has a burden to prove its case when enacting a law that requires an individual to buy something, a requirement that fundamentally changes the relationship between the government and the individual. Kennedy noted that the health care act requires an affirmative action from an individual, i.e. buy insurance.  Under existing tort law, the government can not require an individual to take an action to prevent a blind man from stepping in front of oncoming traffic, despite the grave moral concerns this raises.  The laws of this country delineate a clear boundary around the individual that the government can not cross.  Kennedy is concerned that the court may set a precedent in this case that erodes that boundary.  Often regarded as the swing vote on the court, Kennedy’s remarks show his concerns about the constitutional questions and limits on Congressional power that the law raises.

Mr. Verrilli argued that both sides agree that the government can regulate transactions affecting interstate commerce at the point of sale.  Paul Clement, the states’ advocate, later confirmed his agreement when questioned by Justice Sotomayor:  Yes, the government can regulate commerce at the point of sale.  Verrilli argued that insurance is the way that health care services are paid for at the time of delivery or point of sale; however, no one can buy insurance at the time of delivery since no insurance company will sell someone a policy at that time.  Given this rather unique feature of health care transactions, the government has the authority to ensure that people have insurance in advance of the point of sale.  Further on, I’ll cover Clement’s argument against this contention.

Given the government’s argument, Chief Justice Roberts asked if the government could require people to buy a cell phone so that they could call for emergency services, i.e. police, fire, ambulance and roadside service, which most people will need in their lifetime.  Verrilli argued that, unlike health care, there is no market for emergency services. Justice Breyer argued that the goverment could require someone to buy a cell phone or burial insurance.  As an example, Breyer challenged Paul Clement, the states’ advocate, couldn’t the government require people to get vaccinated to prevent the spread of a disease that would kill 60% or more of the population.  Clement answered that the government could not do so.  This argument between Breyer and Clement reflects the sharply differing interpretations of the General Welfare clause of Article 1.

Justice Kennedy questioned the government’s case that the health insurance market and the health services market are the same market.  The health care act requires people to buy insurance for services that they will never need; i.e. maternity care or pediatric care.  The government advocate, Donald Verrilli, argued that the government has a right to impose minimum coverage provisions as a regulatory detail.

Justice Ginsburg noted that the government’s brief makes the case that the health care market is one where there is direct cost shifting from one market participant to another, thereby constituting an existing market.  Insurance companies and hospitals charge additional to people with insurance to pay for those who have no health insurance.  Verrilli concurred, noting that this direct cost shifting distinguishes the health care market and justifies the government’s regulation of this cost shifting.  Justice Scalia argued that there is an implied cost shifting when someone decides not to buy a car.  To make a profit, car companies have to charge more to compensate for selling fewer cars.  Verrilli argued that, unlike cars, health care will be provided regardless of one’s ability to pay.  Although Scalia failed to make his point directly, he showed a skeptical wariness of  allowing the government to control and expand the definition of what is a market.  If given a wide latitude to define a market, the government could define almost any activity as a market in the future and its authority to regulate that newly defined market.

Justice Sotomayor asked the states’ advocate, Paul Clement, whether the government could enact a “health care responsibility payment” that would be waived on proof of insurance.  Mr. Clement answered that there might be some question whether Congress could do so under its taxing authority.  Such a payment could be construed as a direct tax that would presumably not be a uniform tax and unconstitutional under Article 1.

Justice Breyer argued that Congress has historically created commerce out of nothing, noting the creation of a national bank as a regulation of commerce which did not previously exist.  Breyer cited various court decisions that ruled the growing of wheat or marijuana as activities engaging in commerce and affirming Congress’ authority to regulate such activities under the Commerce clause.  Clement countered that the creation of a national bank was not done so under the Commerce clause, nor did the government require an affirmative action from individuals – that they deposit their money only in the national bank.  Clement returned again to this question of coercion, adding that the government does not require people to buy cars to support the car industry; rather, the government offered incentives such as the Cash for Clunkers program.  The government does not support wheat farmers by requiring everyone to buy so many loaves of wheat.  In short, the government has no authority or precedence for forcing individuals into a market.

In response to challenges by Justice Roberts and Kagan, Clement argued that everyone is not in the health care market; that through this insurance mandate, the government is trying to force everyone into the market. Justice Kagan responded that insurance is a way of funding a market that everyone will participate in during their lifetime. Clement countered that not everyone will use the health care services during the year that they have bought the policy for.  Clement consistently draws the distinction between the health care services market and the health care insurance market, an appeal to the conservative justices who are wary of Congress’ future desires to make connections between markets in order to extend the reach of Congressional authority under the Commerce clause.

Justice Kagan summed up what will lie at the heart of arguments both for and against the constitutionality of this law:  “who’s in commerce and when are they in commerce?” 

January JOLTS

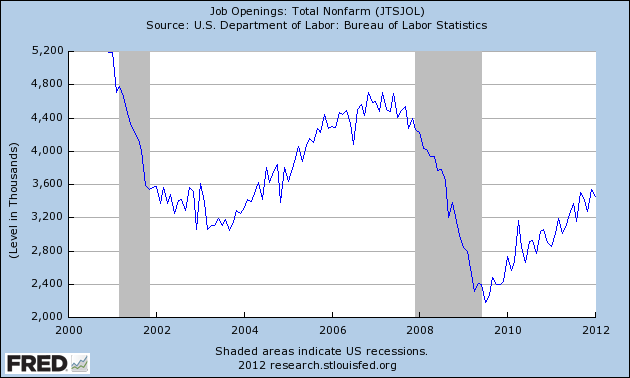
As a followup to my blog on the February jobs report and the job openings for December, here is the job openings report – JOLTS – for January from the Bureau of Labor Statistics:

The number of job openings in January was 3.5 million, unchanged from
December. Although the number of job openings remained
below the 4.3 million openings when the recession began in December
2007, the number of job openings has increased 45 percent since the
end of the recession in June 2009.

These are seasonally adjusted figures. As the graph shows there is steady but stuttering progress.

Federal Debt By President

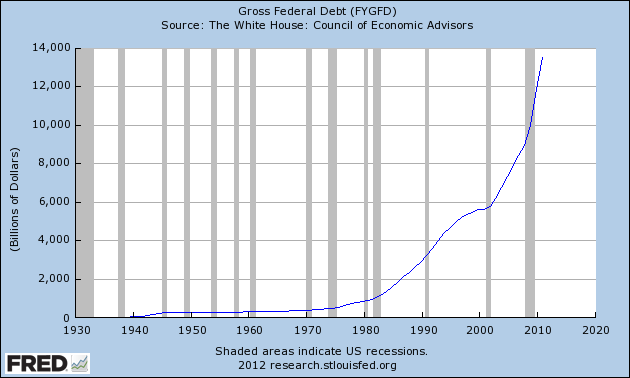
There are several “factoids” running around the internet that Obama has run up more debt than all past presidents combined.  According to the Treasury Dept that claim is not true but the run up in debt has been outstanding since Obama took office in January 2009.  When Bush left office, the total debt was 10 trillion.  It was 15.5 trillion at the end of February 2012.

As the graph below illustrates, we have been borrowing lots of money for the past thirty years.

Then I wondered:  after adjusting for inflation,what is the annual increase in federal debt for each President?  Adjusting for inflation allows us to compare apples to apples.  The Federal Reserve supplies us with both data on the debt and a deflator to adjust current dollars to real 2005 dollars.  Obama’s average is computed up to Dec 2011.

Remember, these are inflation adjusted dollars.  The big spending started with Reagan but both parties have become very practiced at developing good explanations for why we have to spend a lot of money. 

Like many, I have thought that the severe downturn has dramatically reduced federal receipts.  As a percentage of GDP, it has – receipts have been coming in at 15 – 16% of GDP, when the long term average is 18 – 19%.  But … bigger government spending has inflated GDP about 10%. What have receipts been over the past decade?  During the Bush years, the Federal government pulled in an average of 2.13 trillion dollars a year in 2005 real dollars.  During the Obama years, the average is 2.0 trillion.  The drop in receipts has been relatively slight.  80 – 85% of the responsibility for the big run up in the debt is spending.

Last week, Senator McCain acknowledged the true cost of defense spending at $1 trillion and it is defense spending that led the Bush administration to run up a $5 trillion dollar deficit in eight years despite four years of robust growth, fueled largely by a real estate bubble.  The bubble burst and the severe fallout from that debacle has prompted even more defense spending – social support programs to defend Americans against lost jobs, lost health insurance and lost home equity.

“Too much spending!” Republicans cry but do not want to cut back on defense spending or agricultural subsidies in rural areas where their support is strongest.  Income tax subsidies are another form of spending, one highlighted by the Simpson-Bowles commission.  In this broken, contentious political climate, neither side of the political aisle can agree on any meaningful reductions in tax subsidies because the voters who put them there can not agree. 

Since neither side can agree on spending cuts, there is only one other solution – higher revenues.  Yes, that’s the punch line.  Funny, isn’t it?  If neither side can agree on spending cuts, they surely can’t agree on where to get higher revenues.

Bleeding heart Democrats cry out for tax justice for the poor while Republicans stand strong for tax justice for the rich.  The Tax Policy Center can find no studies showing that taxes on the rich influence job creation, either positively or negatively.  To conservatives who believe that they do, facts are unimportant.  Conservatives are like football fans – all you gotta do is believe.

Democrats suffer from the same “fact blindness,” disregarding several studies showing that long term unemployment subsidies undercut the confidence and skills of the unemployed, making them less employable the longer they are out of work.  Car and home buying subsidies of the past few years have done little but push forward the buying of cars and homes.  When the subsidy programs expired, so too did the buying of cars and homes.  Despite the demonstrated ineffectiveness of these social subsidies, Democrats continue to propound that they are for the working person.  Another month and another proposal of yet another program for the “vulnerable.”

The moderates of either party have either been voted out of office or left in frustration.  Olympia Snowe, a Republican Senator from Maine, is the latest to quit the carnival show of Congress.  She wrote, “I do find it frustrating, however, that an atmosphere of polarization and ‘my way or the highway’ ideologies has become pervasive in campaigns and in our governing institutions.”

We can not agree on spending cuts and we have two large spending items looming in the near future which will only exacerbate the debate.  The Boomers are just beginning to collect on their deferred annuity program – we know it as Social Security.  They are one kind of bondholder expecting the government to make good on the promises it has made.  The really big bond leviathan is that world wide group of holders of U.S. debt – over $10 trillion in treasury bonds and notes.   We have benefited from the “flight to safety” over the past few years as investors around the globe have bought U.S. debt at ridiculously low rates.  Investors will want a more normal return for their money eventually and when that happens, the annual interest expense on our debt will rise.  These two groups of bondholders with demands and expectations will light the fuse.

If you think the past decade has been contentious, you ain’t seen nothin’ yet.

The Long Run

Now the really big picture.  Reflecting the severity of the market downturn that began in late 2007, the 4 year average (50 month) of the S&P500 index is getting close to crossing below the 17 year (200 month) average.  Remember, this is years.  In the normal course of affairs, inflation tends to keep the shorter average above the longer average.  The crossing or “nearing” of these two averages reveals just how sick the past decade has been.  The last time the market showed this indicator of prolonged market weakness was in the first half of 1978, after a 43% market drop in the bear market of 1973-74 and a 19% drop in 1977.

In the last 60 years, was the October 2008 market drop of 17% the deepest monthly plunge in equity prices?  No, that honor goes to the almost 22% dive in October 1987.  For a consecutive 3 month drop, 2008 does barely nudge out 1987, both falling 30%.

Although headlines will speak of the downturn in the Fall of 2008 as the worst since the depression, it is important for Boomers to remember that our parents’ generation suffered through some pretty severe market declines as well.  In 1987, most Boomers were in their thirties and probably had relatively few dollars in the stock market.  We may remember “Black Monday”, October 19, 1987, for the headlines but it was not as personal as the 2008 decline because we were decades before retirement and had less at stake.  What particularly distinguishes the two years is that the unemployment rate continued to fall during the 1987 decline.

Young people don’t remember market crashes the way that older people do.  When we are young, we have – like forever – before we are going to be old.  For the echo boomer generation born in the eighties and nineties, also known as the  “millennials”, or Generation Y, the crash of 2008 will be a faint or non-existent memory when they reach their fifties decades from now.  They will probably get to have their own crash – one that they will remember because they will have more at stake.

When we are in our twenties, someone should prepare us.  We are going to work hard and save money.  We are probably going to put some of that hard earned money in the stock market.  Then, when we are in our fifties, sixties or seventies, we are going to flip out when our stock portfolio drops by 40%.  Would we listen to or remember that sage advice?  Probably not.