Labor Report – February

This past Friday, the Bureau of Labor Statistics (BLS) released their monthly assessment of the labor market, reporting a net increase of 227,000 jobs during the month of February.  This marked the third consecutive monthly increase of more than 200,000 jobs, giving many hope that the tepid economic recovery is gaining a firmer foothold.  Consumer spending accounts for more than 2/3 of the economy.  Any improvements in the overall economy are fragile without a strengthening labor market.  Almost 1/2 million people who had previously given up looking for work became available for work again.  This influx of job seekers offset the rise in jobs, causing the unemployment rate to remain unchanged at 8.3%.

The monthly survey of businesses showed job gains in many industries:  Business services, leisure and hospitality, health care, mining and manufacturing. In 2011, government jobs disappeared at the rate of 22,000 per month.  That job attrition has slowed to zero, indicating that the cut backs in government are largely over and will no longer weigh down any growth in the private sector.

The bad news is that there are many critical elements of the jobs report that were unchanged.  The long term unemployed remained about the same at 5.4 million.  The participation rate of the 155 million civilian labor force is a bit less than what it was a year ago but the employment population ratio is slightly above Feb. 2011’s rate.  The average workweek remained unchanged at 34.5 hours.  Involuntary part time workers, those who would like a full time job but can’t find one, remained the same at 8.1 million. 

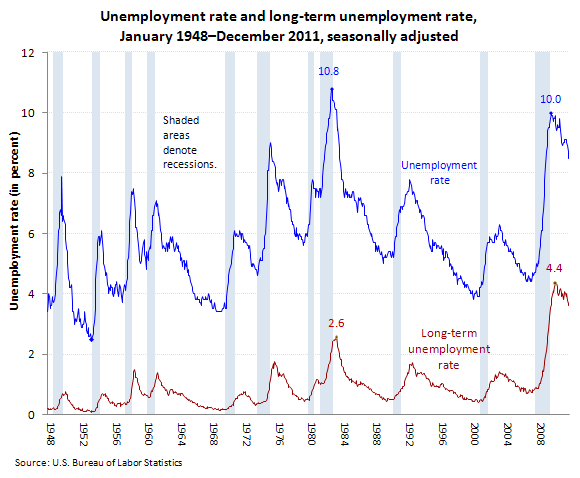
As encouraging as February’s data is, the 5.4 million who have been unemployed for 27 weeks or more is a troubling sign of the underlying weakness of the job market.  Below is a BLS historical comparison of the unemployment rate and the long term unemployment rate.  The 70 year timeline of the graph illustrates the ongoing crisis levels of long term unemployment.
On Monday, March 12th, the BLS will release the monthly JOLTS job openings report for January 2012.  In December, there were 3.4 million seasonally adjusted job openings, an increase of almost 10% from the previous month.  This is better but – always that but – the graph below shows non-seasonally adjusted (NSA) December job openings from the previous ten years to show the improving but still weak number of job openings.

As I have mentioned in past blog posts, there is some concern that the seasonal adjustments that the BLS uses may have some weaknesses due to the severe downturn in the fall of 2008 which affected the winter seasonal adjustments.  The BLS makes one set of seasonal adjustments for the six months from May through October and another set of adjustments for the November through April period.  With advances in statistical modeling that the Census Bureau has introduced over the past 50 years, the BLS has refined their methodology of making seasonal adjustments.  The concern is not with their methodology but with the data itself of late 2008 and early 2009, an “outlier” that was so extreme that it “contaminates” the data set in subsequent years. The BLS incorporates 5 years of data in their projections of seasonal adjustments, so this “hangover” will last into the spring of 2014.  You can read an overview of the adjustment methodology used by the BLS here.  Without seasonal monthly adjustments, January’s job data each year would look dismal, with job losses regularly in the 2.5 to 3 million range, as employers lay off workers who were hired for the Christmas season.

A comparison of the raw numbers for job gains in February of each year do give an indication of labor market momentum.  As the chart below shows, the gains in February have been one of the strongest of the past decade.

But we saw strong gains last year throughout the spring only to see the momentum fade, explaining why the reaction to this month’s gains have been one of “cautious optimism”.  Some attribute the loss of momentum last year to the tsunami, the unrest of the Arab spring and rising gas prices, the ongoing sovereign debt problems in Europe, and the embarrassing budget battle.  But there may be more to it than the events of last year.  I contend that there is a structural weakness in our labor market that makes us more susceptible to the “winds” of current events.

As I have done before, let’s look at the core working population, 25 – 54 years old.  These are non-seasonally adjusted figures for February in each of the past ten years.
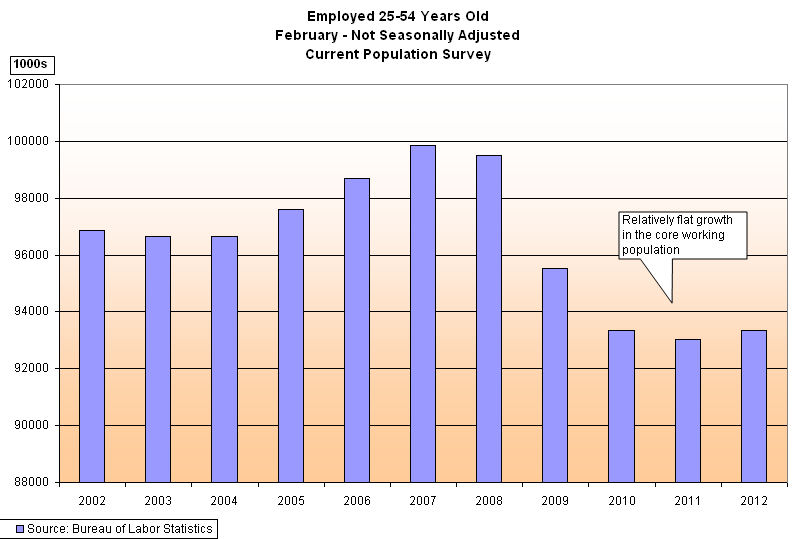
These are the “middlers”, those of us who are buying homes for the first time, raising families, buying appliances and cars and they are the backbone of a consumer economy.  The job growth of this population backbone has been flat and remains at levels below those of the early part of the decade, as this country pulled out of the 2001 – 2003 downturn.

The largest part of the increase in employment have come from those who are older than 54, as shown in the chart below of the larger data set of those 25 and older who are employed. Partially this is due to an aging population – the graying of the Boomers – but it shows a structural weakness in the labor market which undercuts the resilience of the economic recovery.
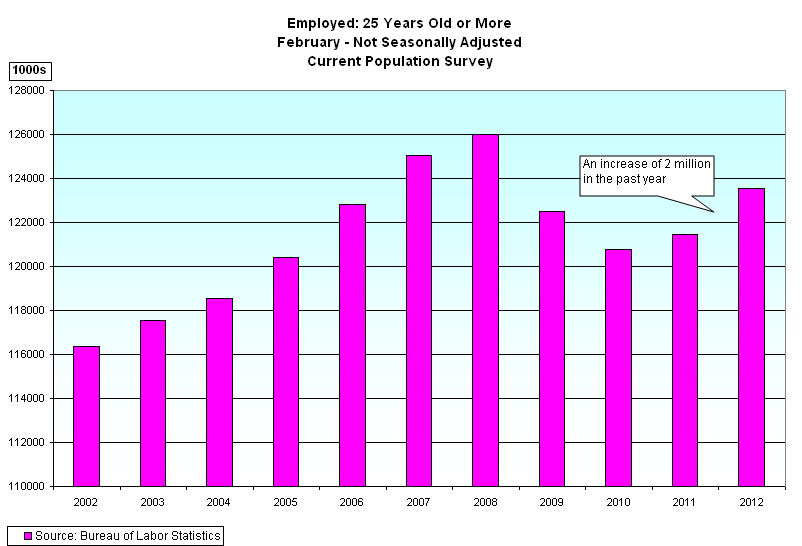
The takeaway is that we are once again seeing improvement but our economy and labor force suffers from a brittleness that the labor data exposes.  Part of that brittleness is due to an aging population; part is due to the continued de-leveraging and slow recovery typical of major financial crises; part is due to political indecision in government which reflects the indecision and disagreement among the voters; part is due to a very “accommodating” (translation: low interest rates) Federal Reserve policy that attempts to distribute financial pain, reward and risk throughout the economy using the few monetary tools that it has.

The stock market is encouraged but stuck. After rising for the past two years, the 200 day moving average of the SP500 has leveled off for the past 6 months, a phenomenon not seen since April to October of 1994.  October 1971 to March 1972 and May through September 1957 saw a similar 6 month plateau.  The Indians in the market are hunched over with their ears to the ground, not certain whether the distant sounds they hear are buffalo or thunderstorms.

Golden Cross

A few weeks ago, I wrote about a long term trading strategy using the 200 day moving average of a popular index, the S&P500, which captures 75% of the corporate activity in the U.S.  As corporate profits of larger companies increasingly come from overseas, the S&P provides some foreign stock exposure as well.  Over the past decade, the strategy worked pretty well, getting out of the market before the 2008 downturn, enabling an investor to pick up shares at a cheaper price in 2009.  That is, after all, the point of adopting any type of trading strategy – sell when shares are expensive, buy them back when they are cheap.

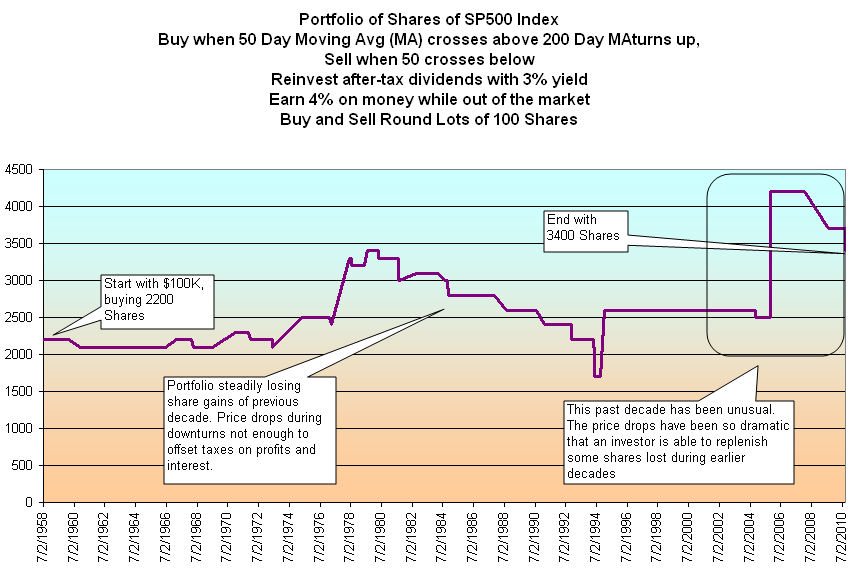
Today, I’ll look at a variation of the 200 day strategy called the “Golden Cross”, which I have mentioned in a few past blogs.  A Golden Cross buy signal occurs when the 50 day moving average crosses above the 200 day moving average.  A sell signal occurs when the 50 day average crosses below the 200 day average. A buy signal just occurred at the end of January. You can chart the S&P index for free at StockCharts.  I will compare this Golden Cross strategy to the buy and hold strategy. 

The Golden Cross strategy investor must overcome two major problems: tax attrition and the return on cash while out of the market.  The first problem is formidable. The IRS takes their pound of flesh out of profits that the trading strategy produces.  The downturn in prices when the strategy is out of the market may not be enough to compensate for the 20% (or more?) tax bite, which reduces the investor’s capital pool when he buys back into the market.  Thus the investor may buy fewer shares on the next buy date, and those fewer shares generate less profits as market prices climb.  The second problem is almost as formidable.  Over the 50 years that I will explore, the investor would be out of the market about a third of the time.  The interest rate one earns on one’s capital while out of the market is an important factor in total returns.

Here are the assumptions of the study:

20% Effective Tax Rate – capital gains taxes are “taken out” at the time of the sale.

3% Average Dividend Yield (see here for historic dividend yields)- dividends are recorded and taxes paid for those dividends for both strategies at buy and hold dates.  While not entirely accurate, it largely accounts for the value of dividends to a portfolio.

Interest – 4% on cash while out of the market.

Reinvest – For the conservative buy and hold strategy, the investor pays taxes on the dividends received and puts the money in some cash equivalent fund earning the stipulated interest.  The Golden Cross strategy accumulates and reinvests the dividends at the next stock purchase date. (Click to enlarge in separate tab)

The market downturn during the 70s was severe enough that the Golden Cross investor could book profits, pay taxes and buy back more shares than he had before.  In the early 80s, the downturns were not significant enough to overcome tax attrition.  Had we ended this exploration in the year 2000, this strategy would have done poorly when compared to a buy and hold strategy, even after accounting for the deferred taxes owed by the buy and hold investor.  During the two severe bear markets of the 2000s, the Golden Cross strategy shined, exceeding the returns of the buy and hold strategy.

The lesson is that the downturn must be strong enough that the Golden Cross strategy can overcome the tax attrition by buying shares back at greatly reduced prices.  Although the Golden Cross strategy produced only 5 losses out of 27 round trip (buy/sell) trades, a winning percentage of about 80%, the tax obstacle is a formidable barrier to increased profits over buy and hold.  The buy and hold strategy is about 25% invested in cash at the end of this study, a conservative approach consistent with a buy and hold investor.  If the buy and hold investor were to periodically reinvest dividends instead of holding cash, it would probably equal the after tax returns of the Golden Cross strategy.

The Golden Cross strategy is much more dependent on finding a good return on cash when the investor is out of the market.  In these times, that is not an easy task.  As a retirement strategy, it might be wise to choose a combination of the Golden Cross and buy and hold.  A buy and hold investor in or approaching retirement would assess their income needs for the next 3 – 5 years and sell just enough shares to fill the cash account when a Golden Cross sell signal arrives.  During their working years, a buy and hold investor would add shares when a Golden Cross buy signal arrived.

The Core Work Force

The Bureau of Labor Statistics (BLS) released their monthly Employment Summary this past Friday and the market cheered, the Dow jumping up 100 or so at the open.  The Sunday talk shows have been abuzz about the report, which showed a January gain of 243,000 jobs.  After 5 months of increasing job gains, how improved are Obama’s chances of re-election?  Does the improving job picture cause the Republican Presidential contenders to change course a bit?  Wanting not to appear as though they are rooting against the American economy, do the contenders aim at specific policies of Obama in the coming months?  With the S&P500 index at 1344, some market pundits are whispering the 1500 mark that the S&P could take a run at this year.  Holy moly, macanoli, what a buzz about one labor report!

The labor report is only part of the picture puzzle that shows an improving economy.  The ISM manufacturing report was slightly below expectations but still growing.  Two key components of the index, new orders and backlogs, showed a robust increase, hinting at continuing improvement in the coming months.  The recent durable goods report shows that businesses are building inventories, a sign that expectations are improving.   Retail sales tapered off in December, but Personal Income was slightly above expectations, growing .5% over November.  Caterpillar, the large equipment maker, is looking forward to revenue and profit increases in 2012, reducing earlier concerns of a global recession.  A recent report indicates that the ongoing contraction in China’s manufacturing has slowed and is close to the neutral mark between contraction and growth. 

So, what’s not to like?

Looking past the monthly headline numbers of job growth, let’s look at this country’s core work force, men and women aged 25-54.  The BLS just made several census adjustments which resulted in upward revisions to seasonally adjusted job growth from April to December.  Instead of looking at seasonally adjusted numbers, I’ll take a look at the raw numbers from the BLS employment report for January and compare them to BLS January data for the past ten years.

A unseasonably warm winter throughout much of the U.S. gave a boost to construction jobs in the office building and multi-family residential construction.  Although the construction industry is still far below 2007 levels, that boost shows up in a comparison of employed men aged 25 – 54 from last January to this January. (Click to enlarge in separate tab)

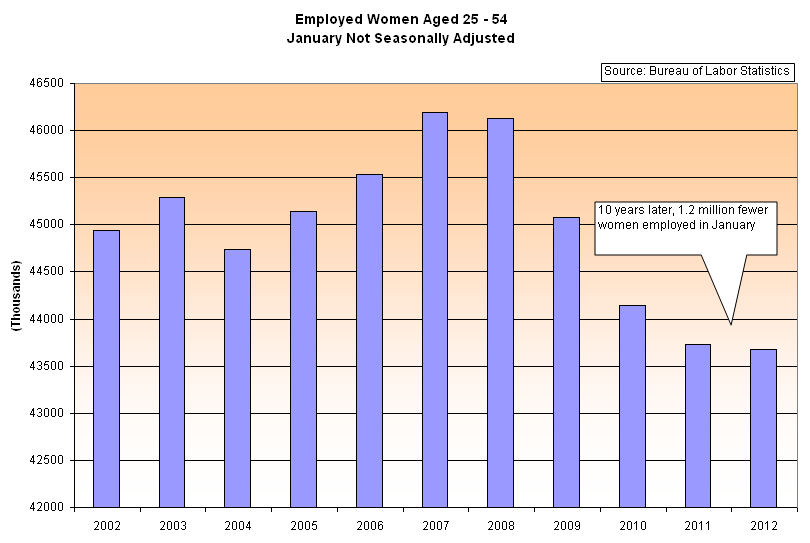
The ongoing attrition in government jobs, which disproportionately employs women, has slowed but is still evident in comparisons with past Januaries.

This rather tepid growth, or lack of it, in our core work force is troubling.  This age demographic forms the backbone of a healthy economy, raising children, buying furniture and homes, saving for retirement and their kid’s college. Any job growth is good, but when I see a better improvement in the employment numbers for this group, I will know that we are building a resilient economy, one that can withstand some shocks.  We know of some possible shocks – the probable default of Greece, the ongoing recession in Europe and the possibility of some armed conflict with Iran, to name but three.  The shocks we don’t forsee are what can push our economy off balance.  Last year was a reminder of the impact of unforeseen shocks.  The tsunami  in Japan and the flooding in Thailand not only devastated those countries and their people but impacted supply chains in Asia and consequently sent after shocks throughout the world.

Recently fashionable has been talk of a decoupling of the U.S. and emerging countries’ economies from the sovereign debt and financial troubles in Europe.  If recent history has taught us nothing, it is that much of the world is joined together by interdependent webs of financial conglomerates and the monetary policies of nation states, by the tension between global consumer demand and multi-national supply chains to meet that demand.

200 Day Nudges Higher

The market is a reflection of hope and fear, of world events that affect each of us, our jobs, our families, our schools, churches and neighborhoods.  The 200 day moving average moves through the minute gyrations of the daily market like a great leviathan, changing its course only gradually.  If you are a Star Wars fan, think of the 200 day as The Force.

For the long term investor, it is wise to buy or sell as this average changes direction.  When we compare a month’s (21 trading days) average of the 200 day to the previous month’s average, we can see these changes in direction.  At the onset of the recession in 1990, the S&P 500 index dropped about 17%.  The recession was fairly short but it was a jobless recovery.  From the October 1990 trough to the end of 1993, the index climbed 60%, then paused and stumbled.

Almost 3 years after the recession had officially ended in March 1991, the unemployment rate was still a lofty 6.5%.

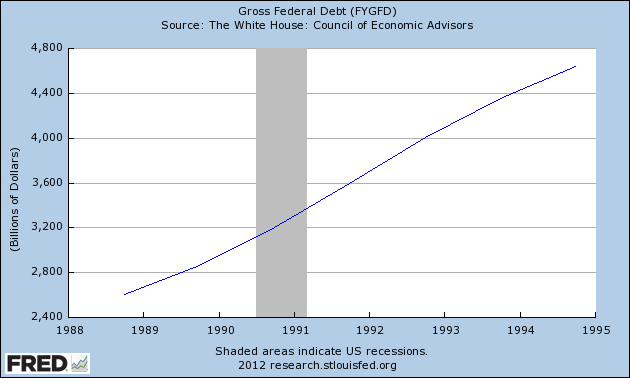
Due in part to the jobless recovery, the federal debt had risen 50% in the four years of 1990 through the end of 1993 and would continue it’s relentless march upwards for several more years.


In 1994, the 200 day average waggled in indecision, barely moving during that summer before nudging upwards in August, then falling again in November, before making its decisive move upwards in 1995.  In six years, the index would more than double.  When the 200 day began to roll over in the fall of 2000, the wise long term investor listened to that slow heartbeat and headed for the exits.  In the middle of May 2003, the 200 day began another 4-1/2 year climb up before rolling over in Jan. 2008.  18 months later, the 200 day began yet another climb after the steep descent of the financial crisis of 2008.  Just this past September, the 200 day signaled exit after a tumultuous summer and before continuing unrest in the fall.

A person investing in the S&P500 index who turned when the 200 day average turned would have made 460%, including dividends, on their money since 1994, 81% in the past ten years and that doesn’t include money that could be made in interest while their money sat safely outside of the market mayhem. 

In the last quarter of 2011, the 200 day moving average had been slightly declining but largely flatlining – unchanged – since the beginning of August. A week ago, it nudged higher.  Will this be like the nudge higher in August 1994 that may reverse in a month or two?  Could be. Although the signals of the 200 day average are relatively few, a prudent investor would monitor the situation every week in case this is a “waggle” and not the beginning of a move up.

Corporate Taxes

Both conservative and “mainstream” media pundits, as well as candidates In the Republican primary debates, assert that U.S. corporations pay a 35% federal income tax rate, “one of the highest in the world.”  After the corporation pays this tax, it distributes dividends to its shareholders, who then pay tax on the dividend.  Capital gains and dividends are taxed at a lower 15% rate, resulting in a net tax of 50% federal tax on corporate profits.  In arguing for lower corporate tax rates and rationalizing the lower rate on dividends, conservatives ask should the federal government get half of corporate profits?

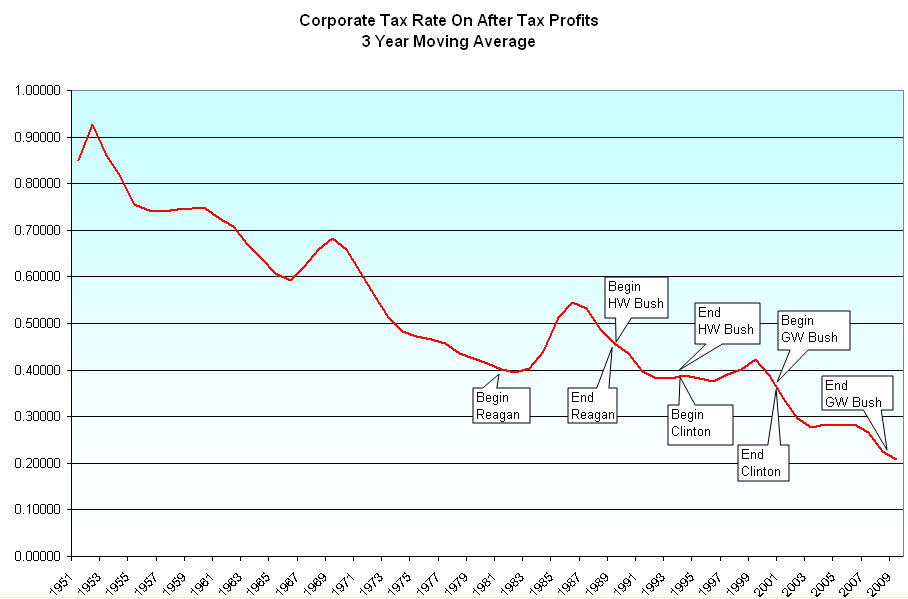
The federal government may get too much of profits but it is not 50%.  The international accounting firm PricewaterhouseCoopers calculated an effective tax rate of 27% in the years 2006 – 2009.  Sixty years of data from the Bureau of Economic Analysis show that the corporate tax rate has declined markedly since World War 2. (Click to enlarge in separate tab)

Using a three moving average highlights the downward trend.  For those in the Ronald Reagan cult, it may come as some surprise to see the “hump” in rates during the Reagan years.

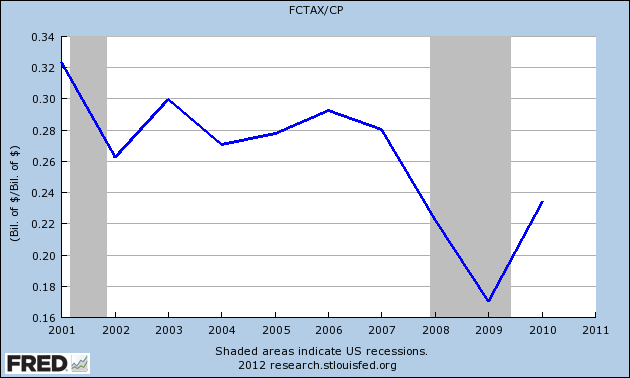
Zooming in on the past ten years, we see an effective tax rate of 30% or less.  Some might explain that the lower average rate is due to smaller corporations who pay less than the 35% tax but IRS data shows that smaller companies who qualify for these lower rates make up less than 10% of corporate profits.

If companies had paid a 35% rate on their profits this past decade, what would they have paid?  Almost a trillion dollars extra in taxes.

When someone mentions the “35% corporate tax rate”, that is the statuatory rate, not the actual rate companies pay.   In 2009, the three year moving average rate had dropped to 21%.  That is a far cry from 35%.  We can have a discussion – or disagreement – about what a fair tax rate is for U.S. companies.  We should at least start that discussion from some realistic data.

Obama Care and Republican Debates

In all the Republican debates, the Presidential candidates vow to repeal the Patient Protection and Affordable Care Act, or Obama Care, pointing specifically to the provision of the bill which mandates that people have health insurance or pay a fine.  Not once can I remember any candidate advocating the repeal of the 1986 Emergency Medical Treatment and Active Labor Act (EMTALA) which mandated that hospitals provide emergency care to anyone regardless of citizenship, their legal status or their ability to pay.  Twenty-five years ago, this law was passed by a Democratic House, a Republican Senate and signed by a Republican President, Ronald Reagan.  The law dictates but provides no funding for its mandate.  Obama Care finally provides a mechanism to fund the 1986 law – a “put up or shut up” provision that a lot of people don’t like.  If Republicans are truly against federal mandates, are truly for more state autonomy, why are they not calling for EMTALA’s repeal?  Although I have not heard Ron Paul recommend repeal of the 1986 law specifically, he has consistently voiced his opinion that the federal government should get out of the medical care business. 

The health care debate is part of a larger issue.  Are we as a people prepared to put up or shut up?  Should hospitals be forced to treat patients?  If so, how to pay for it?  Should Congress be allowed to pass these unfunded mandates?

“Repeal and replace” is an argument I have heard frequently.  Replace with what?  Last March, Bloomberg analyzed various Republican proposals to replace Obama Care and found that it was mostly hot air, saving far less money than the lofty claims.  Again, I ask – are we going to put up or shut up?  Is Ron Paul the only Republican candidate who shows a consistent adherence to principle?  Have we become a nation of people who elect only those politicians who tell us that it really is possible to have our cake and eat it too?  

Recession and the Presidency

On Tuesday, President Obama will give his annual State of the Union address to Congress and the nation.  This past Saturday, South Carolina chose Newt Gingrich, the former Speaker of the House, as the front runner in their Republican primary.  In three grassroots states, Iowa, New Hampshire and South Carolina, primary voters have chosen three different Republican contenders who are vying for the Chief Executive Office.

For the past 150 years, every President except Lyndon Johnson, Jack Kennedy and Bill Clinton has had to contend with recession during their tenure. (NBER Source)  Every Presidential contender promises that they are going to stop the vicious business cycle that inevitably leads to recession.  With the advent of “JIT” – Just In Time Inventory – increasingly adopted by businesses and their suppliers in the mid to late 90s, recessions were pronounced a thing of the past.  No more would there be an excess build of supply by the nation’s businesses, leading to a sagging economy when product demand inevitably fell.  Advances and investments in technology enabled businesses to respond quickly to fluctuations in demand.  As the milennium approached, it was truly the dawning of a new age.

What was dawning was the advent of a secular bear market, a long period of time when the market falls for a few years, struggles up again, then falls, then rises again as fear and hope compete against one another.

A few weeks ago, I noted that in the middle of 2011, we had finally come out of an almost four year  recession.  This was not the official National Bureau of Economic Research end of the recession.  That happened in the middle of 2009.  This mid-2011 recession end was the “How It Feels” variety as real GDP finally gets back and surpasses the level it was at before GDP started its decline.

Below is a graph comparing the official lengths of recession and the “how it feels” recession length and a comparison of the two during each President’s tenure in the past sixty years.  This comparison helps explain the mood of the country when Presidents Ford, Carter and HW Bush lost re-election bids (Ford was actually not up for re-election since he had taken over the Presidency when Nixon resigned in August 1974).  The chart also gives an insight into the success of re-election bids by Eisenhower, Nixon, Reagan, and GW Bush. The economic pain was either less than or about equal to the official figures of economic distress during their presidencies.

As he prepares for his third State of the Union address, the lesson for President Obama is stark.  History unfortunately repeats itself.  It is also a lesson for any Republican Presidential hopeful; the odds are that he will have to contend with a recession during his tenure if he wins election.  On the campaign trail, how many Presidential hopefuls of either party ever broach the subject of what their administration will do during the eventual recession while they are in office?  Better to promise that it won’t happen on their watch.  It will.

Savings Crisis

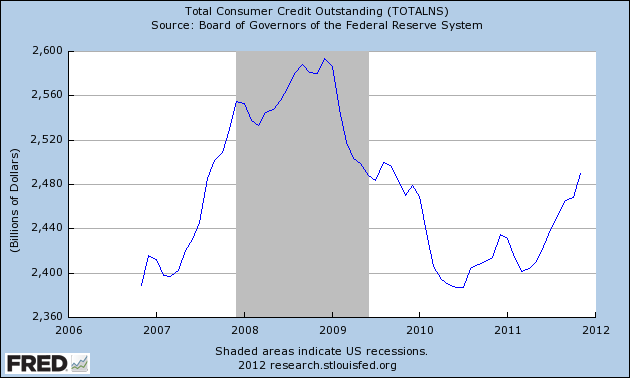
Last week the Commerce Dept reported that consumer credit had grown in November at an annualized rate of 10%. 

The growth consisted mostly of car and truck sales, which shows increasing confidence and pent up demand.

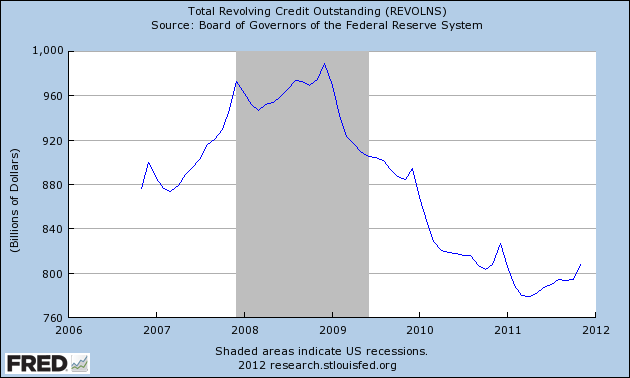
Below is a chart of revolving credit outstanding which excludes auto sales.  As we can see, the American consumer is still struggling.

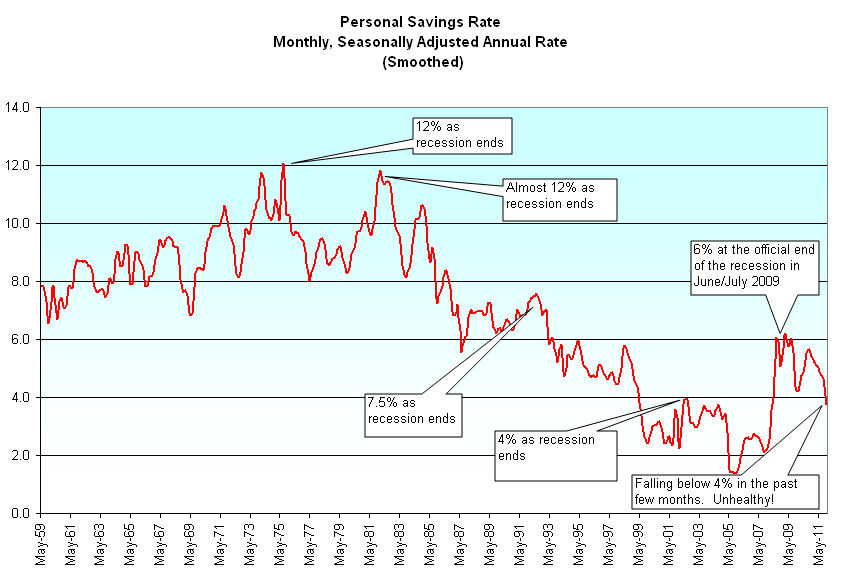
Taking a longer perspective, let’s look at the personal savings rate for the past 50 years.  The savings rate is calculated by subtracting all personal consumption expenses, including interest, from disposable personal income (gross income less taxes).

The savings rate shows the underlying resilience – or lack of it – of the average American household.  Savings helps fuel investment in companies, investment in local, state and federal government bonds.  As our savings fall, we become ever more reliant on foreign money to fuel this country’s debt and growth.

Tidbits

It’s the beginning of the year and I am cleaning up – not the house, but my notes – scribbles of factoids which I, and maybe you will as well, find interesting.  Those of you who like graphs will be disappointed this week.  😦

In 2009, 55% of income in the S&P500 companies was generated overseas.

The Eurozone is set up very similar to the Senate in the U.S.  Despite being 30% of the Euro economy, Germany only has one vote. 

It will cost an estimated $175B for the payroll tax cut in 2012.

A rule of thumb that the Congressional Budget Office (CBO) uses – 1/10% of GDP growth over 10 years = $300B in revenues over 10 years to the Federal Government.

One of the problems with the federal mortgage agencies FHA, Freddie Mac and Fannie Mae is that they buy mortgages which originate in states where there is little or no regulation.  If people want a government agency buying mortgages, why don’t the various states institute such agencies?

A CNN article about doctors going broke:
http://money.cnn.com/2012/01/05/smallbusiness/doctors_broke/index.htm?iid=Popular

This year, 2011, the USDA estimates that for the first time, this country will produce more corn for fuel than for food.

In 2009, total lending by U.S. banks fell 7.4%, the steepest drop since 1942. As of March 15, 2010, approximately half of Obama’s $787 billion stimulus program had been distributed but the flow of federal money into the economy could not keep up with the $700 billion that banks pulled out of the economy in the 6 months from mid-September 2008 to mid-March 2009.

Small companies, those with fewer than 100 employees, accounted for 45% of net jobs created from 1992 through the end of 2007, according to Labor Dept data.

In the U.S., diabetes costs about $174 billion annually in medical costs and lost production In the U.S., according to the American Heart Association.  That is a little more than a 1% impact in a $15 trillion economy, or about 25% of the defense budget.

This past week, Standard and Poors downgraded the credit ratings of nine countries in the Eurozone.  In assessing sovereign credit, Moody’s, another leading credit ratings firm, uses a metric called “debt reversibility margin.”  This measures a government’s ability and willingness to get their debt level under control over the next five to seven years.  Generally, it is the ratio of interest payments on a country’s debt to their revenues with a “benefit of the doubt” margin of 1 – 4% based on the resilience of the country’s economy, its politics and tax policies  When this metric rises above 10%, Moody’s considers a downgrade to the country’s credit rating. 

In 2008 New York spent $16K per student, top in the nation.  It’s student-teacher ratio of 13.1 was the eighth lowest among the 50 states.  From 2000 to 2009, the state added 15,000 teachers as student enrollment fell by 121,000 students.

Global warming is the latest in a series of hoaxes on the American people.  Earlier scams include: smoking can kill you, lead in gasoline and paint is bad for children’s brains, chemical discharges in rivers and lakes are bad for your health, cholesterol is bad for your heart, smog is bad for your lungs, and acid rain is bad for trees and plants. In my lifetime, all of the above have been dismissed by critics at some point as scams on the American public.

In 2010, a USA Today analysis of data from the federal Office of Personnel Management showed that a federal worker makes 77% more than a private sector worker when benefits are included.

In 2010, the Boston Consulting Group issued its Global Wealth Report which found that the top 0.5% of households (those with $5 million or more) owned 21%, or $23 trillion, of global wealth, up from 19%.

A Goldman Sachs analysis of mortgage refinancing found that homeowners took out $358 billion in home equity loans in 2005, the most of any year.

J.P. Morgan Chase and two other banks now hold more than 33% of all U.S. deposits.

Based on 2007 data, the Energy Information Administration reported the various U.S. government subsidies per megawatt hour for the different sources for generating electric power.  Coal got $.44, natural gas received $.25, nuclear enery $1.59 and the whoppers were solar at $24.34 and wind at $23.37 per MWH.  Over the course of a year, at an average consumption of 10,000 KWH per year, a 100 homes will consume a MWH.  In 2010, Google used the equivalent of 260 million homes of electricity.

When enacted in 1916, the income tax affected only the top 2% of incomes.  With the popularity of beards and other creative facial hair statements among younger men, it might be time to resurrect an old Russian revenue raiser – a beard tax.

New York bills Medicaid about $2 million per year for each mentally disabled patient.  The governor is reviewing the state’s billing procedures.

How much do all the tax breaks – or tax expenditures – cost the federal government?  Health Insurance premiums not taxed – $659 billion, mortgage interest deduction – $484 billion, capital gains and dividends taxed at lower rates – $403 billion, pensions – $303 billion, earned income tax credit – $269 billion, charitable donations – $241 billion, state tax deductions – $237 billion, 401K plans – $212 billion, capital gains basis adjustment at death – $194 billion, social security benefits not taxed – $173 billion.  The total is over $3 trillion, or almost the entire federal budget.  If tax breaks were eliminated, the federal debt would be gone in 5 years.

Jobs Report – December

Last Friday, the Bureau of Labor Statistics (BLS) reported that 200,000 jobs were created in December, 412,000 jobs in this last quarter of 2011. A look at the full report and the data behind it raises suspicions.  Why are jobs being rounded off to the nearest 100,000 this past quarter?  We understand that there will be revisions to the data in the months ahead but this gives the impression that there has been a change in the accuracy of the data in the past quarter.

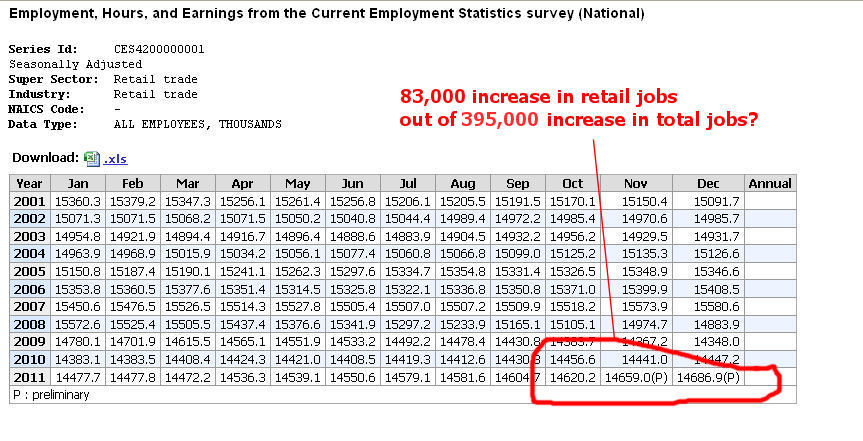
Getting out our data picks, let’s dig down and look at seasonally adjusted retail employment shown on the report.

83,000 retail jobs created in the past quarter.  At first glance that looks like a healthy increase.  So I dropped the above data into a spreadsheet and found that not only is it a healthy increase in retail jobs, it is the best in more than a decade!

Did stores go wild with hiring this holiday season in anticipation of a robust consumer response? This past Thursday, chain stores reported that sales for November and December combined rose 3.3% but this was below 2010’s 3.8% growth. Next Friday we will get the full retail sales report, but indications are that this was not a robust holiday season.

How reliable are the data and the seasonal adjustments that the BLS makes to the data in this area?  I suspect that the BLS is not properly accounting for the holiday surge of hiring for online buying, which increased 15% this year to $35 billion (Source).  BLS methodology is accustomed to dealing with the 4th quarter hiring surge at brick and mortar retail stores but have they changed their methodology to adjust for the relatively new proportion of online sales and the hiring surge needed to meet the holiday demand?

In the months ahead, we may be in for some substantial revisions or surprises in the jobs data.