March 29, 2026
By Stephen Stofka
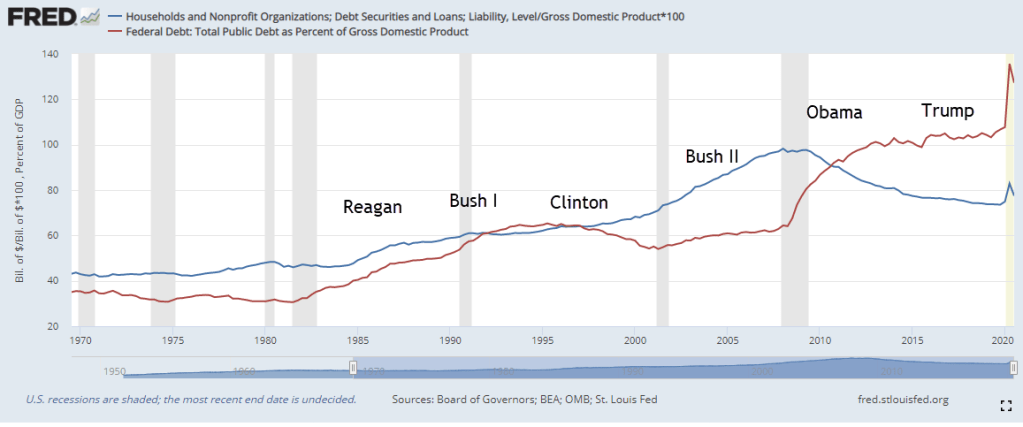
This year we celebrate the 250th anniversary of the Declaration of Independence. This year we mark, not celebrate, the 25th year of America At War. In those 25 years, we have sextupled the nation’s public debt from $6 trillion to $38 trillion to pay for our forever wars. Trump got elected a second time on the promise of keeping America out of foreign wars. He forgot to check with his puppet masters, Israel’s Prime Minister Benjamin Netanyahu and the Israel lobby in America, before making that promise. That promise of putting America’s interests first swayed many marginal voters to cast a vote for Trump in 2024. Many must feel like gullible Charlie Brown, who never succeeded in kicking the football because Lucy kept yanking the ball away (Source).
Carl von Clausewitz (1780 – 1831) was a Prussian officer and military theorist who stated that “War is merely the continuation of policy with other means” (Source). The two primary negotiators for the U.S. are the President’s son-in-law, Jared Kushner, and his close friend Steve Witkoff. Neither of them have any experience in international relations. Both men are pro-Israel and are likely to favor Israel’s economic and strategic interests in any negotiations with Iran. In 2024, Kushner advocated a policy of moving the Palestinians to the Negev desert and developing the Gaza strip as waterfront property (Source). In 2025, Witkoff stated that he was working collectively with Netanyahu for the reconstruction of Gaza (Source). Netanyahu has said that Israel will take control of all of Gaza (Source). Clearly, both Kushner and Witner are negotiating for the best interests of Israel, not the U.S. Neither Kushner or Witner see little daylight between the interests of the U.S. and Israel.
Both the Israel lobby in America and the Christian Zionists believe in the restoration of the ancient kingdom of Israel as part of God’s plan. Some Evangelicals believe that this restoration will precede the Second Coming of Christ. This system of beliefs has been called Dispensationalism and includes the belief that the Bible should be taken literally and historically, that salvation only comes through Christ and that God has a plan for mankind that includes the restoration of the land of Israel (Source). Billionaire Miriam Adelson is a strong supporter of Israel’s interests, owns the Israeli newspaper Israel Hayom, and is aligned with Christian Zionists. She contributed over a $100 million to President Trump’s 2024 campaign and has been lauded by Israel’s Knesset (Source). In their 2010 Citizens United decision, the Supreme Court ruled that money is speech and constitutionally protected under the First Amendment. The elite can shape our domestic and foreign policy as they wish.
This year we also celebrate the 250th anniversary of the publication of Adam Smith’s Wealth of Nations. Smith is the most cited author in economics literature, according to Avner Offer and Gabriel Söderberg, authors of The nobel factor: The prize in economics, social democracy, and the market turn. Writing in an age of hard currencies like gold and silver, Smith observed that countries fund their wars by printing paper money instead of raising taxes. He suggested that having to raise taxes to pay for war would result in fewer wars. Unfortunately, it is the elite, the “princes,” as Smith called them, who push nations into war and the elite don’t want to pay higher taxes. Instead of paying taxes that would enhance the common welfare, they spend their money on political contributions to benefit the political elite and shape policy to their liking.
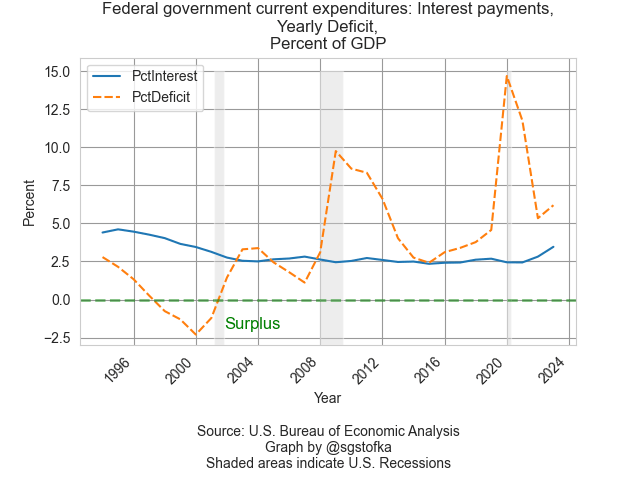
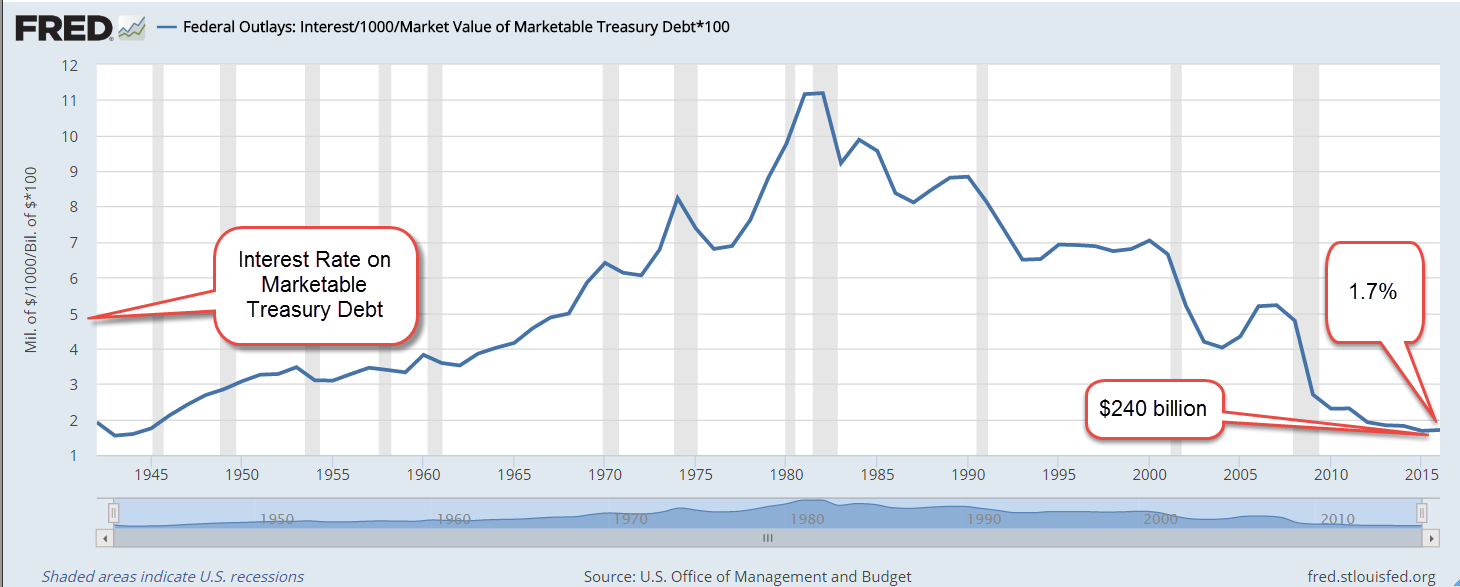
The U.S. has issued more and more debt to pay for the never ending wars. The global elite have bought that debt, trusting that the U.S. can always borrow more to pay its existing debt and the interest on that debt. Since the financial crisis in 2009, the ratio of federal tax receipts to its outstanding public debt has remained low, at 10% (Source). As economist Herb Stein said, “If something cannot go on forever, it will stop” (Source). Trump’s erratic behavior, his past personal bankruptcies and his distaste for rules may cause investors to grow cautious and lighten their exposure to U.S. debt. It is no longer a risk-free instrument because Trump could, at any time, announce on his Truth Social platform that he is temporarily suspending interest payments on U.S. debt. Who will stop him? Not a paralyzed and fearful Republican majority in Congress. Not his servile cabinet members.
Despite Trump’s loyalty to his son-in-law and his friend, he wants an off-ramp from this conflict, an exit that allows him to save face. Netanyahu oversold him on the likelihood of a “shock and awe” strike that would result in a quick war. Instead, this is turning into a war of attrition that advantages Iran. After Friday’s losses on the stock market, the SP500 is now in correction territory, 10% from it’s all time highs a few months ago. Trump pays attention to the market. Will we see some positive steps to a resolution in the next week? I hope to see you next week.
///////////////////
Photo by Michał Parzuchowski on Unsplash