Long-Term Inflation Trends

December 12, 2021

by Stephen Stofka

This past week the government’s estimate of inflation in November was a whopping 6.9% increase over last year’s prices. A comparison to November 2019 prices shows an annual increase of 4.1%. From June through September of this year, the year-over-year increase in prices flattened out at 5.4%. This plateau supported the view that higher inflation readings were a temporary effect. With the availability of vaccines, Americans were resuming their lives. Supply bottlenecks at western ports were contributing to higher demand. Since September inflation has steadily increased. That wasn’t in the script.

Each month the Bureau of Labor Statistics (BLS) surveys thousands of establishments and records the prices of many goods to compute the inflation estimate. We don’t need to know the mechanics of constructing a price index to get a sense of personal inflation. Many of us conduct a smaller survey of our friends, family and fellow workers. Our basket of goods contains a few important items like food, fuel, utilities and other housing costs. From that we build an inflation base that anchors our expectations of future price changes – until it doesn’t.

If there are a series of surprises to our expectations, we modify our individual behavior in anticipation of further surprises. That behavior can aggravate inflationary pressures so that we contribute to the very condition we anticipate. In its setting of interest rates, the Federal Reserve is mindful of this effect and earlier this year two economists at the Kansas City Fed worried that inflation expectations were anchored too low (Bundick & Smith, 2021). Fed policy and a decade of low inflation had lulled people into expecting minimum disruptions in price. People might have strong reactions to price changes, small or large.

Our base of inflationary expectations is formed over several years. In the chart below is the 5 year average of annual inflation in the Consumer Price Index, the most popular measure of price change.

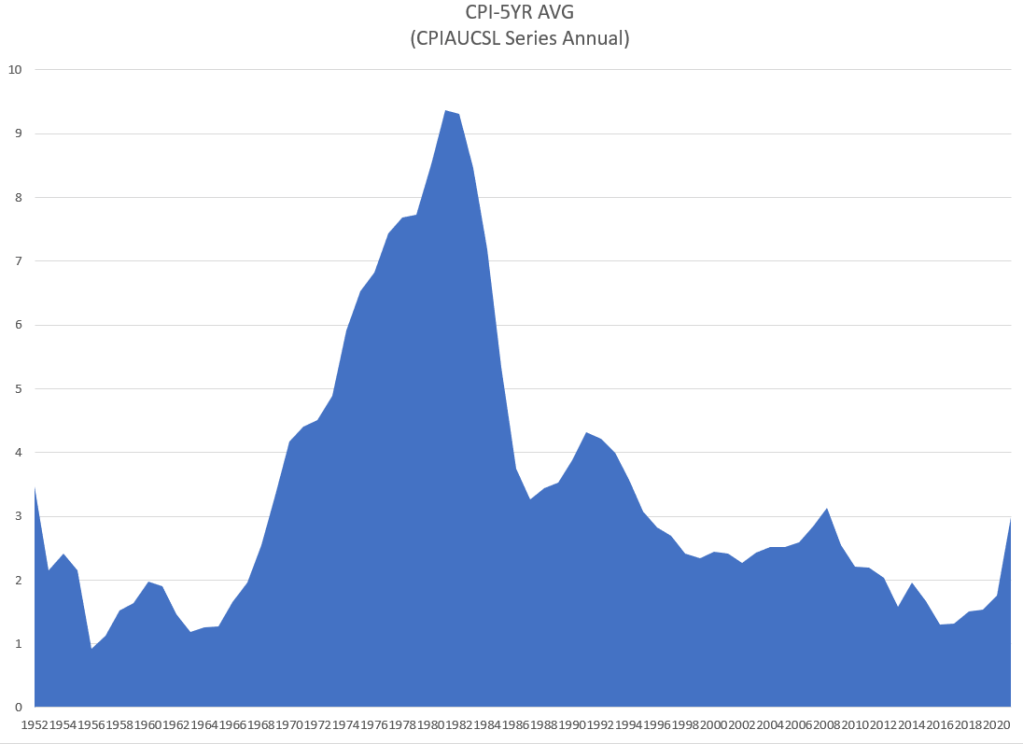
The mountain of inflation during the 1970s has provoked much thought by economists and policy analysts. One hundred years after World War 1, historians continue to debate the causes of that war. In 2070, economists will debate the causes and effects of that inflation mountain. The peak of the 5-year mountain shown above was more than 9% but the annual rate in 1980 was 14%. Still, our big brains make us very adaptable. It is the surprises to those long-term trends that catch our attention.

In the chart below are two 18-year periods, from 1967-1985 when we climbed the inflation mountain, and the most recent period when we have become used to sluggish growth and declining inflation expectations. The earlier period is in orange, the recent period in blue. The year labels are the most recent period. 2003 and 1967 are Year 1 in the series.

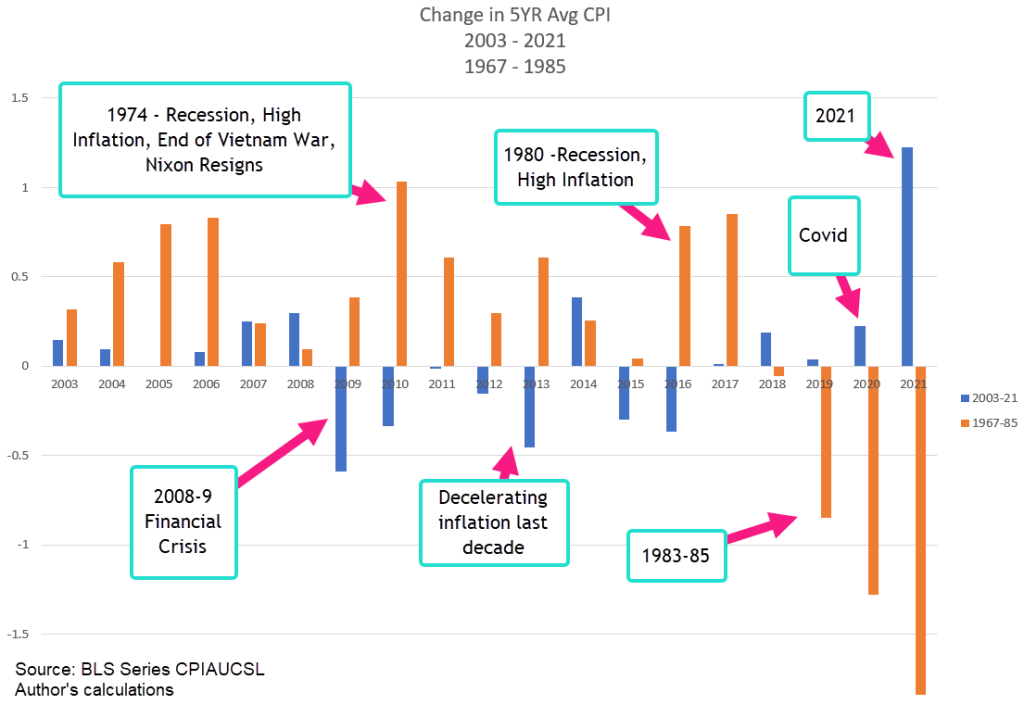
 The graph illustrates the stark difference between the 1970s (orange bars) and the most recent two decades (blue bars). Between 2003 and 2020, Americans came to expect only minor change in the long-term inflation trend. The 2021 blue bar on the right is greater than the highest change post-war inflation which occurred in 1974. It’s even more dramatic because we have become accustomed to slight changes in many prices.

The discourse in this country was already aggravated and people are quick to take offense. Social media is built on people gaining attention by alerting others to offensive remarks or behavior. Politicians try to calm the narrative but inflation surprises disrupt the political conversation. Each person responds to their personal sense of inflation and whatever media voice, mainstream and radical, they prefer. Inflation surprises get people’s attention and the media’s business model is built on that attention. Even as inflation decelerates, the nightly news will continue to feature stories that heighten people’s inflation worries because worried people pay attention.

The political waters have been turbulent this past decade but price changes have been exceptionally placid. Like a rock thrown in calm waters, big surprises make big waves that take some time to dissipate. The task of the Federal Reserve’s rate setting policy is to dampen those waves – a series of small rate increases – without sending the economy into a recession.

/////////////////

Photo by Daniel Vogel on Unsplash

Bundick, B. & Smith, A. (2021). “Did the Federal Reserve Anchor Inflation Expectations Too Low?” Economic Review, Federal Reserve Bank of Kansas City. Available from https://www.kansascityfed.org/research/economic-review/did-the-federal-reserve-anchor-inflation-expectations-too-low/

The Womb Tax

December 5, 2021

by Stephen Stofka

This week the Supreme Court heard oral arguments (Oyez, 2021) in a case called Dobbs v. Jackson that involves a Mississippi law banning abortions after 15 weeks. Current practice is about 24 weeks, the point of viability when current medical technology can keep a fetus alive outside the womb. Two Constitutional lawyers discuss the issues on the National Constitution Center’s podcast We the People (2021). Also this week I was reading about an 18th century British property tax that was based on the number of windows in a home. The more windows the higher the tax. What similarities does the Mississippi law have with a tax?

In 1696, King William III enacted a progressive property tax. Poor people usually lived in homes with fewer windows so the tax was based on the number of windows. There was no tax on a house with up to 9 windows. In the 1750s, the tax on the 10th window was $7.47 per window for all the windows, $75 in current dollars (The National Archives, 2021). In the 1770s, Adam Smith (2009) noted that this was the approximate weekly wage for a mason. A house with 15 windows or more was charged $11.22 for each window so that the marginal increase in tax for the 15th window was $63.72. What did people do? They boarded up some of their windows to avoid some or all of the tax. In an age with indoor fires for cooking and heating, this reduced the flow of fresh air in a home and led to disease and death from asphyxiation. In 1851, the tax was repealed.

A tax is a compulsory payment for the support of  government. A state ban on abortion compels a woman to carry a baby to term. Any loss of work income is an economic cost that a woman must bear in support of the state’s interest, using that term in a general sense (Hudson, 2019). The state claims an interest but does not pay a woman for the rental of her womb to perform that service. Is that a violation of the takings clause (Epstein & Peñalver, n.d.) in the 5th Amendment or is a rental of a womb not a permanent taking? When a state leases a building from its owner, the state pays the owner for the use of the building. Is there an implied contract when the state leases a woman’s womb to carry out the state’s interest?

The tiered structure of the British window tax has some similarities to the Mississippi law. The state does not impose a tax on the first 15 weeks of pregnancy. At the 16th week, the marginal effect of the tax is substantial. A woman must leave the state to seek abortion services, seek other intervention or continue with the pregnancy. A woman bears a considerable expense in raising a child. Economists distinguish between the statutory incidence and economic incidence of a tax. The statutory language states which party remits the tax. The economic incidence is who bears the impact of the tax. A tax on cigarettes is remitted by the retailer to the state – that’s the statutory language – but the impact, the payment, of the tax is on the consumer.

Unlike the window tax, the womb tax is selectively applied only to wombs capable of bearing children. Owners of a home in 18th and 19th century Britain could board or brick up some windows to avoid or reduce their property tax. That action could be undone if the owner wanted to pay the tax. A woman can only have her womb removed if she does not want to make it available to the state. If several thousand women were to dump their wombs – or some symbolic semblance thereof – on the steps of the Mississippi statehouse, legislators might understand the impact of this womb tax.

//////////////////

Photo by chris robert on Unsplash

Epstein, R. A., & Peñalver, E. M. (n.d.). The Fifth Amendment Takings Clause. Retrieved December 04, 2021, from https://constitutioncenter.org/interactive-constitution/interpretation/amendment-v/clauses/634

Hudson, D. L. (2019). Substantial government interest. Retrieved December 04, 2021, from https://www.mtsu.edu/first-amendment/article/1615/substantial-government-interest. Constitutional lawyers distinguish three levels of state interests: legitimate, substantial and compelling.

National Constitution Center. (2021). National Constitution Center. Retrieved December 04, 2021, from https://constitutioncenter.org/

The National Archives. (2021, February 01). Window tax. Retrieved December 04, 2021, from https://www.nationalarchives.gov.uk/education/resources/georgian-britain-age-modernity/window-tax/. Note: the 6d per window tax is £.025. I used the Bank of England CPI calculator (https://www.bankofengland.co.uk/monetary-policy/inflation/inflation-calculator) to convert pounds in 1750 to 2020 pounds. A pound today is worth $1.32. Also, see this blog for some fun facts https://sashwindowspecialist.com/blog/history-of-window-glass/

Oyez. (2021, December 1). Dobbs v. Jackson. Retrieved December 04, 2021, from https://apps.oyez.org/player/#/roberts12/oral_argument_audio/25307

Smith, A. (2009). Wealth of Nations. New York: Classic House Books. Smith discusses wages in Part 1, Chapter 10.

The Price of Oil

November 28, 2021

by Stephen Stofka

On Friday, fears of another wave of Covid lockdowns caused a sharp decline in equity and commodity prices worldwide. The decline was fueled by short-term traders who did not want to hold their positions over the holiday weekend and sold into a thin market. Crude oil prices fell 12% and closed the day below $70, and below the price of oil in the summer and early fall of 2018. Did we forget how high prices were just a few years ago? Rising oil prices helped fuel voter discontent that Democrats rode to take back control of the House that year.

Below is a graph of West Texas Intermediate, one of two oil benchmarks used domestically and shipped around the world. The price is adjusted to 2020 constant dollars.

As the price of oil broke out of its price channel in the early 2000s, companies began to develop more effective horizontal drilling techniques (Mead & Stiger, 2015, 4). In 2013, U.S. production reached a 24-year high and both political parties claimed credit. Oversupply led to a 50% price decline in 2014. Drivers liked the prices at the pump but states which had enjoyed the boom were hurt by the bust. Republican candidates promised better times in these red states if they were elected.  

In a democracy, politicians must play a game of voter persuasion. They spend millions in opinion polls  to test the temperature of voter passions, to discover the emotional buttons that will win votes. They rig Congressional districts to maximize the voter sentiment in one party’s favor. Like heralds marching into battle, candidates wave their principles and values for all to see. We have chosen this system, this political game, as the best alternative to armed conflict in the streets. Many of us were alarmed when the January 6th rioters championed a return to the violence that shook the foundations of civil society in France during the 19th century. Seventy years of successive revolts in that country left many bodies in the streets. We have far more sophisticated weapons and lots of them. Do we want that bloodbath?

As bread was a rallying cry in the French Revolution, the price of oil sparks political passions in the U.S. Higher prices impact rural folk more than urban residents, blue collar businesses more than white collar firms. When workers have to pay $100 – $200 to fill up a 40 gallon tank on a service truck, they complain. If their party is in power, it’s the fault of speculators and they will soon forget the pain when prices decline.  Voters protest loudest at high oil prices when their party is not in power. Politicians promise that their policies will bring down oil prices. They know their promises are as real as unicorns but voters like unicorns and fairy tales.

///////////////////

Photo by David Thielen on Unsplash

Mead, D., & Stiger, P. (2015). The 2014 Plunge in Import Petroleum Prices: What Happened. BSL: Beyond The Numbers, 4(9), 1-8. Retrieved November 27, 2021, from https://www.bls.gov/opub/btn/volume-4/pdf/the-2014-plunge-in-import-petroleum-prices-what-happened.pdf

Savings And Inflation

November 21, 2021

by Steve Stofka

Two billionaires, Warren Buffett and Elon Musk, pause before the packaged meat in a grocery store. This past week the price of rib eye steak, their favorite, has gone up a lot. Elon has had a busy week and wants a good rib eye so he picks out a steak and puts it in his basket. Warren would also like a rib eye but can’t bring himself to spend that much on a meal he will cook at home. He decides to buy the top sirloin and marinate it for a few hours. For whatever reason, Warren has reacted to a rise in the price of one good by substituting another good. Economists call this the substitution effect.

The next day Mary is shopping at that same store for a top sirloin steak for dinner. She notices that a few rib eye steaks are on sale for half-price. The expiration date is the next day but she intends to cook it that night so that is not a concern. Just as Warren did the previous day, Mary has responded to a price change by substituting one good for another. What about Elon? His response was to pay the higher price, substituting a different good, his income, for the higher price. Economists call this the income effect, where we substitute money for the higher price. Where does the money come from?

One source is savings, our backup income stream. Savings is the amount of income we have left over after paying taxes and buying stuff. It’s the money we didn’t spend before. After age 40, we become more conscious of the need to save for the later years in life when we stop working. Here’s a chart of per person savings for those over the age of 55. This does not include the equity that people have built up in their homes or investment accounts, but it does show broad trends.

The first of the Boomer generation turned 55 in 2001, a tumultuous year marked by the 9-11 attack, the dot-com bust and the buildup to the Iraq war. During the 2000s, economists and financial advisors warned that the Boomers had not saved enough. The Boomers complained that higher payroll taxes (Tax Policy Center, 2019), used to support earlier generations who had not paid in enough to Social Security, had reduced their ability to save. When the financial crisis reduced the value of both homes and investments, Boomers realized that their savings were too low. During the following decade, many worked past retirement age. Cautious spending by this age group restrained economic growth following the crisis and kept inflation in check during the recovery.

In the spring of 2020, Covid hospitalizations and death shot up in New York City and other urban hotspots. The Trump administration shut down most of the economy for several weeks. Congress and the administration passed emergency measures to provide relief to people who had lost their jobs. Savings shot up and incomes dropped. The pattern for all adults was the same as for older Americans.

As stores reopened and the economy recovered, it was inevitable that some of those savings would be drained away to buy stuff. The abrupt decline in savings has put pressure on prices. Are inflationary pressures temporary or  more permanent? Older generations have built up a reserve buying power that they did not have at the onset of the financial crisis twelve years ago.

There are 70 million Boomers who are spending down their accumulated savings. The Millennial generation, now 72 million strong, is the counterbalancing force to that dis-savings. Older Millennials are crossing the age-40 threshold when people start thinking that they had better put something away for the future. This tug of war in spending and savings between these two generations could continue to put upward pressure on prices for several more years.

////////////////////////

Photo by Damir Spanic on Unsplash

Tax Policy Center. (2019, July 18). Payroll tax rates. Retrieved November 20, 2021, from https://www.taxpolicycenter.org/statistics/payroll-tax-rates. From 1970 to 1990, payroll tax rates increased by 50%.

Prices Rising

November 14, 2021

by Steve Stofka

Put a bunch of people in a crowded theater, then yell “Inflation!” and no one runs for the exits. Instead they all turn to each other and start arguing. The recent rise in prices has prompted much discussion on the dynamics and causes of inflation. In the first six months of this year, the Fed cautioned us to compare 2021 prices to those of 2019 to get a more accurate picture of inflation. That longer term perspective began at 2.0% in January and slowly rose to 3.0% in June (BLS Series CUUR0000SA0). However, it keeps inching up and topped 3.7% in October. The one-year inflation rates have topped 6%. There are several causes including supply bottlenecks and higher demand but how long will it last? Is it temporary or more permanent? What should the Fed do? Is this the return of 1970s inflation?

This will be a two-parter so that I don’t strain anyone’s attention. First some background. Inflation is an increase in the overall price level. Why do prices go up? Because buyers buy stuff. How do people get the money to buy stuff? By working. In the 1950s, a British economist William Phillips studied a seventy year period of data and established an inverse relationship between unemployment and inflation. If more people are not working, they don’t have the money to buy stuff and prices don’t go up much. During the 1960s, unemployment declined more than 3% to 3.4% and inflation rose from 1% to 5%. This interplay confirmed Phillips’ hypothesis and policymakers believed that they could make a tradeoff between unemployment and inflation, balancing the two to produce an optimal economy. In the 1970s, high inflation and high unemployment dashed those hopes. Later, the Phillips hypothesis was revised, matching the relationship of the change in the inflation rate to unemployment.

Still other revisions included the role of the public’s expectations of inflation. I’ll take a real life example from the late 1970s. The price of a stereo with turntable and speakers is expected to go up in price by 20% next year. A store is offering credit with a 20% interest rate. If a consumer buys it now rather than saving up until next year, the amount of interest equals the change in price. A consumer gets to use the stereo for a year for free! Consumers start moving their future buying decisions toward the present and this ratchets up demand and inflation. 

Let’s go back to the definition of inflation as an increase in the overall price level. Where does that start? It may be the price of a commodity that we all use every day. During the 1970s, the sharp increase in the price of oil certainly had an effect. However, there was a sharp increase in oil in the summer of 2008 and there was not a prolonged bout of inflation. In fact, it may have contributed to the ongoing job loss that began in 2007 and added fuel to the developing housing crisis. Every time people think they got inflation figured out, it ducks and weaves like a boxer.

Without any change in policy, inflation automatically transfers income around the economy. Real, or inflation-adjusted, wages may remain the same but workers pay higher taxes on the nominal gains in wages. Economists call this seigniorage. The price of goods is higher so sales taxes are higher. Older people with savings earn higher interest income but those who want to borrow pay more in interest. Banks bank more profits on the difference, or spread, in the interest they pay on deposits and what they charge for loans. At higher mortgage rates, people can buy less house with their money because mortgage payments in the early years of a mortgage are mostly interest.

At higher rates of interest businesses cut back expansion plans and unemployment increases. This may help curb price pressures but people begin to adopt coping strategies than can prolong or exacerbate inflation. This creates a tug of war over the direction of prices. Next week I’ll review some of these behaviors and data trends from the past decades.

////////////////

Photo by Vicky Ng on Unsplash

My Permanent Record

November 7, 2021

by Steve Stofka

“This will go on your permanent record, young man,” my fifth grade teacher told me. As children we struggle to envision next month. A permanent record sounds like more than a month, for sure. Throughout our lives, we will buy goods and services and interact with others who are strangers. That requires a lot of trust and trust depends on reputation, a permanent record that companies, institutions and politicians work hard to shape. In the thirty years since the dawn of the internet, we are flooded with information, most of which has no reputation. We can only trust the institutions or people that relay that information to us. How do they build their reputations?

In Carlsbad, New Mexico is a series of one hundred underground caves that forms the Carlsbad Caverns National Park. During a tour, the guide turns off the lights and visitors stand in total darkness. Our vision dominates our navigation through the world. Without it we gather in other data, the sound of a throat clearing, the scuffle of a sneaker on the path through the cavern. We become aware of the musty smell of water trickling down through the rock and the smell of bodies nearby. We may notice the sound of our own heartbeat or pay attention to our toes inside our shoes.

Then the guide turns on a flashlight and we turn our heads to notice whatever the beam of light falls on. We notice the ripple and folds of rock, the different textures and colors of that one spot which the flashlight beam illuminates. How quickly we brush aside all this other sense information that we were just experiencing. Several visitors remarked on this phenomenon. Most of us organize our world primarily through sight.

The screen on our computers or phones is our attention flashlight. Through a series of algorithms Facebook, search engines and social media have learned to tune that light to our interests, our values, what we treasure and what is a threat to us. What engages our emotions or enrages our sensibilities? What music, clothes, activities do we like? They learn our habits and preconceptions, then feed us information that fits those preconceptions because they want us to linger. Just don’t go away, they say. The algorithms don’t care whether capitalism is good or bad, Republicans or Democrats, whether hip-hop is better than soul. All that matters is that we watch the screen and shine our flashlight on the nearby ads. Our attention is the product.

The Industrial Revolution spurred the need for standardization, for the making of products and machines with interchangeable parts (Mass Production, 2021). Human labor is not easily standardized so the task itself must be standardized so that human labor can be harnessed to the task. Generalization leads to specialization and this makes people more productive (Heilbroner, 1997, 80). More productivity leads to higher wages and greater consumption.

Beginning in the 19th century, mass marketing grew into a powerful tool when TV gained wide popularity after World War 2. Media outlets had vague information on the tastes of their audience but ads were a scattershot approach to reach consumers. The advertiser’s message would often fall on deaf ears because the advertiser didn’t know much about me, my unique combination of tastes, my interests and desires. They promoted their products and services, their reputation.

The media giants now have a permanent record of my attention history and buying habits. My unique combination of preferences has been sliced and diced into standardized characteristics that are important to an advertiser. A giant corporation becomes like the proprietor of a general store in a small town. They know my opinions, the news I read, the sports I like and the shows I watch. This digital reputation has become my permanent record.

/////////////////

Photo by CDC on Unsplash

Heilbroner, R. L. (1997). Teachings from the worldly philosophy. New York, NY: Norton & Company.

Mass Production. (2021). Retrieved November 6, 2021, from Scholastic Grolier Online. https://go.scholastic.com/content/schgo/D/article/100/031/10003161.html

An Extinct Proposal

October 31, 2021

By Steve Stofka

In the past 70 years, America has escalated its health care spending from 5% of GDP to 18% of GDP. Stack up all the money Americans spend on housing, cars, fuel, utilities and food and its less than what we spend on health care. Despite all this spending we have the worst rates of infant mortality and preventable death among developed countries. If we exclude the growth of health care spending in the past few decades, the U.S. economy has been stuck in the same rut that has trapped Japan. In that time, China’s economy has erupted from $.5T to $15T and is now the second largest economy, just $7T less than the U.S. We have averaged 2.4% annual real growth in the past three decades, less than the 3% growth of the post WW2 period. How do we get out of the rut?

Thirty years ago, William Clinton emerged the winner of a three man race for the Presidency. Responding to public concern over rising health care costs, he proposed a universal health care plan that received a hostile reception. Republican groups mounted an effective advertising campaign against a “takeover” of health care by government. Republicans rode that momentum to win control of the House in 1994, ending forty years of continuous Democratic control.

In the fall of that year, two economists proposed a Major Risk Insurance Plan that they estimated would lower health care spending by 20% (Feldstein & Gruber, 1994). However, the market continued to adopt HMOs as the dominant model to reduce costs. Today, the US spends far more than other developed countries and has worse health outcomes. Martin Feldstein was President of the NBER, the nation’s premier economic research institute. Jonathan Gruber was a former researcher with the NBER, an MIT professor with a lot of expertise in the economics of health care. Both had a lot of influence, but their proposal did not win converts.

Their study was based on earlier work by Feldstein and a data sample of six thousand respondents collected in 1987 that provided insight into the choices and value that people place on health care. Feldstein and Gruber concluded that the government could insure people under 65 against major health risks for a mere $150 per person, about $300 in current dollars.

Under their proposal people would be insured for half of their annual medical expenses until they spent 10% of their after-tax income, their maximum OOP, or out-of-pocket expense. This would eliminate or reduce the wastefulness of people being over-insured. Those with small copayments or “first dollar coverage” use more health care because it costs them little to nothing except their time. Many younger workers with employer provided health insurance have far more insurance than they use. Thinking that insurance is a “free” benefit, workers don’t realize that they are paying the insurance premium in the form of lower wages.

The proposal aimed for greater efficiency, more patient involvement and wider coverage. Jonathan Gruber would become instrumental in developing Romneycare and Obamacare, nursing both plans through the political butchery and swollen egos that all major legislation endures. The 10% OOP is a progressive feature that empowers and enables the poorest people to access the full benefits of the health care system after spending a small amount. Those with higher incomes pay more into the system. Because everyone has some skin in the game, they use the system more judiciously. However, sensible proposals are not sensational. They don’t dance and sparkle.

The health care and insurance industry relies on misinformation and the inefficiency in the American system for its profits. The burden of that inefficiency has become a ball and chain on the American economy.  Each generation comes to maturity thinking that it will solve the persistent problems that have bedeviled earlier generations. Those who efficiently rake in the profits protect those inefficiencies. Any system that favors the powerful few resists change. In a sense of frustration, people turn to a populist leader who claims that they can fix it because they know how the system really works. We are drawn to our myth builders like moths to the light of a flame.

////////////////

Photo by Derek Finch on Unsplash

Feldstein, M., & Gruber, J. (1994, September 01). A Major Risk Approach to Health Insurance Reform. Retrieved October 31, 2021, from https://www.nber.org/papers/w4852. A bio of Martin Feldstein https://scholar.harvard.edu/feldstein/biocv.

A Generation’s Legacy

October 24, 2021

By Steve Stofka

There are two types of federal benefit programs: those that require “dues” to qualify for benefits and those that are means-tested. Social Security is an example of the first type. With some exceptions recipients must contribute to the program to qualify for benefits. Supplemental Security Income (SSI) and the SNAP food program are examples of the latter. A person’s circumstances, not their contributions, determine their qualification for benefits. Because people think of Social Security as an insurance program, not a government charity, it is the “third rail” of politics. Voters feel that they have paid into the system and deserve their promised benefits. The Boomer generation points to the $2.9 trillion in the Social Security Trust Fund as evidence they have indeed paid into the system. Talk of cutting benefits can earn a politician the boot. The question is: have workers paid in enough?

Our choices today are constrained by the priorities and choices of past generations. The Social Security program was created in 1935 to relieve seniors burdened with crushing poverty. The failure of thousands of banks prior to that time had wiped out the lifetime savings of many workers. With a commanding majority in the House and Senate, Democrats responded to the plight of many seniors. Those first generations received far more in benefits than they paid in contributions and created what is called a “legacy debt.”

In 1965 the program was expanded and in 1975 benefits were indexed to inflation. By that time, the sum of contributions exceeded benefits paid so that the trust fund had a reserve of 56% of benefits expected to be paid that year. By 1983, the reserve stood at only 18% of that year’s anticipated benefits. High inflation during the 1970s and some miscalculations in computing inflation adjustments to beneficiaries had depleted reserves. At that time, the Boomer generation ranged in age from 20 to 37, about the same as the Millennial generation today. By 2008, the first of the Boomer generation would be eligible for benefits. A commission recommended accelerating tax increases to build up the trust fund in anticipation of this demographic bulge. When the great financial crisis hit in 2008, the trust funds had 358% in reserves. It should have been much more.

Economists and politicians have remarked on the slow wage growth of the past decades. The cause of that slow growth is a matter of political perspective, but one thing is certain. Labor productivity has slowed as well and there is no consensus on the cause of that. In the chart below, I’ve smoothed out some data from the Bureau of Labor Statistics on Labor Productivity to show the long term trends. I set the 70-year average of 2.2% annual growth at zero to show the periods of below average productivity. The chart shows the two decades of below average growth from 1975 to 1995.

Labor Productivity – 70 year average of 2.2% annual growth set to zero

In a 2001 paper William Nordhaus (2001, 2), a researcher at the National Bureau of Economic Research (NBER) noted “after growing rapidly for a quarter century, productivity came to a virtual halt in the early 1970s.” Nordhaus attributed the growth of the late 1990s to the “new economy,” the communications technology and software development at the dawn of the internet. The productivity surge lasted about a decade, succumbing to the drag of low productivity in the service sector in general.

Because many service jobs have low productivity growth, America has given up the robust growth of the modern industrial age in the post-WW2 period. Low wage growth means less taxes to fund benefits and political tension. Since 2010, Social Security has been tapping the trust funds to pay benefits as the Boomers retire. By 2034, the trust funds will be depleted and the trustees estimate that each year’s taxes will be enough to pay about ¾ of promised benefits unless taxes are raised or general taxes are used to pay benefits. As much as workers have paid in SS taxes, it wasn’t enough. The Social Security trustees estimate that an additional 2.83% in taxes would cure the problem for another 75 years but politicians don’t have the courage to push taxes higher.

The program was created during the depths of the Depression. The generation that enjoyed SS benefits far above their contributions has passed on, leaving their legacy debt with us. They believed that the future would be like the past, that strong productivity and wage growth could pay inflation adjusted benefits for 15-20 years of retirement. Across a divided country and a divided Congress, we must put down the word weapons and ask ourselves “What are we going to do?”

////////////////

Photo by Markus Spiske on Unsplash

Nordhaus, W. D. (2001, January 01). Productivity growth and the New Economy. Retrieved October 24, 2021, from https://www.nber.org/papers/w8096

SSA. (2021). Social Security – Trust Fund Ratios. Retrieved October 24, 2021, from https://www.ssa.gov/oact/tr/2020/lr4b4.html

The How and Why of Identity

October 17, 2021

by Steve Stofka

A current topic of controversy is a popular comedy special on Netflix featuring the acerbic wit of Dave Chappelle. In this last of several Netflix specials, Mr. Chappelle airs many grievances, one of which involves previous remarks he made about transgender people. Hannah Gadsby, an Australian comedian with a quiver of arrows and the skill of a markswoman, targets the bias and bigotry in our culture. Recently she has aimed at some remarks by Netflix executives who defended Mr. Chappelle’s humor. Ms. Gadsby leads a growing audience of voices who worry that the Chappelle special could inflame hate attacks against people with a non-mainstream sexual orientation or gender identity.

In past centuries society has regarded non-straight orientation as a behavior outside accepted norms and ostracized those individuals as deviants. Social scientists have now recognized the importance of biology in sexual orientation and gender identity. Recent jurisprudence and law have accorded equal access to marriage, property and employment regardless of sexual orientation or gender identity.

Black people have long been ostracized for their skin color and there is no dispute whether skin color is biological or behavioral. Decades of law and jurisprudence have not been able to undo the bigotry and bias against those with black skin. Two comedians, each from a marginalized group, confront each other and the larger society over the nature and construction of identity. This is an enduring debate.

2400 years ago Aristotle attributed the falling of objects to their nature. People accepted that view until Galileo showed that it was a dynamic of forces, not an inherent nature that made things fall. Explanations that attribute causes to nature – the within – are attempts to answer the question of why. Explanations that investigate the dynamic between things answer the question of how. In the 17th century John Locke argued that people had a natural right to private property that no king could dispose of without violating a natural law. That was why society had an obligation to protect property rights. The how of that natural right involved a dynamic between God, Adam and Eve when He turned them out of the Garden of Eden and set them to toil the earth for their food.

In his special Mr. Chappelle adopts a realist approach, arguing that gender is an unalterable fact of nature. An alternative perspective is that gender is a construction of biological, social and psychological factors. The nature vs. dynamic identity debate exists in many fields. Some people claim that only gold has real value as a money, regarding paper money as a mass illusion of value. Economists argue that the value of something is what you will give up for it, a value based on a dynamic. Karl Marx thought the fundamental value of any good was the labor that went into producing or harvesting it. Mainstream economists assume that the value of a good is its utility to the user, a fluid construct of preference, time and price. The debate over sexual orientation and gender identity is another manifestation of this conflict of perspectives.

Some comedians walk the dark alleys of our society and psyche. In the 1960s, Lenny Bruce and George Carlin questioned mainstream values. In a brash and vulgar style, Bruce openly flouted speech prohibitions and police often arrested him during his act. His notoriety helped bring these laws to the Supreme Court where they were ruled unconstitutional. In the 1970s, Richard Pryor offended many with his off-color remarks as he dug deep to unearth the hatred and hypocrisy that rotted our culture. In other cultures today, comedians who ridicule authority figures are arrested. Caustic remarks are against the law. Liberal societies tolerate a wide range of speech and views. Those are the two choices on the menu: authoritarian or liberal. I’ll take the liberal, please.

//////////////

Photo by ANGELO CASTO on Unsplash

The Weight of History

October 10, 2021

by Steve Stofka

In 1992, several months after a brutal beating by L.A. police officers during an arrest for drunk driving, Rodney King pleaded “Can we all get along?” From his apartment balcony nearby, George Holliday had filmed the incident. Despite the evidence shown in the film, a jury without any black members acquitted the officers and Los Angeles erupted into riots. Mr. Holliday, 61 and in good health, died in September from Covid. He told a friend that he didn’t want to get vaccinated so that he could develop antibodies to the disease (Williams & Chan, 2021). How did vaccines become a lightning rod of disagreement? Mr. King died in 2012 but his words haunt every meeting where human beings gather to negotiate a solution to a problem. Why are there so many irresolvable problems?

Myth and religion have provided answers to this question. The Judaic version is that two people in the Garden of Eden broke a pact with God and all humankind had to suffer. The ancient Greeks thought that the gods of Mt. Olympus amused themselves with the human drama, stirring up trouble when there was too much peace. Animistic traditions believe that the gods take an active part in our daily lives as well. Evangelical and Pentecostal Christians hold a similar belief but limit the agency to one God.

Constant turmoil is necessary for change, and change is the key characteristic of our world. Whether it is the gods on Mt. Olympus enjoying the human soap opera, or a God in heaven answering a prayer for relief from pain, we seek an explanation that features agency. What we fear is the senseless turmoil of random change. We want there to be a clearly identifiable cause and what we find are an abundance of causes for a single event, an overdetermined system.

The system of international relations is characterized by anarchy, the lack of a central authority to enforce the rules. We often see the same anarchy in a republican system of government. In the U.S. system, Congress itself is the higher authority and within that governing body is a Senate with features similar to the Security Council of the UN. The U.S. is one of five members of that council, the P5, who have a veto vote that can kill any resolution. In the Senate, the leader of the majority party can kill any legislation, no matter how popular, by refusing to bring it up for a vote. Should it come to a vote, one Senator’s vote can effectively kill the legislation. This governing structure has enfeebled  both the UN and the Senate. Why did the U.S. adopt the anarchy of the international system?

Writing over three hundred years ago John Locke argued that men in power could not be trusted (Locke, 1988, 395). The U.S. Constitution embodies Locke’s principles and especially this foundational distrust of power in the hands of people. The Constitution constructed the House on the democratic principle of majority vote and majority will. The founders built the Senate like an international organization of nation-states, each state having separate interests and cultures, each state capable of wielding effective, if not outright, veto power. Founded on distrust and the autocratic power of one Senator’s vote, the Senate has become an ineffective political body, a classroom where adults gather to practice the art of international politics. Unable to govern itself, the Senate hobbles the rest of the country with the chains of its ineffectiveness.

Students of history study the flaws of the Roman Senate that led to monarchy and the eventual downfall of the Roman republic. Students of future centuries will study the foundation of distrust that crippled the U.S. Senate at a crucial time in the nation’s history. They will learn that human institutions can become powerless if they attempt to strike an even balance of power. Will they learn from our mistakes? We leave so many lessons that succeeding generations ignore, thinking that they are different or that their circumstances are different. If we could only learn, we might improve our institutions and our lives and construct a more lasting peace.

Peace is not conducive to change and it is the uneven path of change that we must walk. No, Rodney, we can’t all get along. Like donkeys each generation carries the lessons of history on its back but looks forward, unable to truly see and understand what it carries.

///////////////////

Photo by Florian GIORGIO on Unsplash

Locke, John. 1988. Two Treatises of Government: a Critical Edition. ed. Peter Laslett. Cambridge, MA: Cambridge University Press.

Williams, D., & Chan, S. (2021, September 21). Man who filmed Rodney King’s 1991 beating by police dies of covid-19, Friend says. Retrieved October 09, 2021, from https://www.cnn.com/2021/09/21/us/george-holliday-rodney-king-video-obit-trnd/index.html