CPI vs Deflator

Dec. 24th, 2012

No, this is not an article about Mexican boxers or Japanese monster movies.  At a time when families come together to celebrate the holidays, the fiscal debate in Washington continues.  One of the issues being discussed is a change in the annual cost of living adjustments made to Social Security (SS) recipients.    Currently, SS payments are adjusted upwards by the annual Consumer Price Index (CPI).  The Social Security Administration (SSA) uses the urban survey, or CPI-U, one of the two major variations of the index and represents the buying habits of 87% of the population.  Each month, the Bureau of Labor Statistics (BLS) surveys a “basket” of goods and services that the typical urban consumer would purchase.  These include food, housing, clothing, transportation, medical care, and education.  The categories are weighted, with housing and monthly utilities accounting for a little more than 40% of the index. (BLS Source)

The index is set to 100, or think of it as $100, as of the period 1982-84.  What the index means is that it now takes $227 to buy what we could buy for a $100 in 1982.

The fiscal year for the Federal Government ends on Sept. 30th of each year.  The SSA uses the CPI for the previous twelve months ending in September to determine the cost of living adjustment for SS recipients.  Over the period of many decades, the rise in the CPI may look uniform but the annual change is fairly erratic.
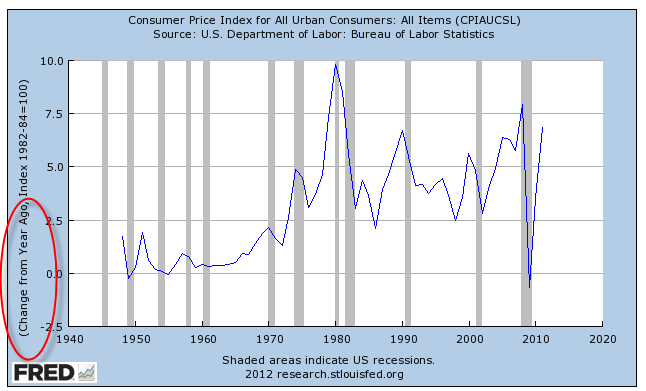
Do consumers adjust their purchasing as erratically as the CPI changes?  No.  Household incomes don’t vary that much. The contention is that consumers make purchasing adjustments in response to changing prices.  If gasoline prices rise, a family may cut back their travel where they can.  If they can’t cut back in that area, they will cut back in another area, like dining out. If the cost of a strip steak rises over several months, a family may buy a cheaper cut of meat, or buy more chicken or pork.  This process of dynamic substitution on a monthly or quarterly basis is not accounted for by the CPI, which makes adjustments to their market basket much less frequently.

In response to this weakness in the CPI calculation, a measurement tool called the Implicit Price Deflator was invented.
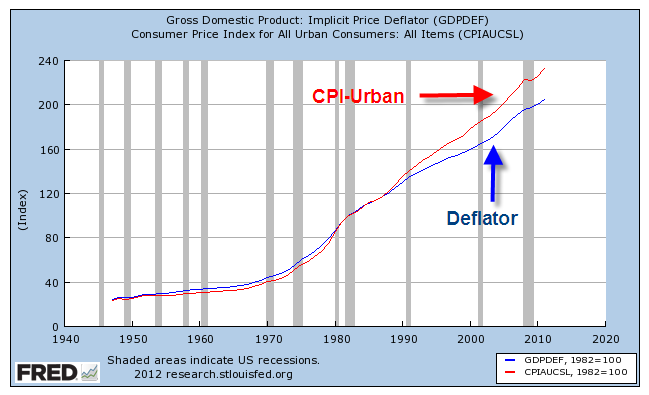
The deflator makes substitutions in response to price rises.  Because the response of the deflator index is more dynamic, it changes less erratically than the CPI.
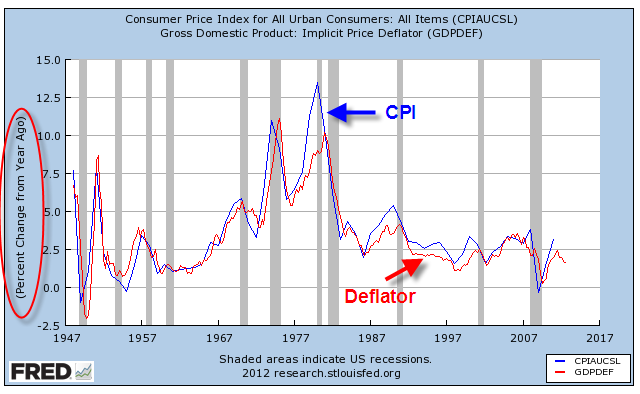
The deflator also considers utility, a concept which is both a strength and a weakness.  If a basic desktop computer in 2012 costs the same as one in 2006, but has twice the power and disk storage, the deflator will treat that component of its index as though it had fallen by 50%.  The argument, and a valid one at that, is made that someone who needs a basic desktop computer is going to spend the same amount of money and that the index should remain unchanged during that period.  The counter argument is that, since the consumer is getting more bang for the buck, she will need to spend less money on upgrades to that computer.

So, the debate is: 
The CPI overstates the effect of inflation
                            Vs
The Deflator understates the effect of inflation.

The annualized growth of the CPI since 1947 is 3.67%.  In that time, the Deflator index has risen at an annual rate of 3.35% (Source).  Think about that, girls and boys.  The “great debate” over Social Security is over 3/10ths of 1% annually.  That is $3 on a Social Security check of $1000.

Nancy Pelosi, the Democratic Minority Leader in the House, has said that any attempt to base the cost of living adjustment on the deflator rather than the current CPI index is to “destroy” the retirement security of millions of Americans.  Hyperbole is not partisan, however.  John Boehner, the Republican Majority Leader in the House, has said that using the deflator will “save” Social Security.  Armageddon rhetoric over 3/10th of 1%.  No wonder there is a lot of dissension in the halls of Congress.  The real cause of global warming is the amount of hot air blowing from Washington.

It is true that over the course of thirty years, 3/10th of 1% adds up to a 9.4% difference in the growth of Social Security checks, but we are talking thirty years.  Some argue that the difference between the two indexes has grown during the past thirty years.  For this more recent period, the difference is 45/100ths of 1%, or a total difference of 14.4% over the next thirty years.

Although the percentages in the debate over cost of living adjustments are small, the SSA sends out hundreds of billions of dollars annually to recipients.  The tiny difference in the cost of living adjustment is slight to each recipient.  To the Federal Government however, the savings are in the billions of dollars and that is what the argument is really about.  One party would like to take $3 out of one taxpayer’s pocket in higher taxes and put it in the pocket of a person receiving Social Security.  The other party wants to not give the person on Social Security the $3.

Two normal people having a debate about this might reasonably say “Hey, let’s split the difference.”  We could write a law that said that cost of living adjustments would be the average of the CPI and the deflator index.  But these leaders in Congress, and I will include the White House as well, are not normal people.  They might have been normal at one time but they have lost touch with the day to day reality of compromise that constitutes most of our lives.  They have become so consumed with their own importance, with the sanctity of their principles and their positions, that they find rational compromise all but impossible.
The BUT Job Market

December 9th, 2012

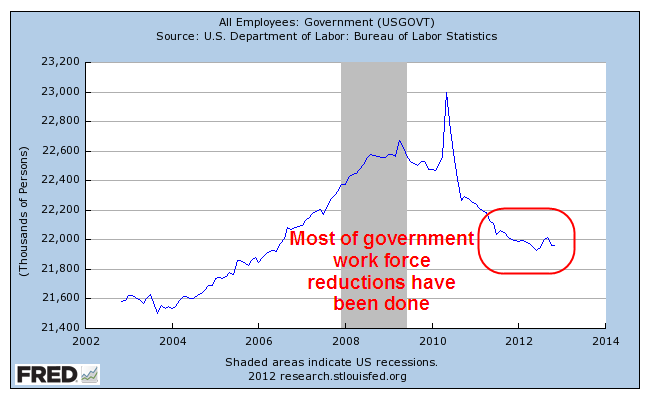
The November Bureau of Labor Statistics (BLS) report released Friday surprised many.  Two days earlier, ADP, the private payroll firm that processes 24 million paychecks, released their estimate of private employment gains of 118,000 for the month of November.  Estimates of the BLS total employment growth were in the 80,000 range.  The reductions in government employment, which ADP doesn’t track, are largely over and don’t act as a drag on employment gains each month.

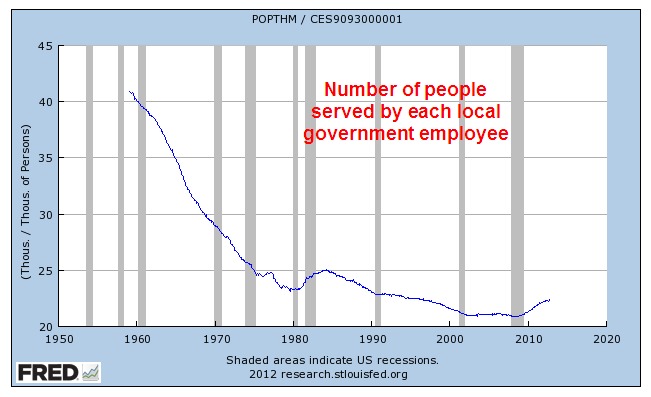
The reductions have been particularly heavy at the local level.  The number of civilians served by each local government employee has risen slightly since the official end of the recession in June 2009 but they are at relatively historic lows over the past five decades.

The thinking was that SuperStorm Sandy would have a significant impact on job growth in the heavily populated tri-state region of New Jersey, New York and Connecticut.  However, the BLS reported “our analysis suggests that Hurricane Sandy did not substantively impact the national employment and unemployment estimates for November.”  Huh???!!  The headline employment gains were 148,000, not enough to reduce the unemployment rate but enough to keep up with population growth.  The other headline number was that the unemployment rate had dropped to 7.7%, a drop of .2%.  Again, huh???!!

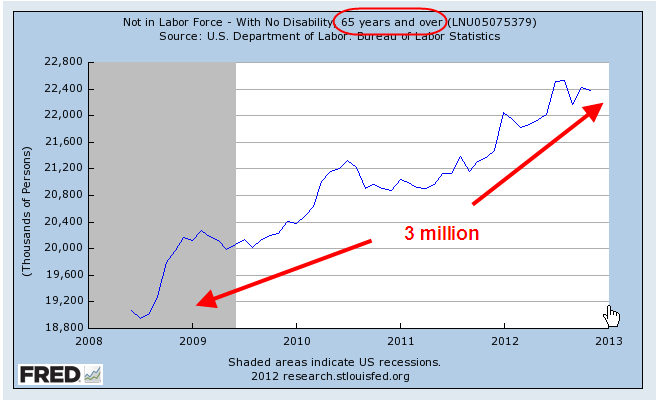
Given the circumstances, this was a good report – until one started diving into the numbers on the report.  Here it comes again – that big old BUT!  Another 200,000 workers dropped out of the labor force in November, and none – that’s right – none of them were older workers retiring.  Since November 2011, 2.5 million have left the work force; of those, one million are over 65.  Another 300,000 simply didn’t look for a job in the past month.  Some have gone back to school, whether by choice or the lack of it.

The ranks of the long term unemployed has dropped 200,00 in the past month, 900,000 in the past year.  Some have found jobs; some have run the course of their unemployment benefits and taken what they could get or given up.

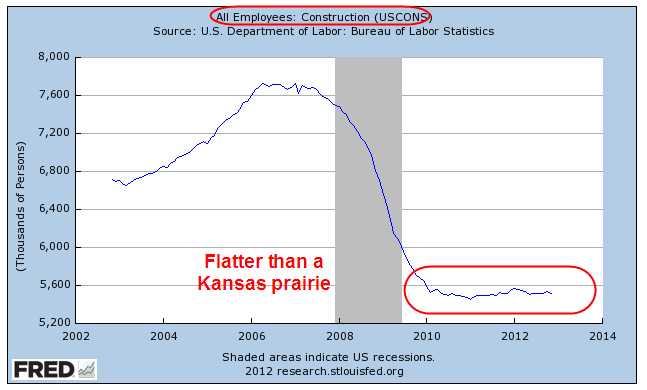
Despite the recent rebound in housing, construction continued to lose jobs.

Leading gains were in professional and business services (43,000) and health care (20,000), both fields which have been steady gainers the past several years.  BUT, in the health care field, about 40% of job gains went to staff nursing homes.  

This trend will only get more pronounced as the Boomer generation ages and resource strapped elderly people and their families can not afford even temporary home care that might delay admittance to a nursing home.

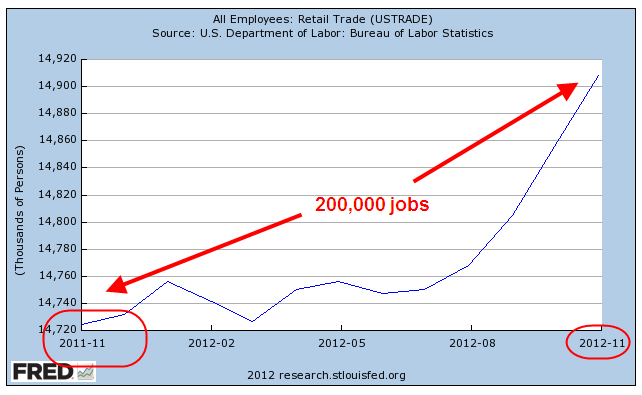
Since the summer, businesses have been adding retail workers.  The graph below is seasonally adjusted so that the upward trend is more reliable.  Since June 2009, this sector has added 1/2 million jobs.  BUT – there it is again – many of these jobs are part time and pay below average wages.
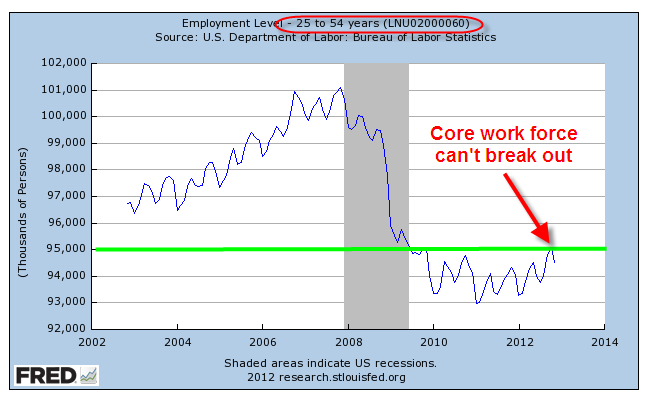
The core work force, those aged 25 – 54, dropped last month and has gained only 200,000 in the past year.  How many sometimes think, “I would enjoy my kids more BUT I’m having difficulty keeping a roof over their heads.”

Employment gains of married men and married women have been flat in the past year.  Women head of households, ever resourceful, have gained 1/2 million jobs in the past year. 

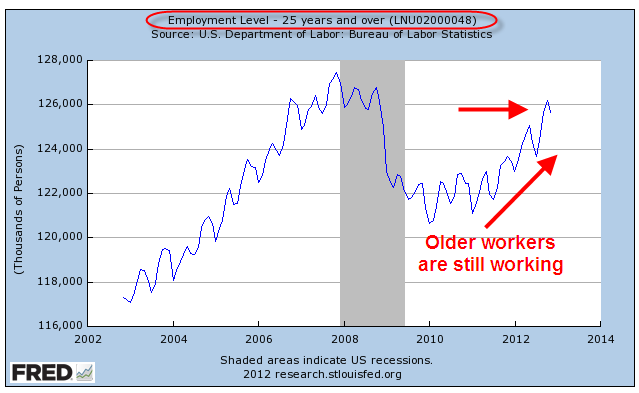
Those aged 55 and over have seen job gains of 2 million in the past year; part of these gains are due to an age shift in the population; some is due to older workers continuing to work past their intended retirement.  Regardless of the causes, the trend is dragging down the economic recovery.  Older people simply don’t buy as much stuff as younger people do. 

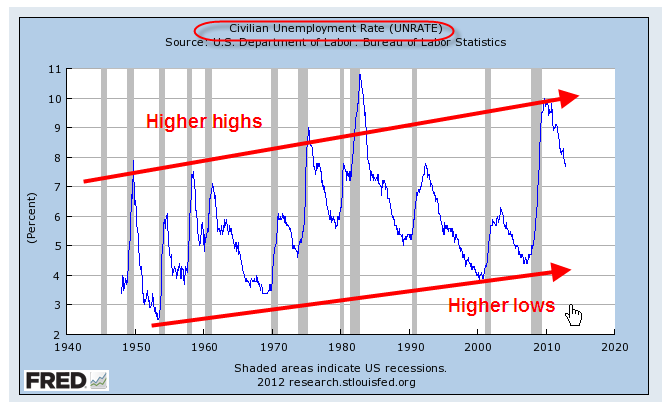
Fans of the Silver Surfer – let’s climb on our galactic surfboards and rise high above space and time to look at the unemployment rate over the past several decades.  As the manufacturing sector has shrunk, the peaks and troughs of unemployment have risen.

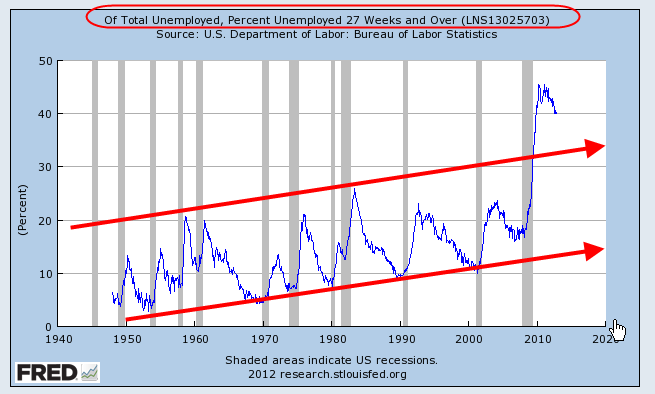
The percent of unemployed workers who have been unemployed more than a half year also shows this disturbing long term trend.

The shrinking of the manufacturing sector, an inherently cyclical one, has had the positive effect of reducing the frequency of unemployment cycles.

2012 was the year that the first of the Boomers reached their full retirement age of 66.  Regardless of the health of the economy, we can expect to see the “Not in the Labor Force” number continue to rise as Boomers drop out of the labor force.  Since mid-2008, 3 million older workers have dropped out.

Each year about 2 million young adults graduate and enroll in college. (Census Bureau Source)  The other 2 million need some kind of work, either part or full time.  The level of unemployment has dropped by 50% for these new entrants into the work force but is still far above the 2007 level – a difficult job market is not a good way to start one’s working career. 

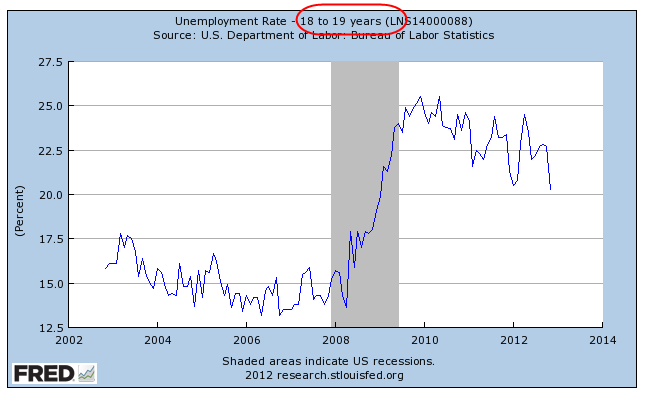
The delayed retirement of many Boomers will continue to put pressure on the job market with young adults particularly impacted.  GE is one company that is planning on bringing back jobs to this country from lower cost countries.  They cite two negatives that plague manufacturers in emerging countries: the lack of adequate patent protection and the theft of intellectual property. Two positives of domestic manufacturing are lower transportation costs and faster times to market.  Let’s hope that this repatriation of manufacturing becomes a trend – young people need the work.  The unemployment rate among those aged 18 – 19 has stayed above 20% for three years.

The BUT Economy

December 9th

An eventful week in what I will call the BUT economy:  GDP revisions, Corporate Profits, Consumer Confidence and the Labor Report.  Let’s get into it!

At the end of last week, the Commerce Dept issued their customary revisions to 3rd quarter Gross Domestic Products (GDP).The first number that came out in October was a preliminary estimate.  As more data comes in, the Commerce Dept. revises its figures, and will have another revision in December.  From the initial estimate of 2.0% annualized growth, the Commerce Dept revised 3rd quarter GDP growth up to 2.7%, below the historical average of about 3% but good news is YAAY! Right?  Wait for it now…BUT upward revisions were due largely to companies building inventories.  Final sales actually declined from the initial estimate of 2.1% to 1.9%.  Excluding exports, final sales were revised from a growth of 2.3% to 1.7%.

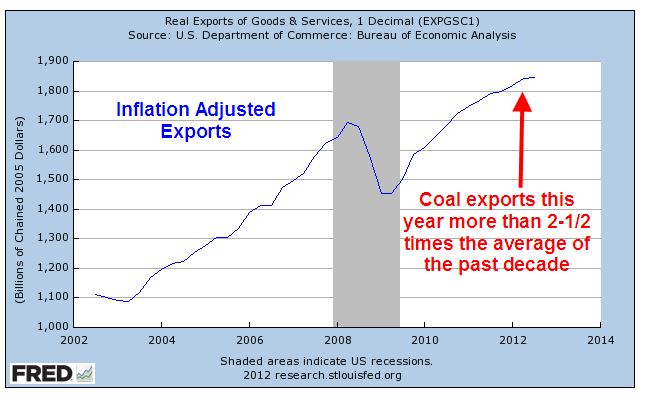
The boom in natural gas production has led many power generators to convert their plants from coal to natural gas, when they can.  Total coal production is down this year (Source) but exports of U.S. coal to the rest of the world have surged, so that we are exporting a record 25% of the total coal production in this country.  The U.S. Energy Information Administration (EIA) estimates that coal exports will total about 133 million short tons this year, or 2-1/2 times the average of the past decade. (EIA Source)

The process of drilling for natural gas, called Fracking, has also led to a high production of crude oil (EIA source).

GDP includes both exports (+) and imports (-), what is called “net exports” and it has been negative for several decades as we import far more goods than we export.  This serves as a negative drag on GDP growth.

Exports have risen over the past decade.  As natural gas prices have fallen, surging coal exports in the past few years have helped buoy up lackluster GDP growth.

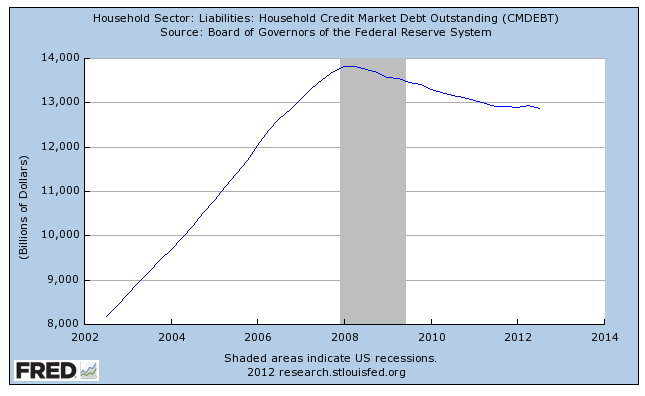
Another contributor to GDP growth has been a more confident consumer, in contrast to the rather cautious attitude of businesses in the past six months.  An upswing in student debt and car loans has halted the decline as households have shed debt (delevered) either by foreclosure, default, paying down balances or not charging as much.  Household Credit Market Debt outstanding (includes mortgages, car loans, student loans, revolving credit) indicates a growing willingness of consumers to take on more debt. 

On a per person basis, our debt has declined slightly from the peak of 2007 but is still way too high, leaving many of us vulnerable to a subsequent downturn, slight though it might be.

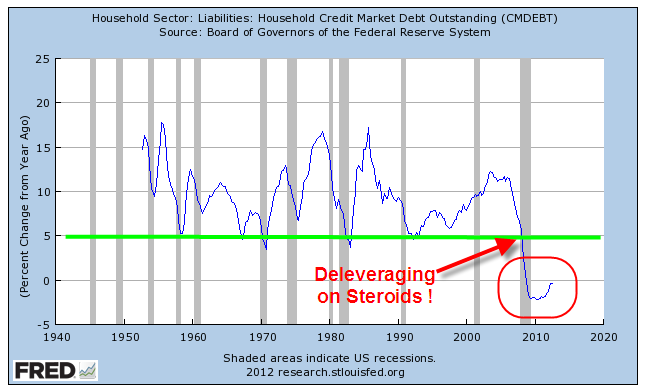
Just how bad has this recession been?  In previous recessions, households cut back their debt to “only” a 5% growth rate.  For the first time ever, the American people reduced their debt growth rate below 0. It is only in the past two years that this rate of negative debt growth is approaching 0.

Here’s the BUT. The underlying fragility of confidence was revealed this past Friday when the U. of Michigan Consumer Sentiment poll showed a plunge in confidence from over 82 in September to 74 in October. For the first time since the recession started in late 2007, the consumer confidence index had finally surpassed 80, only to fall back again the following month.  In a relatively healthy economy, this index is above 90.

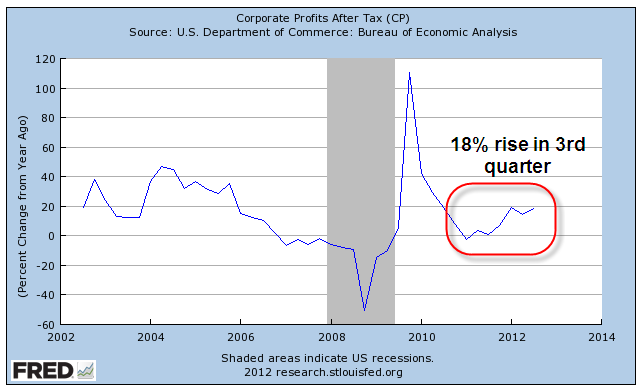
To summarize so far, we have a consumer slowly and haltingly gaining more confidence, spending more and keeping the growth rate of her debt in check.  We have an overall economy that is behaving rather tiredly, growing tepidly as though on the downhill of a long boom cycle; that’s a problem since this has not been a boom cycle in the past few years.  So how are corporate profits doing?  Fine! Thank you!

In this past quarter, profits rose by 18%.

Starbucks, the coffee giant, announced this week that they would voluntarily pay some British income tax this year instead of moving the profits to some low tax country and avoiding British income taxes.  It appears that their customers discovered that they had been (legally, mind you) avoiding paying income taxes and were mobilizing to boycott Starbucks’ stores in Great Britain.

Interest rates kept near zero by the Federal Reserve have been a feast for many international corporations.  At the end of October, U.S. companies have issued $1.1 trillion in investment grade and high yield bonds (Source), responding to investors’ thirst for higher yields. That is an increase of 26% over last year’s bond issuance. International companies are, quite rationally, borrowing at the lowest interest rate they can find around the world, then spread that money to their subsidiaries in other countries.  They pay the lowest income taxes they can find internationally and shuffle the paper profits around the world. 

Ok, where were we? Oh yeah, cautious but more confident consumer, tepid but possibly improving GDP growth and record corporate profits.  Oh yeah, and record Federal Debt – over $16 trillion and counting.

Pity the poor corporations who pay the highest income tax rate in the world – except that they don’t.  In 2011, it was about 20%.

Record corporate profits, record low effective corporate tax rates, record low borrowing costs for corporations and record high Federal Debt.  The largest companies heavily lobby Congress to keep their tax rates low.  No matter how high profits are, companies publicly worry about their profit forecast and the economic outlook.  These large companies have become adept at convincing Congress that they are struggling.  Half of the Congress thinks that they must help these poor companies create jobs; key committee members craft more tax goodies and bury these goodies inside large appropriations bills.  Congress underfunds regulatory agencies so that they are effectively outmanned by corporate legal departments.

The lack of corporate tax revenues contributes to the Federal debt; over the past fifty years that share has declined from 20% of Federal revenues to about 10%.  If the share of Federal revenues had remained at the 20% level of the 1960s, the Federal Debt would be $7.4 trillion today, not $16 trillion.  Calculating savings on interest paid on the smaller debt would lower the actual debt to about $6.8 to $7 trillion.

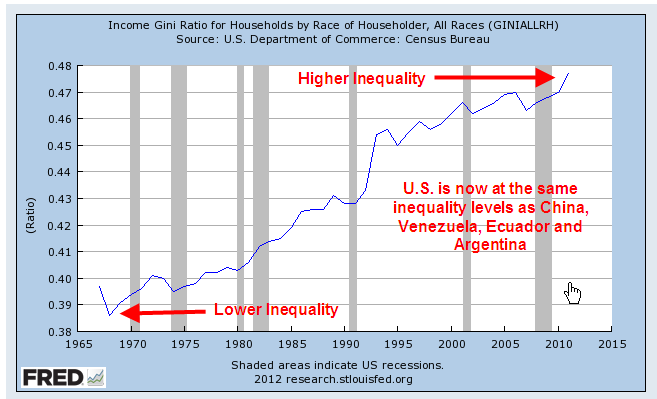
Big increases in productivity have helped fuel the strong rise in profits.  Investments in technology as well as higher skill and education levels have enabled American workers to record levels of production but they have not shared in the gains from those increasing levels of production.  The U.S. has risen to the same levels of income inequality as some emerging countries:  China, Venezuela, Ecuador and Argentina.

To recap:  record high corporate profits due to record high worker productivity which has not benefited the workers, record low effective corporate tax rates and share of the costs of government, record low borrowing costs for corporations, and record high Federal Debt.

All of this largesse to multi-national U.S. corporations begs the question: Where are the jobs? But that I’ll leave for next when we look at the November Labor Report released this past Friday.

Manufacturing Muddle

December 5th, 2012

Tenaciously limping along like Chester on the western TV series “Gunsmoke.” On Monday, the Institute for Supply Management (ISM) released their November Manufacturing Index report, showing a very slight contraction.  The downward trend in manufacturing activity will continue to curtail any employment gains.  The monthly labor report from the BLS is due this Friday.

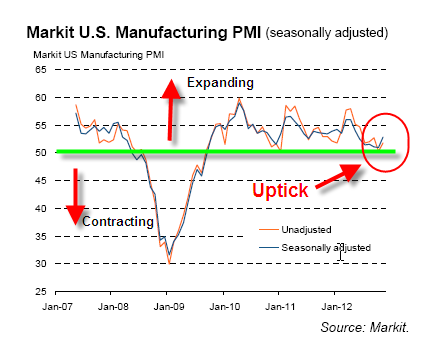
On the same day, Markit Economics and ISM released their November Manufacturing Purchasing Managers Index (PMI) report, a survey of purchasing managers at manufacturing companies.  An outlook into the near future, the survey showed a solid uptick this past month, giving some hope that the decline in manufacturing may be bottoming or turning upward.  For the first time in six months, exports increased;  new orders and employment showed a faster rate of expansion but inventories dropped a bit, showing that businesses are still cautious.

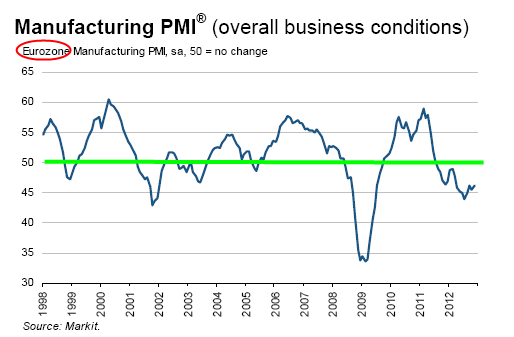
The manufacturing PMI for the Eurozone also increased but remains at recession levels.  The lackluster demand in Europe will crimp growth in the U.S. 

The effects of Superstorm Sandy continue to muddy both the analysis of existing data and forecasting near term trends but there are no strong signs of growth.

In Washington, the impasse over the fiscal cliff is not helping.  A hundred years ago the Sixteenth Amendment was passed, enabling the Federal Government to levy income taxes.  Until then, the Federal government had a rather limited say in defining “fair.”  The power to collect taxes on income began a century long debate over what is fair.  As any parent knows, each child has their own unique sense of fairness.  As children grow up to be adults, they retain this unique intuitive assessment of fairness, layering rationality on top of the child’s sense.  Thus we have as many definitions of fair as there are people in the world.  The debate will never end until the power to tax incomes is once again removed from the Federal Government, where there are just too many powerful people with too many contending definitions of fairness.  The fractiousness is hurting people and businesses.  Winston Churchill sensed something eternally and unfortunately true about us: “Americans can always be counted on to do the right thing…after they have exhausted all other possibilities.”
   

Tax Tinkering

Negotiations over a resolution to the fiscal cliff  met an impasse in the past week.  Republicans, mainly from states with low state and local taxes, would prefer to cap tax deductions for higher income taxpayers than raise the top marginal tax rate.  Democrats are strongest in those states with high state and local taxes; the higher income taxpayers in those states would really feel the tax bite if deductions for these taxes were capped at the federal level.  Both parties have become proxies for upper income earners yet neither will admit it because it doesn’t play well in middle America.  Democrats profess that their sole concern is the middle class; Republicans cite their allegiance to small business owners as the reason for their resistance to higher tax rates.

On the spending side, Democrats have not put forward any specific modifications to entitlement programs like Social Security, Medicare, Medicaid that they would consider – only that they would consider them.   Mostly they talk about preserving these programs even though no one has suggested getting rid of them.  Most of us sit in the back of this bus with a sinking feeling in our guts;  we see posturing and positioning from the Congress and the President in the front seats but the bus is not moving.
 
Some voices are calling for comprehensive tax reform as a final solution; others rightly scoff at the idea that a lame duck Congress can enact even a small bit of tax reform.   The task of tax reform is monumental – almost Sisyphean.  I have been reading a book about the last comprehensive tax reform that took place in 1986, “Showdown at Gucci Gulch”, by Jeffrey Birnbaum and Alan Murray.  The authors tell a detailed and well informed narrative of the dastardly dueling and dealing that occurs in any democracy when competing interests collide and collude in crafting a compromise.

Venture investors want low capital gains rates.  Companies whose revenues and profit depend on investments in equipment and materials want to protect tax breaks for their costs.  Unions want fringe benefits for their members to remain tax free.  Oil and gas companies want to shield their oil depletion allowances that permit them to exclude some of the taxable income they earn each year.  Insurance companies lobby to retain the tax free status of the cash build up on the life insurance policies they sell.  Realtors and home builders want to preserve the mortgage interest deduction; the Tax Policy Center reports that over 50% of the total of this deduction goes to the top 1/10th of 1% of income earners.  Charitable organizations and places of worship lobby for the preservation of the charitable deduction.

70% of taxpayers do not itemize and the vast majority of taxpayers who do itemize claim about $10 – $15K.  The top 1% of taxpayers claim on average about $120K in deductions.

Voters want results; the say they want compromise and some resolution to the political standoff that has been the status quo in Washington for the past two years.  Given the issues, interests and costs involved, finding a middle ground will be difficult.  The 1986 Tax Reform law was almost two years in the making, and soon after it was passed, Congress began to tinker with it.
 
535 elves, the members of Congress, tinker away in the workshop of the Federal Government, making thousands of tax toys for the citizens and businesses of this country; everyone wants  a toy, not a lump of coal.  It is unlikely that Congress can put together  a comprehensive tax package before January 1st.

Charitable Giving

This is the time of year when many people reach out to their favorite charities.  Consider a charity that is helping with disaster relief after SuperStorm Sandy, provides meals for families and seniors, provides housing assistance for those in need, and so much more.  No, it is not the Red Cross, the Meals on Wheels program or Habitat for Humanity.  The charity is the U.S. government.  They are desperately in need of funds.  As they help clean up after Sandy, they have not even finished paying for damages from hurricane Katrina that battered Louisiana, Mississippi and Alabama in 2005.  Anyone can donate online at the U.S. Treasury.  As with other charities, you can use a credit card.

During and since the drafting of the U.S. Constitution over two hundred years ago, we have argued over the wording of the “general welfare” clause of the Constitution (Article 1, Section 8).  James Madison, a Federalist and chief drafter of the Constitution, said that the phrase was a limited power conferred on the federal government; that “general welfare” meant that welfare which applied to all the people.  You can read Federalist Paper No. 41 for his more lengthy explanation of this controversial phrase.
The anti-Federalists, always suspicious of the powers given to a large and powerful central government, replied that “general welfare” could mean anything.  What, they argued, was to prevent this newly formed Federal Government from becoming a charity?

Madison scoffed, arguing that the taxing power was restricted to only those taxes which were uniform throughout the country.  The taxing power is specified in the same sentence as the “general welfare” clause, separated only by a semicolon.  Therefore, it was preposterous that anyone could argue that “general welfare” could mean anything.

Alexander Hamilton, also a Federalist and an advocate of a strong Federal Government, argued that the “general welfare” clause was essentially a plenary power given to Congress, in line with its power to spend.  To the anti-Federalists, this violated the spirit of the Constitution which was designed to enumerate, or limit, the powers of central government.

In short, Madison says general welfare is limited by the taxing power that immediately follows.  Hamilton says it is not limited because Congress’ power to spend is not limited. 

United States vs. Butler in 1936 and Helvering vs. Davis in 1937 were two Supreme Court decisions that sided with Hamilton.  What the anti-Federalists had warned about was about to come true.  The U.S. Government was on its way to becoming – over the next 75 years – the largest charity in the world.

Some think that charity should be part of a government’s role; although some of those would argue that charity should not be the chief role of a government, as it is now.  Some argue that charity should not be in the hands of government.

Many of us will receive appeals from many charities during this season of giving.  The Treasury does not mail appeals for money despite the fact that it is performing the same helpful acts as other charities.  Charity Navigator, a charity watch dog organization, does not rate the U.S. Treasury for its management of the funds it receives.  But the Treasury really does need the money as it helps to feed, cloth and house millions of people each month.  

Cliff Diving

November 18th, 2012

This past week, President Obama gave a post-election news conference, answering a number of questions about the fiscal cliff due to take effect on January 1st if the lame duck Congress and the President can not come to an agreeement on some budget bandaging.  The stock market has had the jitters since the first week of October, falling 9% since then; about half of that decline came after the election.  At almost the same hour that it became apparent that the balance of power in Washington would remain the same came the unwelcome forecast of no growth for the Eurozone in 2013.  When in doubt, get out.

For the past two years, there have been few “Kumbaya” moments in the halls of Congress or the White House.  The market has had a good run this year; capital gains taxes could increase next year; many decided to take their profits and run.  A I wrote a month ago, the drop in new orders for durable goods was troublesome.  Three weeks ago, the newest durable goods report showed further declines yet consumer confidence was up, creating a tug of war and I waved the yellow flag, saying that the “prudent investor might exercise some caution.”

For the long term investor who makes annual investments in their IRA, this drop in the stock market is an opportunity to make some of that contribution for this year.  If the wrangling over revenue and spending cuts continues over the next few weeks, the market could drop another 10 – 15%. When budget negotiations collapsed in July – August 2011, the market declined almost to bear market territory – about 19%.  All too often, some of us wait till the last minute in April to make our annual IRA contribution. 

The “cliff” terminology was spoken by Fed Chairman Ben Bernanke at a hearing in February.  He probably wished he had chosen less colorful language but he was probably trying to wake up some of the senators at the hearing.  How bad is this cliff?

The total measured economic output of the U.S., its GDP, is estimated by the BEA (Bureau of Economic Analysis) at around $16 trillion – $15.85 trillion, to be exact, based on this year’s estimated growth of about 2.2% and next year’s average 2.75% estimate of growth.  What’s a trillion dollars?  About $9000 for every household in the country.

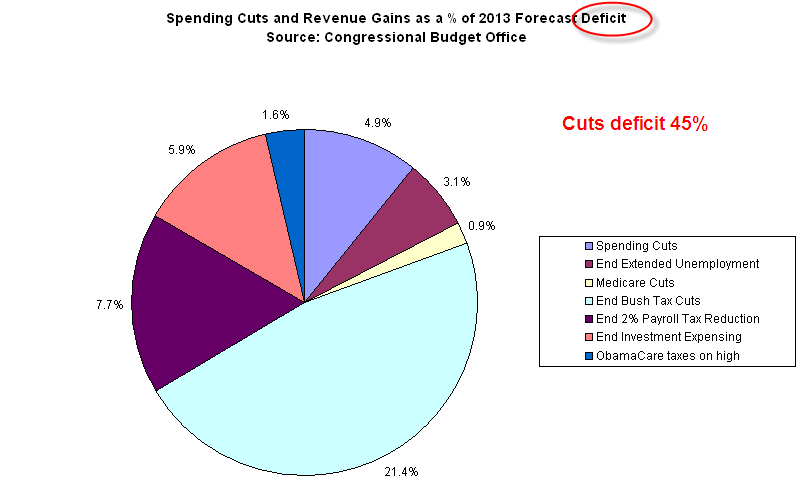
The non-partisan Congressional Budget Office (CBO) estimated some of the economic impacts if we did go over the cliff; in other words, if the spending cuts and revenue increases occurred next year.  Below is a chart of the percentages of GDP that each component of spending cuts and revenue were to occur.

The total of these is 3.2% of the economy.  Well, that’s not Armageddon, you might think and you would be right. As I mentioned earlier, forecast growth is only about 2.75% for next year so that means that GDP would contract slightly next year.  On the other hand, the cliff sure helps the deficit for next year, cutting it by almost half.  The deficit is projected at about $1.1 trillion before spending cuts and revenue increases.  In more manageable numbers, the country is going to go further into debt next year to the tune of almost $10,000 for every household.

Politicians in front of a microphone are prone to hyperbole.  So are news anchors.  Politicians try to sell their version of the story; news anchors try to keep our attention.  Small numbers like 3.2% of GDP might not get our attention so we could hear more dramatic numbers.  News anchors may say “Spending cuts of $100 billion” because $100 billion sounds important.  But without a total or a percentage, we have no context to evaluate the amount of money.  Is $100 billion a little or a lot?  $100 billion in spending cuts is .6% of the entire economy, or 2.6% of the budget for this coming year.  We may hear “Revenue increases of $400 billion,” which sounds gigantic.  It is 2.5% of the economy, or an additional 13.8% of the projected federal revenue.  Remember, even with the revenue increases, should they take effect, the country’s budget will still be “in the red” an estimated $600 billion dollars, or $5400 per household.

This country needs more revenue and it needs to cut expenses.  Each side of the aisle will fight to protect the “job creators” (interpretation: people with money) or the “working poor” (interpretation: people who are barely making it week to week) or the “middle class” (interpretation: the rest of us).  Tax the other guy, not me.  Cut the other guy’s deductions, not mine.  Cut subsidies, but not mine.  Cut expenses but not in my industry or area of the country. This is the same kind of behavior that 5 – 8 year old kids exhibited in an experiment featured on CBS’ 60 Minutes tonight.  Maybe, just maybe, we need to grow up.

Fiscal Cliff

Just pulled out of ElectionVille.  Next stop is FiscalCliffe.   Some of us ride in plush seats, some in coach, others stand in the aisles or ride on the roof, but we are all on the train. In the front car are the really plush seats where the President and Congress sit.   They occupy the front car because they are supposed to be looking out for what comes ahead but they spend most of their time arguing with each other. 

“We need to hook up some more cars so that those people riding on the roof can sit in safety,” the President says. 

“We won’t have enough coal for the engines to pull that many cars,” Republicans say.

“We need have those who are sitting in the plush seats pay more,” the President insists.

“They are already paying way more than their fair share,” Republicans counter.

“The passengers on the train have spoken.  They want the plush seats to pay more,” the President responds.

“They kept us in power in the House because the House controls the money.  They trust us to manage the money and we can not betray that trust.  If we make the plush seats pay more, then the plush seats won’t need as many porters and we will lose jobs,” the Republicans parry.

“I am not going to make the other passengers pay more when the plush seats can easily afford a little more,” the President maintains.

In September, I wrote about the coming “fiscal cliff”, a self-imposed austerity program of spending cuts and tax increases that is due to take effect Jan. 1, 2013, unless the President and Congress can agree to some fiscal balancing program.  After all the election talk and negative campaigns now comes the fiscal cliff chatter, which I am now adding to.

We are about $250 billion away from the debt limit of over $16 trillion dollars.  The Treasury will run out of money by the end of this year.  With some financial sleight-of-hand, the Treasury expects that they can make it till February of next year before the debt limit must be raised.  In July and August of 2011, President Obama and the Republican House could not come to an agreement to raise the debt limit and avoid default.  The fiscal cliff of upcoming spending cuts and tax increases became the devil’s bargain that were agreed to in the compromise that led to the raising of the debt limit to its current level.  The President did not want to come back to Congress for more money until after the election.  After the momentum of the 2010 elections, Republicans thought the election just past might give them control of the Senate and the Presidency.  The grand bargain was set to take effect after the 2012 election, each party thinking that the voters would make a clear choice in the elections.  Instead, the voters chose a divided government with the same power balance as before the election.  In short, voters said “Work it out.”

“Grandpa, what’s the pistol cliff?”

I snort a quick laugh and the inner comic in me speaks up.  “It’s a place where we are all going to shoot ourselves in the foot with pistols.”

“Will somebody shoot my foot?” 

I’ve really stuck my foot in it this time.  “No, your feet will be fine.”

“Will mommy be able to walk after her foot gets shot?”

“Your mom is not going to get her foot shot.  No one is going to get shot.  I was just making a joke.”

“I was on a cliff over the ocean this summer and there were big rocks at the bottom on the beach and the water was going ‘whooompf’ all over the rocks.”

“I’ll bet that was pretty,” I say.

“Cliffs won’t hurt us as long as we stay on the path and don’t climb over the rail.”

Amen, I think.

In the early nineties, the Democrats made a deficit cutting bargain with the first President Bush:  in exchange for tax increases, the Democrats would agree to spending cuts – after the recovery from the recession.  The tax increases were put into law and cost President Bush a second term.  The spending cuts that the Democrats promised never came.  In 1994, the Republicans took the House and forced the issue.  The symbol of the Republican Party is an elephant – and elephants don’t forget.  The President and Democratic Senate Majority Leader, Harry Reid, will be in budget negotiations with John Boehner, the Republican House Majority Leader, who was in the House in the early nineties.  Also present will be Mitch McConnell, the Senate Minority Leader, who was in the Senate at that time.  It is doubtful that either of these two Republicans have forgotten.    

Power To The People

A moment to acknowledge the personal caring and effort of ordinary people, the courage and doggedness of first responders during the superstorm “Sandy” and a heartfelt sympathy for those who lost loved ones during the storm.  Mile long lines of cars waiting for gas brought back vivid and unpleasant memories of the 1970s when many of us who lived in NYC would get up at 4 AM just to wait in line for a few hours to buy gas so we could get to work.  Resilience and persistence are bred into many New Yawkers (that includes you guys and gals in Jersey, too).  The clean up and repair will test every ounce of both during the next year.  Some losses, of course, are not the kind that can be repaired, only endured with the support of family and friends.

                                                                  _________________

The October employment figures released two days ago showed an increase of 171,000 jobs this past month, about 50,000 more than expected and a welcome relief to the Obama campaign.  Retail and restaurant jobs posted strong gains and health care jobs continued their strong growth. 

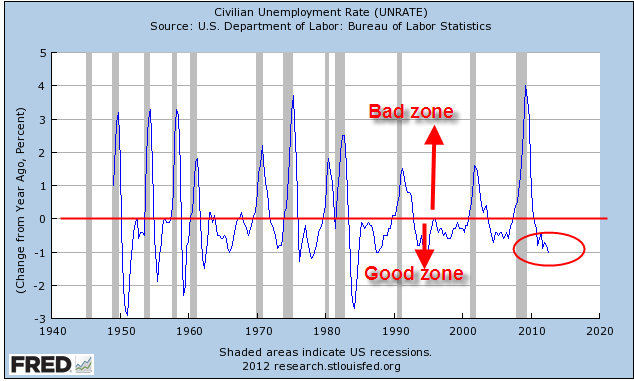
More people started looking for jobs, bringing the unemployment rate up a smidge to 7.9%. The year over year percent change in unemployment is relatively healthy, as shown on the 60 year chart below.

This past week came a series of positive reports.  Consumer spending rose .8% in September and home prices continue to improve, showing a .5% monthly gain in the Case Shiller index of 20 leading cities.  Both of these indicators have shown recent strength but the year-over-year gains for both consumer spending and home prices is a plodding 2%.

Consumer confidence has shown strong improvement the past four months and is expected to have about the same positive sentiment level as last month’s survey. As I noted last week, the consumer has lately shown more confidence than the business community.  The Chicago manufacturing index dropped last month and is now at a stall speed.  Tomorrow the national manufacturing report will be released.  The manufacturing sector is certainly responding to the weakness in Europe and slowing growth in China and southeast Asia.

While the employment gains were welcome, there are too many negatives that continue to show.  We are barely keeping ahead of population growth.  Below is a chart showing an index of employment and population growth.  We are still down about 7% from the peak in late 2007, which was more of a bubble level of employment.  We could reasonably target mid-2004 levels.

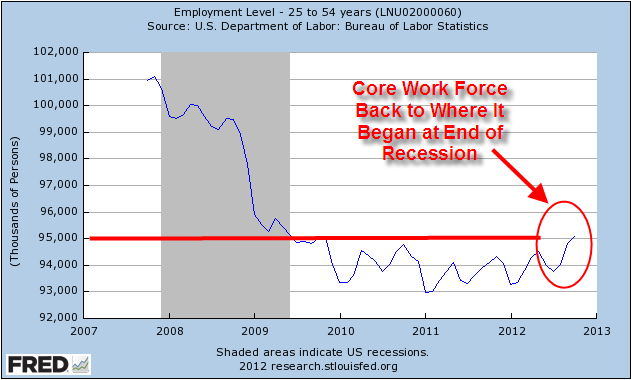
The core work force of those aged 25 – 54 is showing a little upward movement over the past two years but is still anemic.

Most of the job gains are going to older workers above 55. “Get out of the way, pops!” may become the mantra of younger generations. 

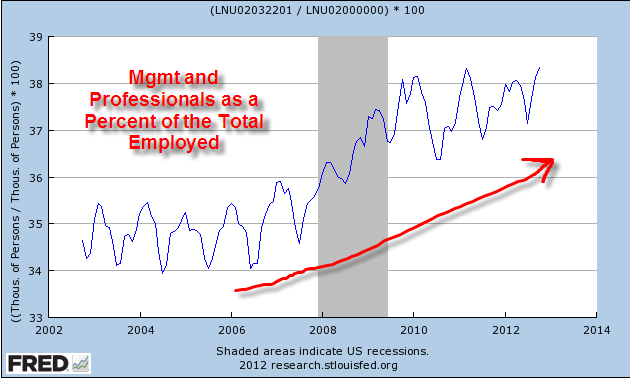
The loss in production jobs leads to a continual increase in the proportion of management and professional jobs.

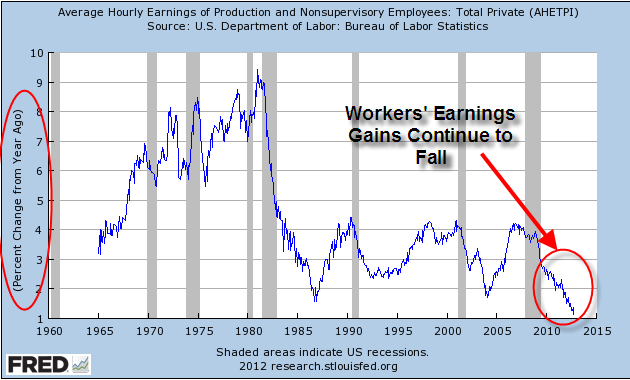
Hourly Earnings gains are flat out terrible, hitting an all time low.

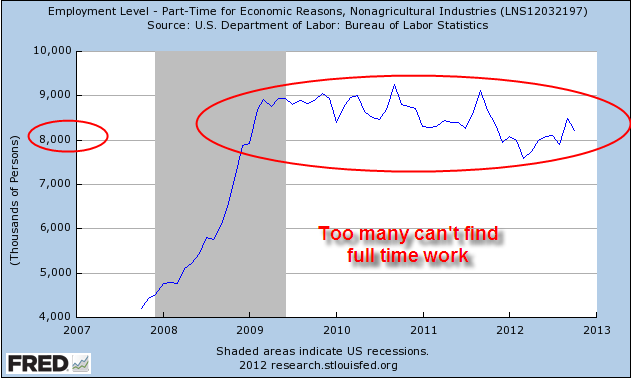
There are still too many people working part time because they can’t find a full time job.

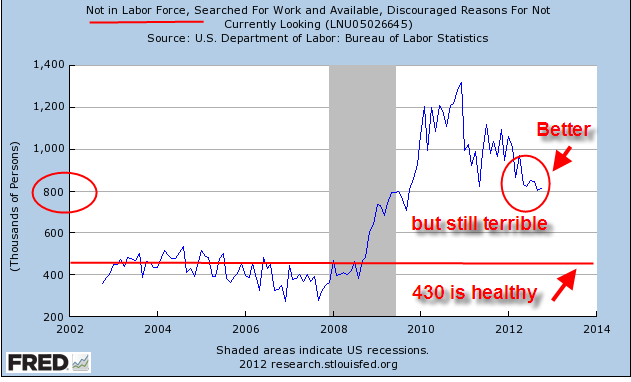
The number of discouraged workers is declining but is not healthy.

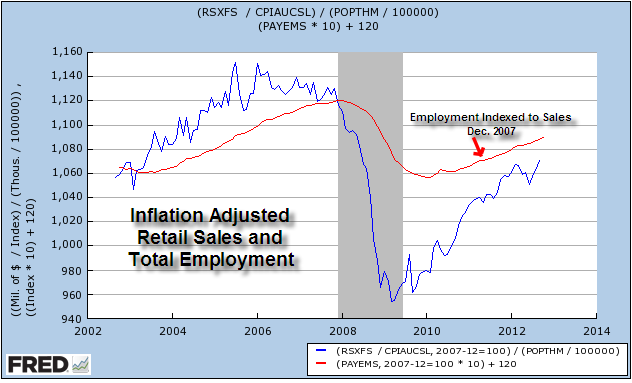
Retail sales, particularly auto sales, are an indication of rising consumer demand.

But after adjusting for population growth in the past decade, we have finally climbed back up to where we were 8 years ago.

To show the correlation between retail spending and employment, I’ve overlaid an index of one over the other.

As you can see, retail sales lead employment gains and losses.  I sincerely hope that retail sales will continue to improve and turn around the recent business pessimism.  My chief concern is the lack of competence and character in Congress on both sides of the aisle.  This coming election will do little to alleviate those concerns.

Capital and Consumer Spending

If I hit my thumb with a hammer, maybe it won’t hurt this time.  Not likely.  Last week I noted a warning sign in non-defense new orders for capital goods, excluding aircraft.  As I noted previously, aircraft orders are volatile; they may be up 30% one month and down 30% a few months later because orders for planes are placed in rather large blocks with the actual delivery of the aircraft occurring over many months.

A few days ago the most recent durable goods report came out for September, showing a continued decline in the year-over-year gains for new orders.  Declines like this have preceded the past two recessions.

We like to think that this time may be different. Our imagination is capable of soaring the heights of creativity in art and science.  In the economics of our personal lives, it can lead to fanciful thinking.  Fanciful notions led many to buy houses with little money down at the height of the housing boom, thinking that somehow they would refinance when mortgage payments escalated after a certain period.  Magical thinking induced many to increase their credit balances far beyond their means to pay, thinking that they could pay down their credit balances by refinancing their homes.  No matter how much homes went up in value, housing prices would continue to rise.  Then they didn’t.

The chart below shows the housing inflation.  Recessions in the latter part of the past century had caused housing starts to decline to 400,000 before recovering.  In the 2001 recession, easy money and loose standards for mortgage securitization curbed the natural decline.  The bill eventually came due in 2008.

Single family homes create jobs; the market has shown life recently but is still very weak.

The Conference Board’s Consumer Confidence index rose 9 points to 70 in September and is about the same level as this past February, when confidence started sliding to a summer low point of 60.   The new consumer survey is due to be released next week and analysts are predicting another increase of 3 to 4 points. Consumers are feeling upbeat but the decline in new orders shows that businesses continue to be cautious as the prospect of rising taxes and budget cuts next year dampens any optimistic planning.  The slowdown in Europe and Asia contributes to the gloomy reading of Moody’s Business Confidence survey.  Rising consumer confidence before the critical Christmas shopping season may alleviate the pessimism of businesses if consumers actually open up their wallets and spend but retailers have not been building inventory ahead of the shopping season.

While these two forces tug at each other, a prudent investor might exercise some caution.