“Bummer, dude!” may be what President Obama’s election campaign manager thought when the quarterly GDP figures were released this past Friday. Second quarter growth clocked an anemic 1.5% annualized growth rate – a tepid pace – but one which was slightly above the market consensus of 1.2%. This first estimate of quarterly GDP growth is often revised up or down 1/2% as more data comes in (BEA Source). Second and third revisions to the GDP growth rate will follow in August and September, but pose a challenge for any re-election campaign. What is the pace of this recovery? It has been three years, or 12 quarters, since the official end of the recession in the 2nd quarter of 2009. In that time, real or inflation adjusted GDP has grown 6.7%. What has the been the real GDP growth rate of past recoveries? Below is a comparison of the total GDP growth of past recoveries and the Administrations in office at the 3 year mark after a recession (Click to enlarge in separate tab)
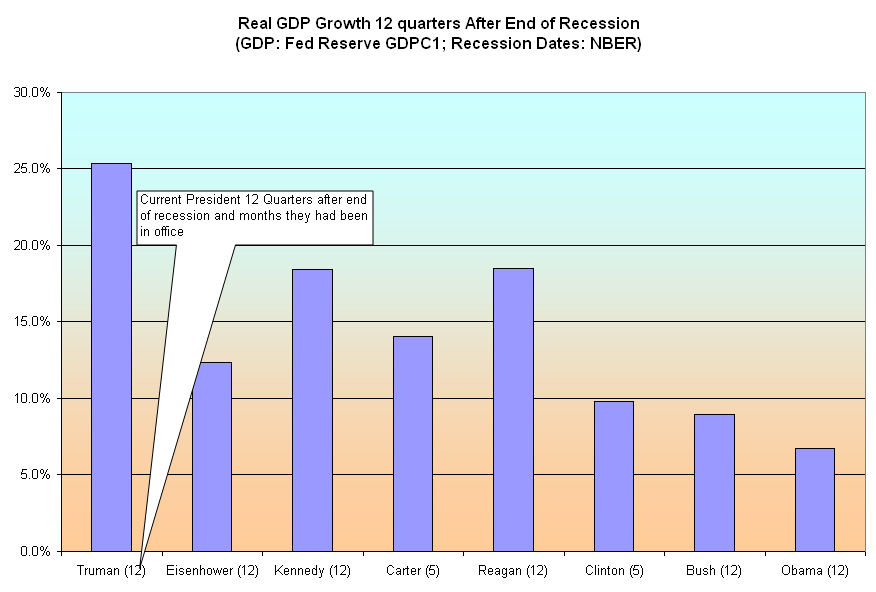
At the 3 year milestone after the 1960-61 recession, President Johnson had been in office for just two months after the assassination of Kennedy in November 1963. At mid recovery after the long recession of 1973 – 75, Carter took over the reins from President Ford, who had taken office after Nixon resigned over the Watergate scandal. Likewise, President Clinton took office from the first President Bush near the middle of an ongoing recovery from the recession of 1990 – 91. In addition to the disgrace of resignation, President Nixon never enjoyed three years without a recession and so does not make it on this chart. President Johnson has the distinction of never having a recession during his tenure in office.
Although the media and the public like to pin the economic tail on the President, the House and Senate have much more to do with the economy than the President. Bills originate in the House (primarily) and Senate. Presidents do not initiate legislation. Below is that same chart showing the mix of House and Senate during each recovery since WW2.

We can’t say that the strongest recoveries are when the House and Senate are the same party as the President. We might be able to say that recoveries are strongest when Democrats are in the House, but Democrats ruled the house, except for four years in the late forties and early fifties, from 1933 through 1994 – a period of almost sixty years! (Metric Mash) This doesn’t leave much for comparison. We can’t say that a mixed Congress of Democrats and Republicans produces a weak recovery. What makes this recovery unique is that, for the first time since at least 1900, the House switched parties during an economic recovery (Congressional Research Service, NBER and Metric Mash). In the 2010 elections, anger over the health care act helped fuel a newly established Tea Party which worked within, not outside, the Republican Party and helped that party gain a large number of seats to take the majority in the house. If history is any guide, the American public can change direction in the House during a recession, after a recovery, but not during a recovery. The recovery plans set in place by either party need a chance to work themselves out. To interrupt those plans in midstream produces a stalling effect.
Do the weak economic figures doom Obama’s re-election? Not so, according to 538. Whoa! What’s 538? The answer is who’s 538. And the answer to that who? is Nate Silver, a statistician who developed a system for predicting the performance of baseball players. His methods for analyzing baseball proved to be suprisingly accurate in predicting the 2008 and 2010 elections. After his almost perfect predictions for the 2008 electoral races and the recipient of a few awards, the NY Times licensed Mr. Silver’s blog in 2010.
You can find Mr. Silver’s take on what the latest GDP figures mean for the election here. Mr. Silver also has an interesting article on the primary economic indicators he thinks have the most influence on voter’s choices. You can bookmark his blog here.
