July 6, 2014
This week I’ll take a look at the monthly employment report, update the CWPI and introduce a surprising medium term trading indicator.
***********************
Employment
On Wednesday, the private payroll processor ADP gave an early forecast that this month’s labor report from the BLS would be robust, near the tippy-top of estimates of job gains that ranged from 200K to 290K. The BLS reported $288K i net job gains, including 26K government jobs added. 17,000 of those jobs were in education at the local level. Rising sales and property tax revenues have enabled many city and county governments to replace education jobs that were lost during the recession.
Job gains may be even better than the headline data shows. ADP reports that the large majority of hiring is coming from small and medium sized firms. The headline number of job gains each month comes from the BLS Establishment Survey, which underestimates job growth in really small firms. The Household Survey estimated about 400K job gains this past month. Usually, the Establishment Survey is thought to be the more reliable estimate but in this case, I would give a bit of a bump up toward the Household Survey estimate and guesstimate that job gains were closer to 330K this past month. The BLS also revised April and May’s job gains upward.
The unemployment rate decreased .2% to 6.1% and the y-o-y decline in the rate has accelerated.
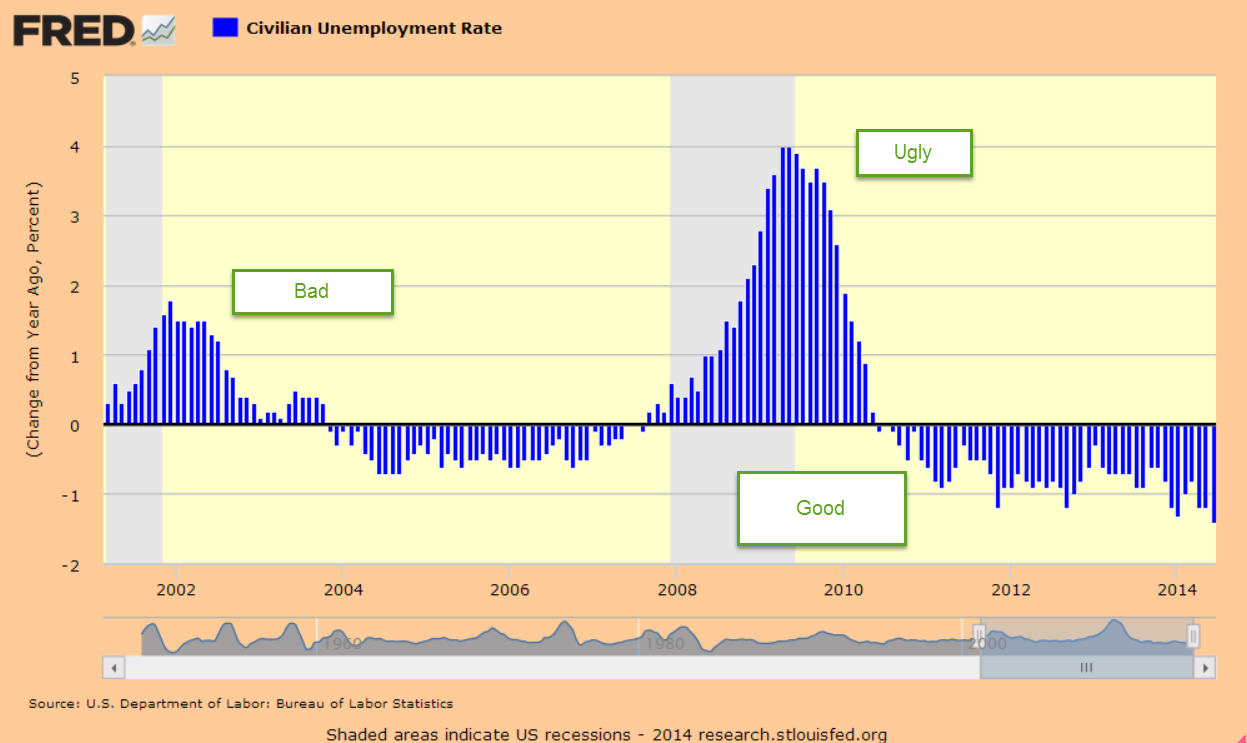
Excellent news, but let’s dig a bit deeper. The BLS tracks several unemployment rates. The headline rate is the U-3 rate. The U-4 rate includes both the unemployed who have looked for work in the past month, and those who have not, referred to as discouraged workers. The trend in discouraged workers has been drifting down, although it is still above the normal range of .2 to .3% of the work force.

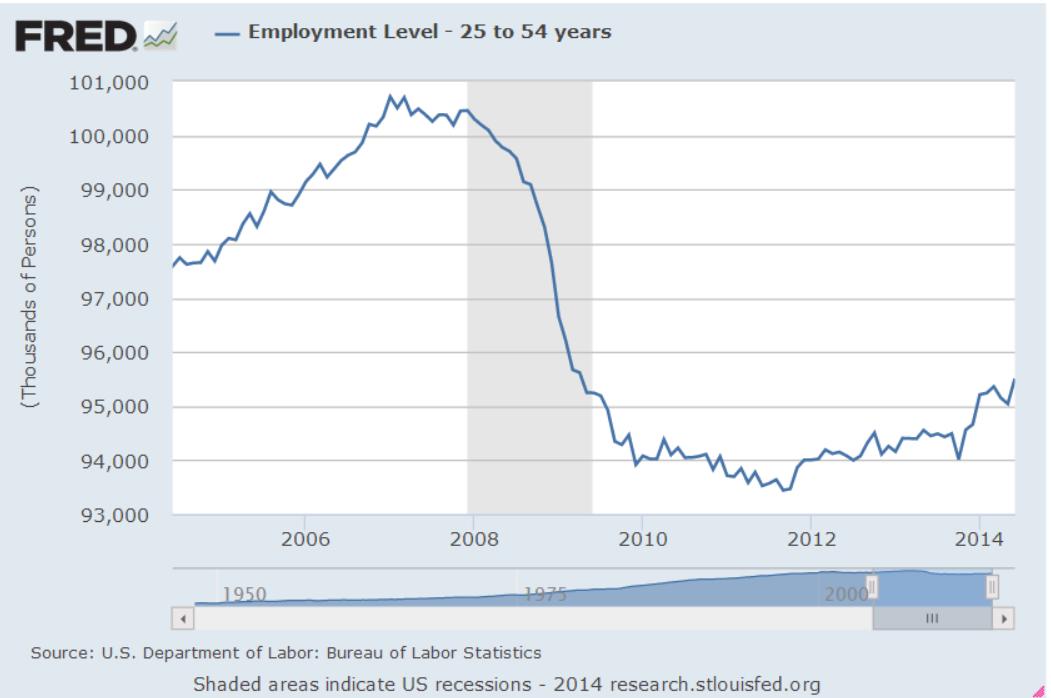
I would be a whole lot more optimistic about the labor market if the employment rate of the core work force aged 25 – 54 were higher.

Slowly and inexorably the employment level of this core has been rising in the past few years but the emphasis is on the word slowly.
The number of workers who usually work part time seems to have reached a high plateau, close to 18% of the Civilian Labor Force (CLF). The CLF includes most people over the age of 16. June’s Household Survey shows a historic jump of 800,000 additional part time jobs added in the past month.
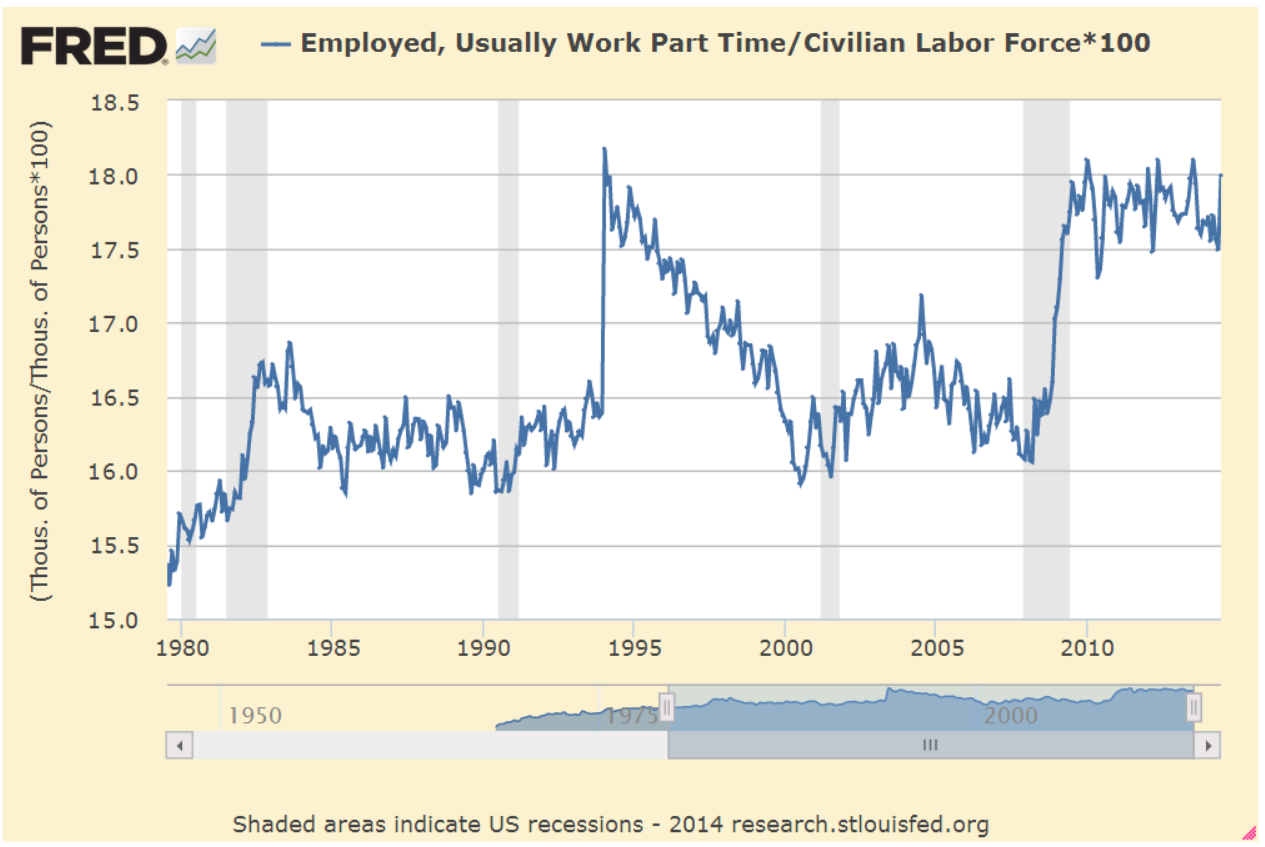
A closer look at the BLS data makes me doubt that number. The unseasonally adjusted number of part timers shows only a 400,000 gain, leading me to question any seasonal adjustment that doubles that gain. Secondly, the BLS did not seasonally adjust last month’s tally of part time workers, leading me to guess that June’s figure includes two months of seasonal adjustment.
That same survey shows a one month loss of more than 500,000 full time jobs lost (Table A-9 BLS Employment Situation). The year-over-year percent change in full time workers is 1.8%. As you can see in the graph below this is in the respectable range. The unseasonally adjusted y-o-y gains is close to the seasonally adjusted gain, leading me to believe that the losses, if any, have been overstated due to month-to-month fluctuations in seasonal adjustments.
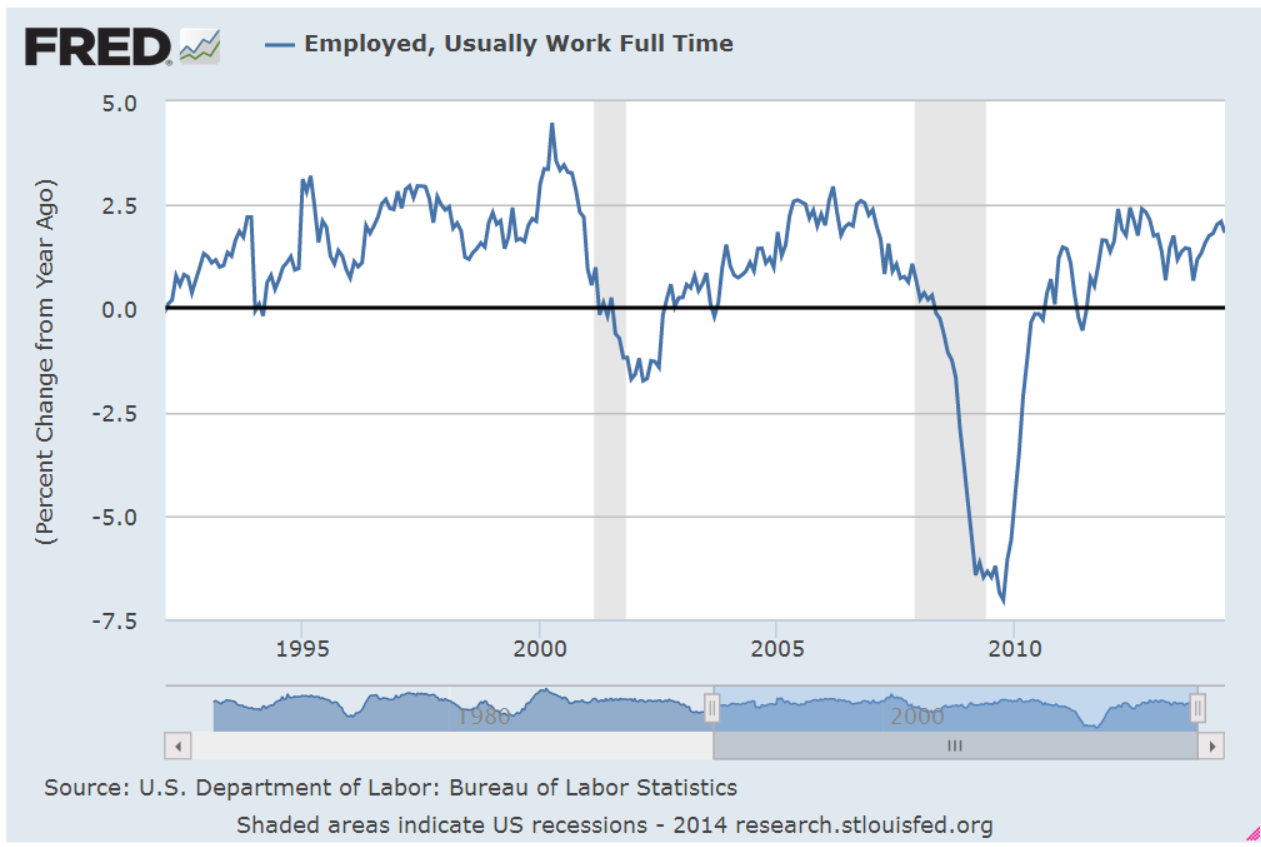
However, if you are selling a newsletter that says the stock market is grossly overvalued and the end is coming, then you would want to highlight the change in June’s seasonally adjusted numbers, to wit: 500,000 full time jobs lost; 800,000 part time jobs gained.
While the Civilian Participation Rate has steadied, it is rather low. The Participation Rate is the number of people working or looking for work as a percent of most of the population above 16. Below is a chart showing the declining participation rate and the unemployment rate.
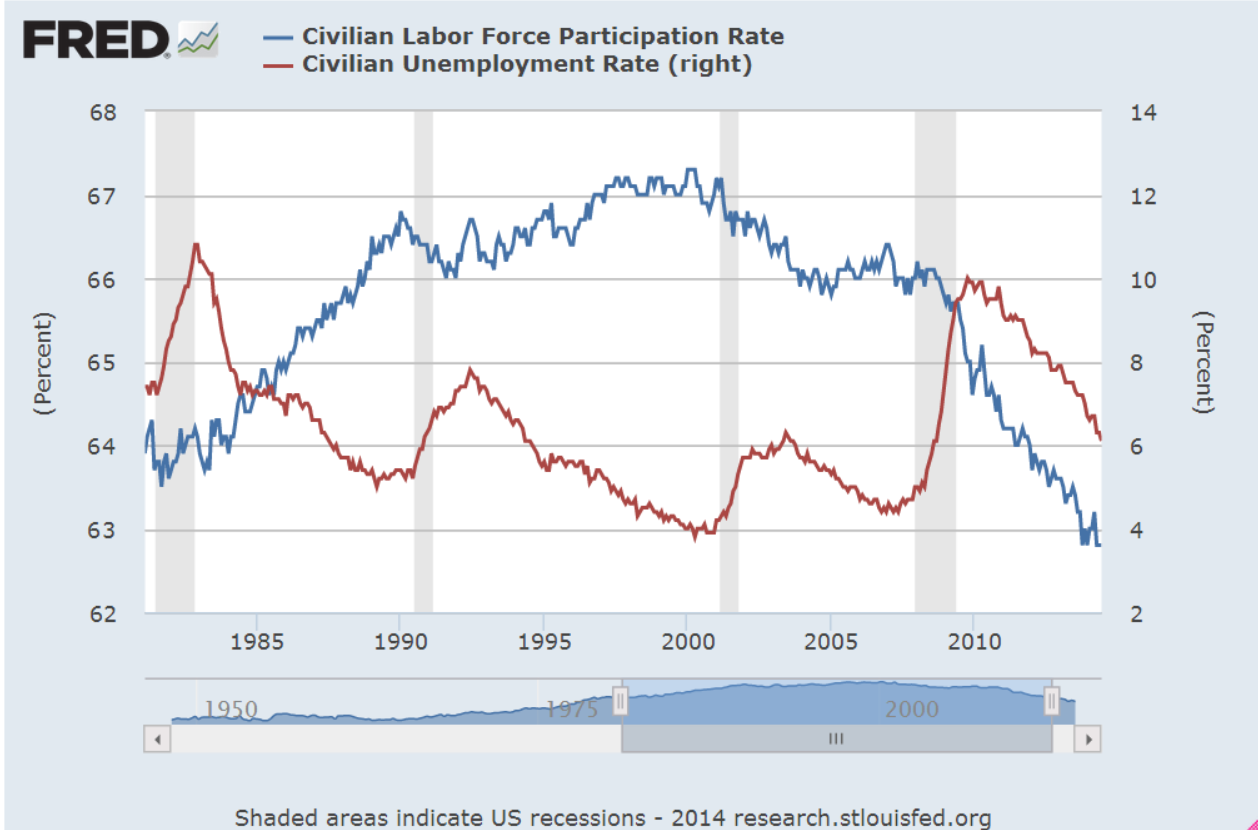
Now let’s divide the Participation Rate by the Unemployment Rate and we see that this ratio is still below the 34 year average.

********************
Wage Growth
Each month the BLS reports average weekly earnings as part of the labor report. Year-over-year inflation adjusted wage growth is flat but has probably declined below zero.
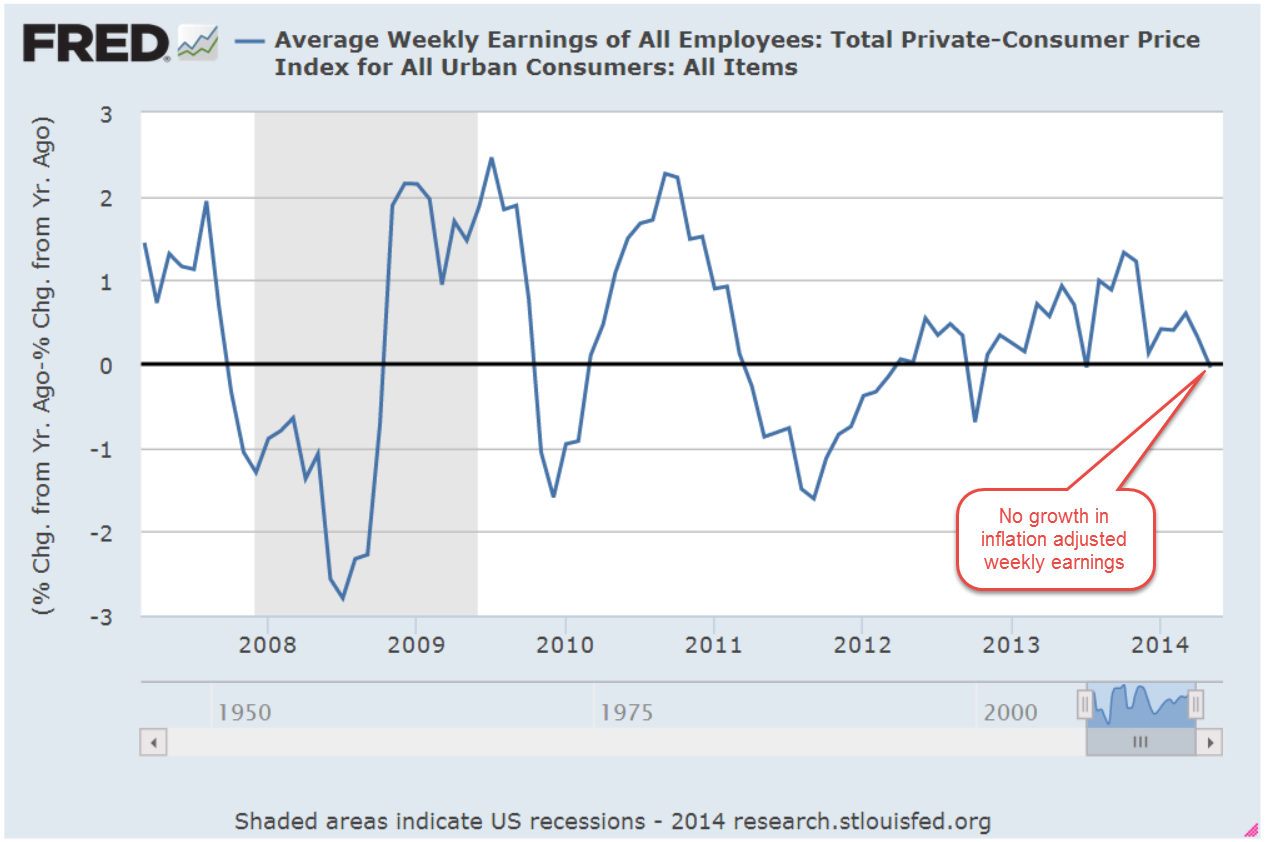
An investor would have done very well for themselves if they had paid attention to this one indicator. (There is a week lag between the end of the month price of SP500 and the release of the employment report for that month but it is close enough for this medium to long term analysis.)

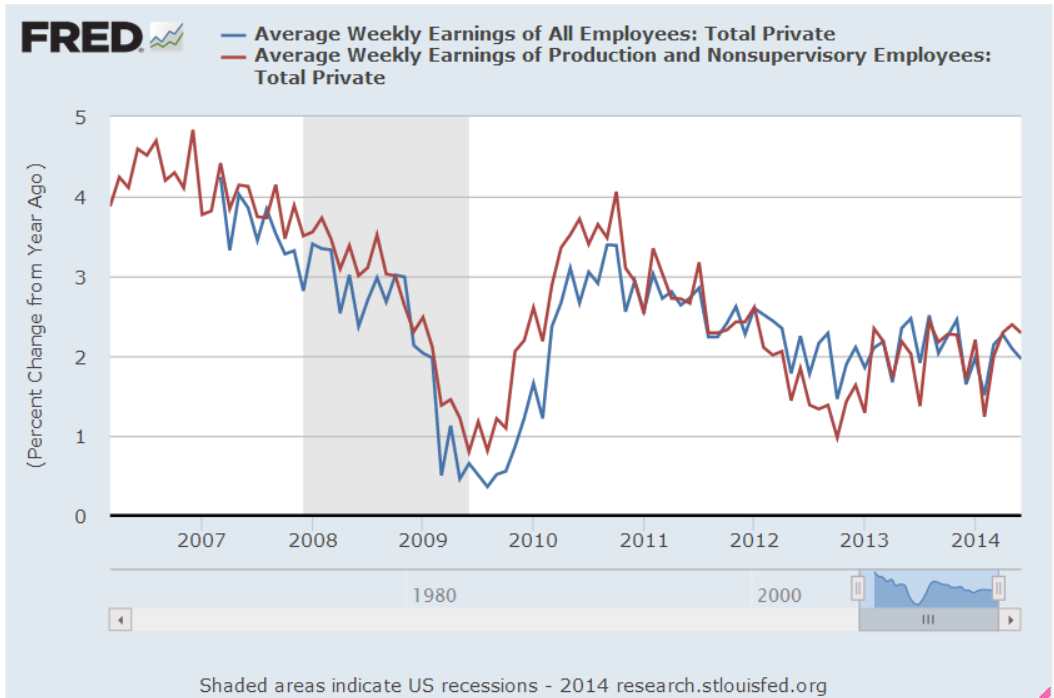
The SP500 has gained almost 50% since the first quarter of 2006. An investor going in and out of the market when inflation-adjusted wage growth crossed firmly above and below 0% would have made 134% during that same period. “Ah, ha! The crystal ball that will give me a glimpse into the future!” The problem with any one indicator is that it may work for a period of time. This one has worked extremely well for the past eight years. This series which includes all employees goes back only to March 2006. The series that includes only Production and Non-Supervisory employees goes back to 1964. The two series closely track each other. I have left the CPI adjustment out of both series to show the comparison.
However, an investor using this strategy in the mid-1990s would have been out of the market during a 33% rise. She would have been in the market during half of the 2000-2002 downturn and been mostly out of the market during an almost 50% rise from 2003-2005. In approximately twenty years, she would have made half as much as simply staying in the market.
The ups and downs of wage growth may not be a reliable indicator of the market’s direction but it does indicate positive and negative economic pressures. Poor wage growth in the mid-2000s probably fueled speculation in real estate and the stock market.

From the mid-1980s to the mid-1990s, a decade of negative inflation adjusted wage growth exerted downward pressure on labor income, which naturally led to a stratospheric increase in household debt.
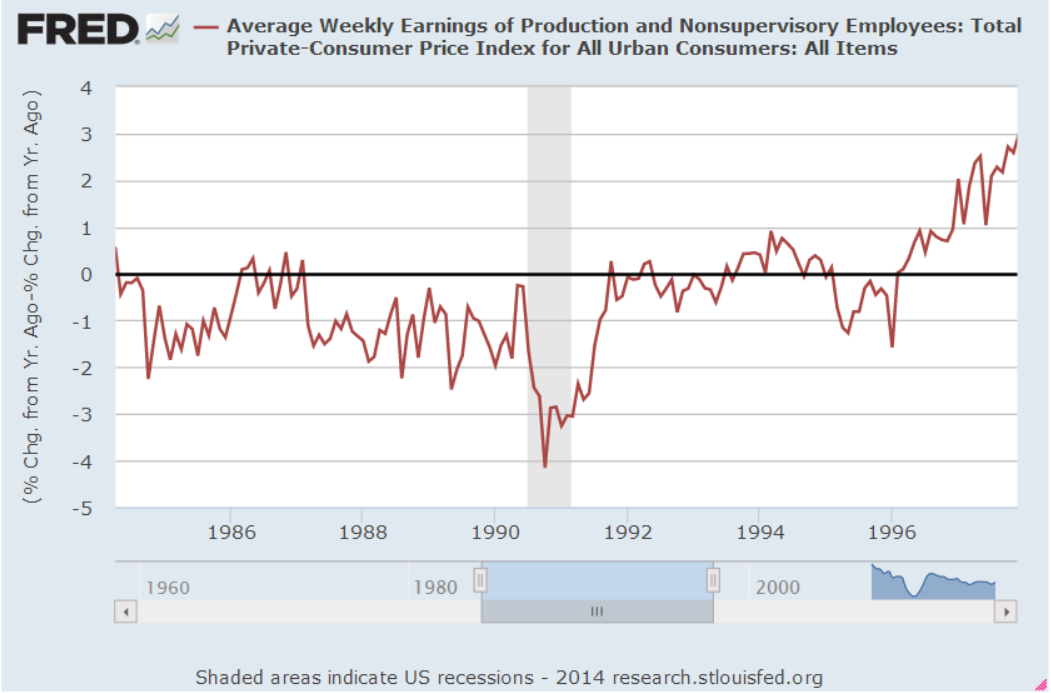
The stock market quintupled as inflation adjusted wages stagnated. During this period an investor would have been better to do the opposite: buy when wage growth fell below zero, sell when it crossed above. As long as workers were willing and able to borrow to make up for the lack of wage growth, company profits could continue to grow and it is profits that ultimately drive stock market valuations.
Wage growth ultimately influences retail sales which impacts GDP growth. The difference between the growth in retail sales and wage growth roughly tracks changes in GDP.

If retail sales growth is more than wage growth for a number of years, the imbalance has to eventually correct. We are in a period of little wage growth and modest sales growth which means that GDP growth is likely to remain modest as well.
**********************
Constant Weighted Purchasing Index (CWPI)
Purchasing Managers surveyed by the Institute for Supply Management continue to report strong growth. The CWPI index, based on both the Manufacturing and Services surveys, continues to rise as expected.
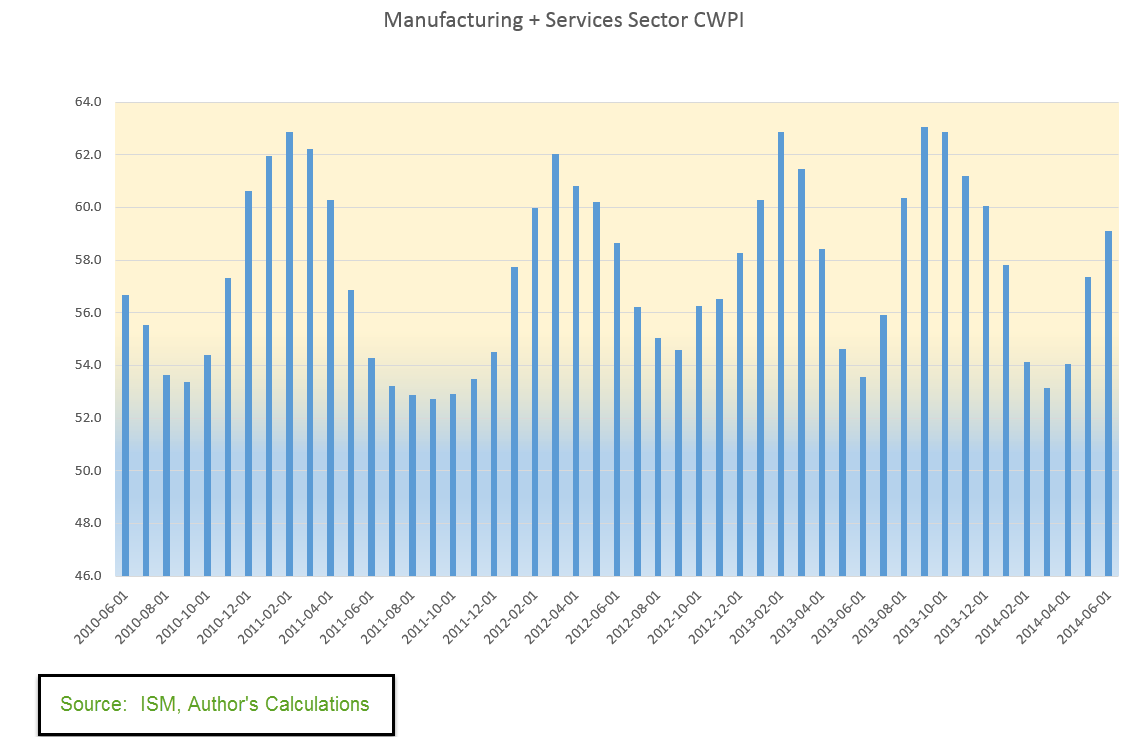
A composite of new orders and employment in the services sector remains strong. February’s dip below 50 was an anomaly caused by the severe winter weather which coincided with inventory adjustments.

We see that this is a cyclic indicator, responding to the push and tug of new orders, employment, deliveries and inventories. If the pattern continues, we would expect a decline in activity in the several months before the Christmas shopping season, a cycle that we have not seen since 2006.
The CWPI generates buy and sell signals when the index crosses firmly above and below 50 and has generated only 8 trades, or 16 separate transactions, in the past 17 years. It is suited more to the long term investor who simply wants to avoid a majority of the pain of a severe downturn in the market. Because it charts a composite of economic activity, it will not generate a signal in response to political events like the budget disagreement in July 2011 that led to an almost 20% drop in the market. A strategy based on the CWPI gained 180% over the past 17 years as the market gained about 110%.
************************
Takeaways
Strong employment report but wage growth is flat and declining on a year over year basis. CWPI indicator continues to rise up from the winter doldrums and should peak in two months.
