August 4th, 2013
First week of the month and several good monthly reports helped propel the SP500 through the 1700 mark this week, making an all time high. Last week I wrote that the market would be cautious and the first few trading days of the week was exactly that, drifting sideways. On Thursday the release of a suprisingly strong ISM Manufacturing report gave an upward jolt to the market. In several recent blogs on the ISM and an alternative composite called the CWI, we could see that manufacturing has been sliding toward the neutral mark of 50 for the past several months. On Monday, the ISM non-manufacturing index will be released and next week I hope to update the CWI.
Ultimately, the market rides up or down on the anticipation of future earnings. However, earnings can be “managed,” to put it politely. Further confusing the earnings picture for a casual investor are the several different types of earnings: operating, pro-forma and GAAP to mention a few. There are two types of “future”, or projected, earnings: bottom up and top down.
A simpler approach that some investors use is to calculate the Price Dividend ratio. There is no fudging of cash dividends to investors. Robert Shiller, author of the 2005 book “Irrational Exuberance”, updates the data used in his book. These include the SP500 index, earnings, dividends, the CPI and a Price Earnings ratio that is based on the past ten years of earnings. The current ratio of 23.80 is lower than the 2006 ratios which were in the high twenties.
But let’s look at the Price Dividend, or PD, ratio. For the past ten years that ratio has averaged a bit less than 52, meaning that investors have been willing to pay almost 52 times the amount of the dividend to own the stock. As of June 30th, the PD ratio stood at a bit more than 48, which means that stocks were a bit cheaper than average at this date. Since then the market has gone up about 6% so that the PD ratio is now about 51, or just about average.
As the market makes new highs, investors are prone to ask themselves if the price they are paying for stocks is too high. The long term investor might take a different perspective and ask themselves, “How will I feel in ten years if I continued to put money into the stock market now?” Ten years from now, in the year 2023, the answer will be “Well, I didn’t get a deal and I didn’t overpay based on the information available at the time. I paid about average.”
McGraw-Hill, the publisher of the SP500 market index, also keeps an index of dividends.

Dividend growth has plateaued and is about a third of earnings, which means that companies are paying a third of their earnings back to investors in the form of dividends. This is just slightly more than the median for the past ten years.
There was a lot of data to digest in this past week. The GDP estimates for the 2nd quarter was a sluggish 1.7%, more than the expectation of 1.1%. But – always that but – the 1st quarter GDP growth was revised down from 1.7% to 1.1%.
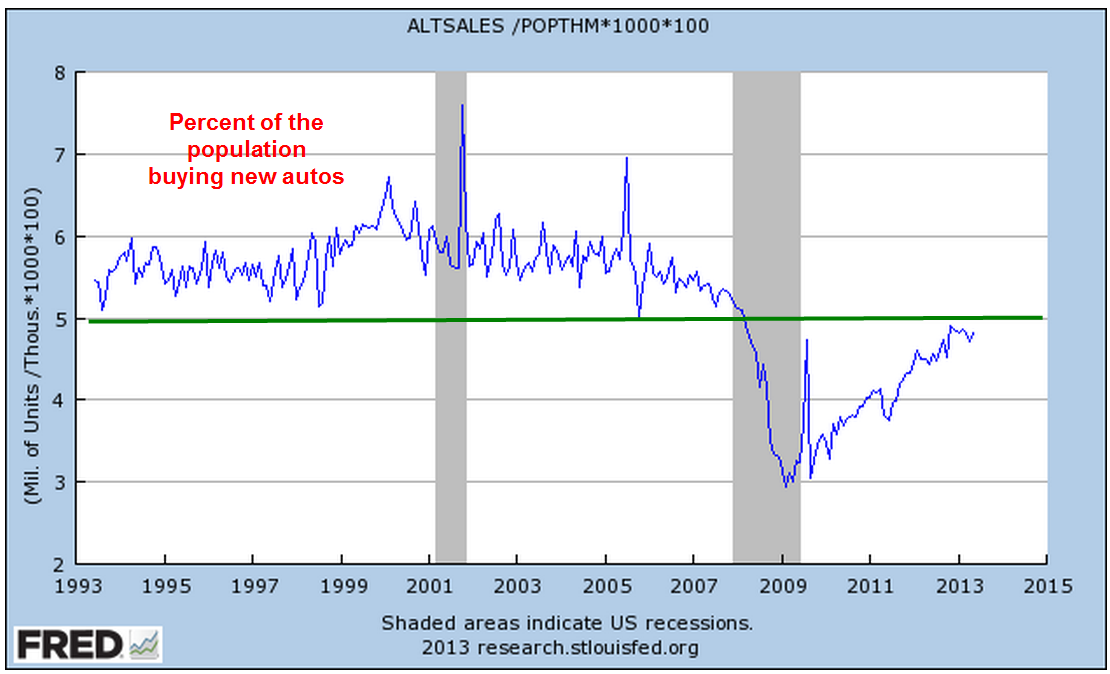
On Thursday, the same day as the ISM manufacturing report, came the monthly report on auto sales. Total sales of light weight vehicles, which includes cars and pickups, increased about 4% this past month to an annualized amount of 16 million vehicles.

When we look at auto sales on a per capita basis, auto sales are still below 5% of the population, a level that would show me that consumer demand and the construction industry (pickup trucks) is healthy. As we can see from the chart below, the sale of autos stayed consistently above that 5% level for more than 20 years – until the last recession began.
Employment in the production of motor vehicles and related parts is very weak.

Although vehicle sales includes both imports and domestics, I wanted to see how many autos are sold per person employed in automotive production. Advances in manufacturing and the mix of import and domestically made vehicles have impacted employment.

And with that, I’ll look briefly at the Employment Report for July released this past Friday. On Wednesday, ADP reported 200,000 private jobs gained, giving a brief upward impetus to the market. As I noted last week, caution would be the watchword of this week and that caution showed in later trading on Wednesday. The ADP report did give some hope that the BLS employment report would show an approximate gain of that many jobs. Instead, the employment gains from the BLS were disappointing, at 162,000. A further disappointment were the small downward revisons in May and June’s employment gains, totalling -26,000.
The unemployment rate declined, from 7.6% to 7.4%, but for the wrong reasons. For any number of reasons – disappointment, frustration, going back to school, retirement – 240,000 people dropped out of the work force. This is close to the reduction of 257,000 in the ranks of the unemployed. After declines or relative stability in the number of “drop outs” in recent months, this month’s surge was particularly disappointing.
Job gains in the core work force aged 25 -54 remains relatively flat.

While older workers continue to add jobs

Business Services and Health Care jobs continued their strong job gains but gains in the health care field have slowed from 27,000 per month in 2012 to only 16,000 in 2013. Sit down for this one – government workers, mostly at the local level, actually gained 1,000 in July.
Despite the decline in unemployment, the tepid employment and GDP growth reports likely reassured many that the Fed is unlikely to stop or reduce their quantitative easing program in the next few months.
