February 8, 2015
Employment
Employment gains in January were at the midpoint of expectations but revisions to the gains of November and December were significant, adding about 70,000 jobs in each month. After a decline in December, average hourly earnings rose to $24.75, for a year-over-year gain of 2.2% and a good 1% above inflation.
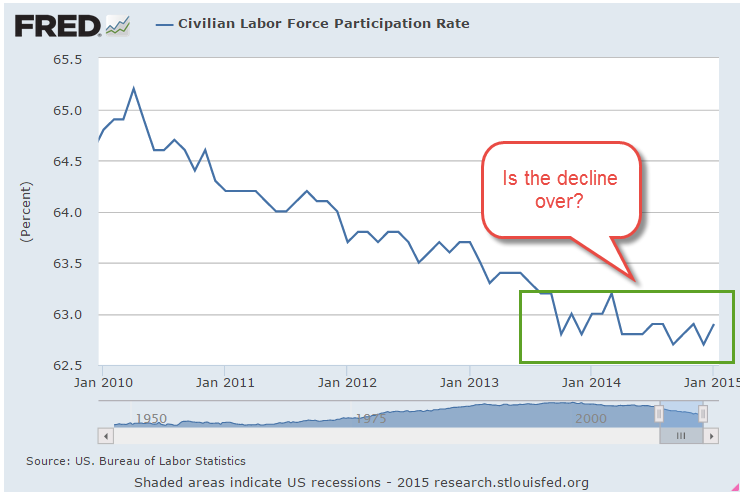
In a sign that people are becoming more optimistic about job prospects, the Participation Rate increased 2/10ths of a percent in January. After 5 years of decline, this rate may have found a bottom over the past year.
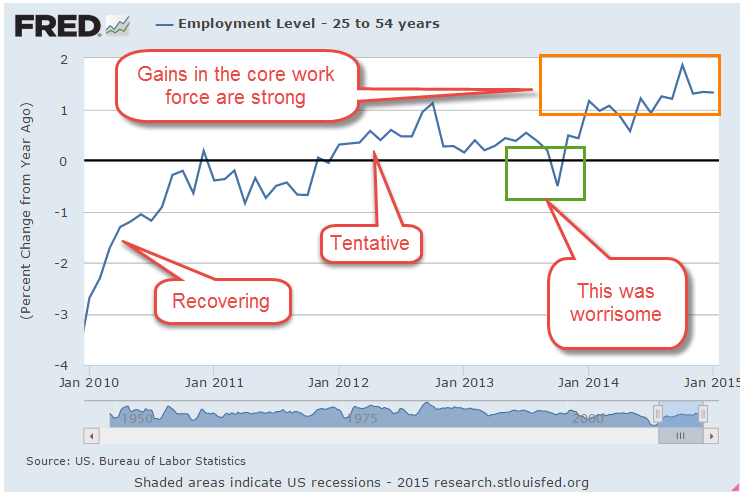
The health or frailty of the core work force aged 25 – 54 years is a snapshot of the underlying strength of the labor market. This age band constitutes our primary working years. In the first half of this thirty year period we build job skills, work and social connections, establish credit, and accumulate relationships and stuff. Year-over-year growth in the 1 to 2% zone is the preferred “Goldilocks” growth rate.

As the graph below shows, the growth rate has been above 1% for most of the past year.
Monthly gains in construction employment have overtaken professional business services and the health care industry.

The construction industry accounts for less than 5% of employment but each employee accounts for a total of $160,000 in spending so changes affect other industries. As you can see in the graph below, real or inflation-adjusted construction spending per employee was relatively stable during the 1990s. As the housing market boomed, spending per employee rose dramatically in the 3-1/2 years from late 2002 to early 2006. In the worst throes of the recession when the industry shed almost a quarter of its employees, per employee spending stabilized at the same level as the 1990s.
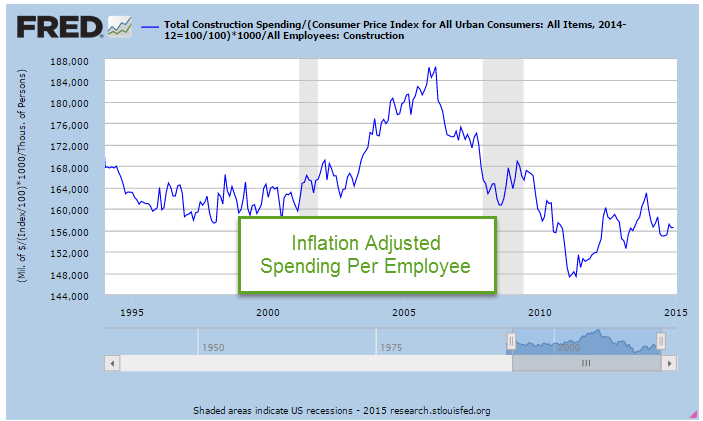
Stimulus spending and Build America projects helped cushion the decline in construction spending but as those programs concluded, spending fell to a multi-decade low in the spring of 2011. Despite historically low interest rates and increasing state and municipal tax revenues, both residential and commercial construction are below the benchmark set in the 1990s. Despite strong gains in the past two years, the industry still has room to run.
As the economy improves, those working part time because they can not get full time work has decreased significantly from the nosebleed heights of five years ago.

That total includes those whose hours have been cut back because of slack business conditions. A subset of that total are the number of workers who are working part time because they can not find a full time job. This segment of workers has seen little change during this recovery.

*****************************
Purchasing Manager’s Index
Each month I update a composite index of the ISM Purchasing Manager’s indexes (PMI) first introduced by economist Rolando Pelaez in 2003. This composite, the Constant Weighted Purchasing Index, or CWPI, reached record highs in October 2014. It is no surprise that, this month, the BLS revised November’s employment gains upwards by 70,000 to over 420,000. As expected, the composite has declined but remains robust.

The wave like pattern of present and anticipated industrial activity has quickened since early 2013, the troughs and crests coming closer together. If this pattern continues, we should expect gradual declines over the next two months before rising up again. A combination of employment and new orders in the service sectors continues to show healthy growth, although it has also declined from the strong growth of the past few months.

